West Indian vs Immigrants from Argentina Disability Age 18 to 34
COMPARE
West Indian
Immigrants from Argentina
Disability Age 18 to 34
Disability Age 18 to 34 Comparison
West Indians
Immigrants from Argentina
6.3%
DISABILITY AGE 18 TO 34
92.0/ 100
METRIC RATING
127th/ 347
METRIC RANK
5.7%
DISABILITY AGE 18 TO 34
100.0/ 100
METRIC RATING
24th/ 347
METRIC RANK
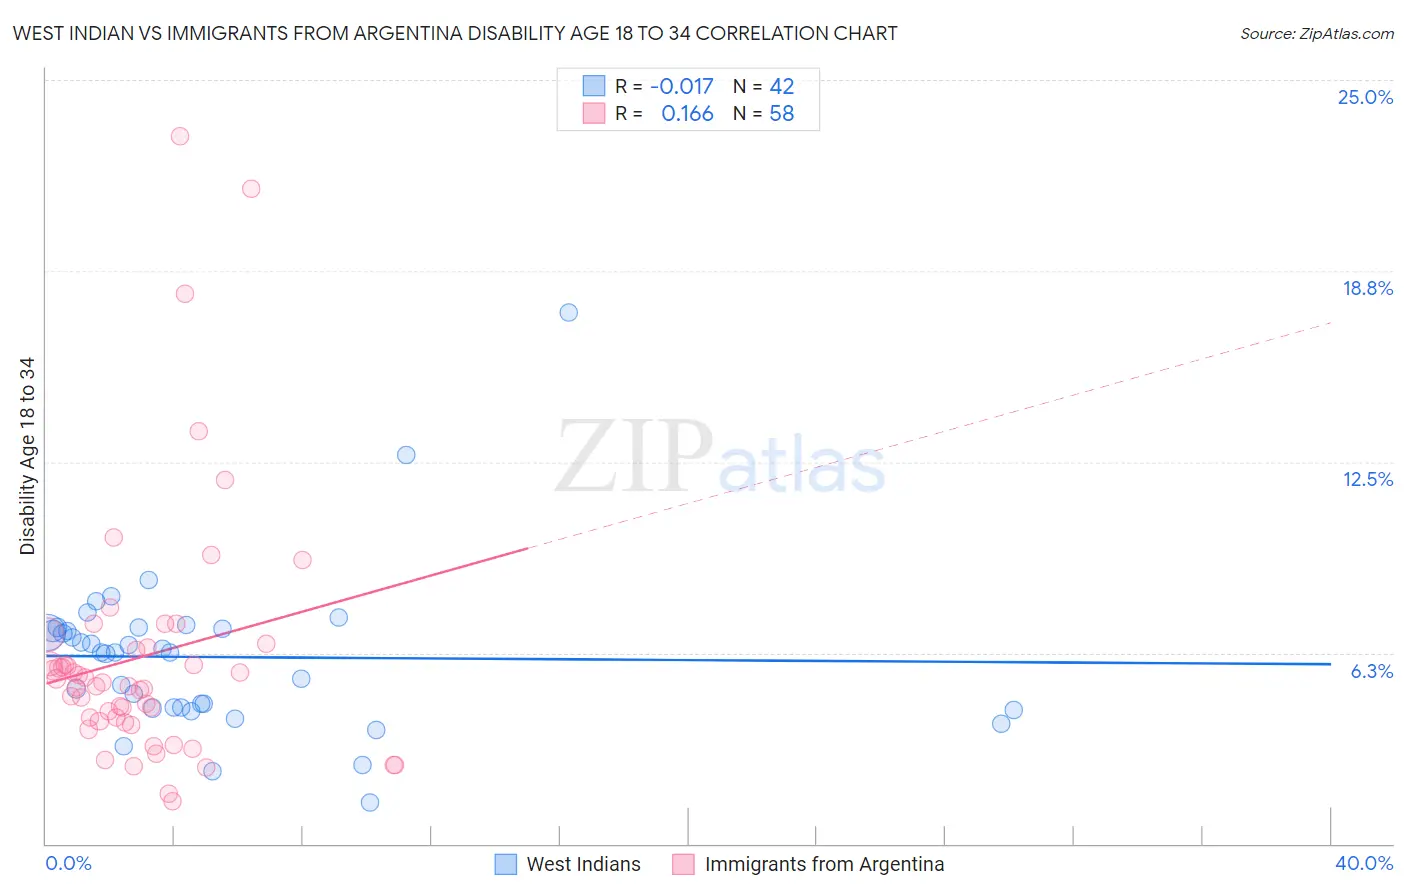
West Indian vs Immigrants from Argentina Disability Age 18 to 34 Correlation Chart
The statistical analysis conducted on geographies consisting of 253,877,973 people shows no correlation between the proportion of West Indians and percentage of population with a disability between the ages 18 and 35 in the United States with a correlation coefficient (R) of -0.017 and weighted average of 6.3%. Similarly, the statistical analysis conducted on geographies consisting of 264,114,052 people shows a poor positive correlation between the proportion of Immigrants from Argentina and percentage of population with a disability between the ages 18 and 35 in the United States with a correlation coefficient (R) of 0.166 and weighted average of 5.7%, a difference of 10.6%.
Disability Age 18 to 34 Correlation Summary
| Measurement | West Indian | Immigrants from Argentina |
| Minimum | 1.4% | 1.4% |
| Maximum | 17.4% | 23.2% |
| Range | 16.0% | 21.8% |
| Mean | 6.1% | 6.1% |
| Median | 6.3% | 5.2% |
| Interquartile 25% (IQ1) | 4.4% | 4.0% |
| Interquartile 75% (IQ3) | 7.0% | 6.4% |
| Interquartile Range (IQR) | 2.6% | 2.4% |
| Standard Deviation (Sample) | 2.7% | 4.2% |
| Standard Deviation (Population) | 2.6% | 4.1% |
Similar Demographics by Disability Age 18 to 34
Demographics Similar to West Indians by Disability Age 18 to 34
In terms of disability age 18 to 34, the demographic groups most similar to West Indians are Chinese (6.3%, a difference of 0.010%), Immigrants from Switzerland (6.3%, a difference of 0.14%), Macedonian (6.3%, a difference of 0.16%), Immigrants from Morocco (6.3%, a difference of 0.23%), and Costa Rican (6.3%, a difference of 0.25%).
| Demographics | Rating | Rank | Disability Age 18 to 34 |
| Immigrants | Ukraine | 93.4 /100 | #120 | Exceptional 6.3% |
| Immigrants | Guatemala | 93.4 /100 | #121 | Exceptional 6.3% |
| Immigrants | Czechoslovakia | 93.3 /100 | #122 | Exceptional 6.3% |
| Costa Ricans | 92.9 /100 | #123 | Exceptional 6.3% |
| Immigrants | Morocco | 92.9 /100 | #124 | Exceptional 6.3% |
| Macedonians | 92.6 /100 | #125 | Exceptional 6.3% |
| Immigrants | Switzerland | 92.5 /100 | #126 | Exceptional 6.3% |
| West Indians | 92.0 /100 | #127 | Exceptional 6.3% |
| Chinese | 91.9 /100 | #128 | Exceptional 6.3% |
| Immigrants | Italy | 90.5 /100 | #129 | Exceptional 6.3% |
| Immigrants | Dominica | 90.5 /100 | #130 | Exceptional 6.3% |
| Immigrants | Saudi Arabia | 90.4 /100 | #131 | Exceptional 6.3% |
| Guatemalans | 89.6 /100 | #132 | Excellent 6.4% |
| Brazilians | 89.0 /100 | #133 | Excellent 6.4% |
| Immigrants | Europe | 88.8 /100 | #134 | Excellent 6.4% |
Demographics Similar to Immigrants from Argentina by Disability Age 18 to 34
In terms of disability age 18 to 34, the demographic groups most similar to Immigrants from Argentina are Immigrants from Singapore (5.7%, a difference of 0.040%), Cuban (5.7%, a difference of 0.10%), Immigrants from Colombia (5.7%, a difference of 0.19%), Immigrants from Venezuela (5.7%, a difference of 0.30%), and Soviet Union (5.7%, a difference of 0.39%).
| Demographics | Rating | Rank | Disability Age 18 to 34 |
| Immigrants | Eastern Asia | 100.0 /100 | #17 | Exceptional 5.6% |
| Immigrants | Bolivia | 100.0 /100 | #18 | Exceptional 5.6% |
| Thais | 100.0 /100 | #19 | Exceptional 5.6% |
| Immigrants | Bangladesh | 100.0 /100 | #20 | Exceptional 5.6% |
| Immigrants | South Central Asia | 100.0 /100 | #21 | Exceptional 5.7% |
| Immigrants | Nicaragua | 100.0 /100 | #22 | Exceptional 5.7% |
| Cubans | 100.0 /100 | #23 | Exceptional 5.7% |
| Immigrants | Argentina | 100.0 /100 | #24 | Exceptional 5.7% |
| Immigrants | Singapore | 100.0 /100 | #25 | Exceptional 5.7% |
| Immigrants | Colombia | 100.0 /100 | #26 | Exceptional 5.7% |
| Immigrants | Venezuela | 99.9 /100 | #27 | Exceptional 5.7% |
| Soviet Union | 99.9 /100 | #28 | Exceptional 5.7% |
| Immigrants | Ecuador | 99.9 /100 | #29 | Exceptional 5.7% |
| Immigrants | Pakistan | 99.9 /100 | #30 | Exceptional 5.8% |
| Iranians | 99.9 /100 | #31 | Exceptional 5.8% |