Ute vs Thai Disability Age 35 to 64
COMPARE
Ute
Thai
Disability Age 35 to 64
Disability Age 35 to 64 Comparison
Ute
Thais
13.4%
DISABILITY AGE 35 TO 64
0.0/ 100
METRIC RATING
293rd/ 347
METRIC RANK
8.6%
DISABILITY AGE 35 TO 64
100.0/ 100
METRIC RATING
6th/ 347
METRIC RANK
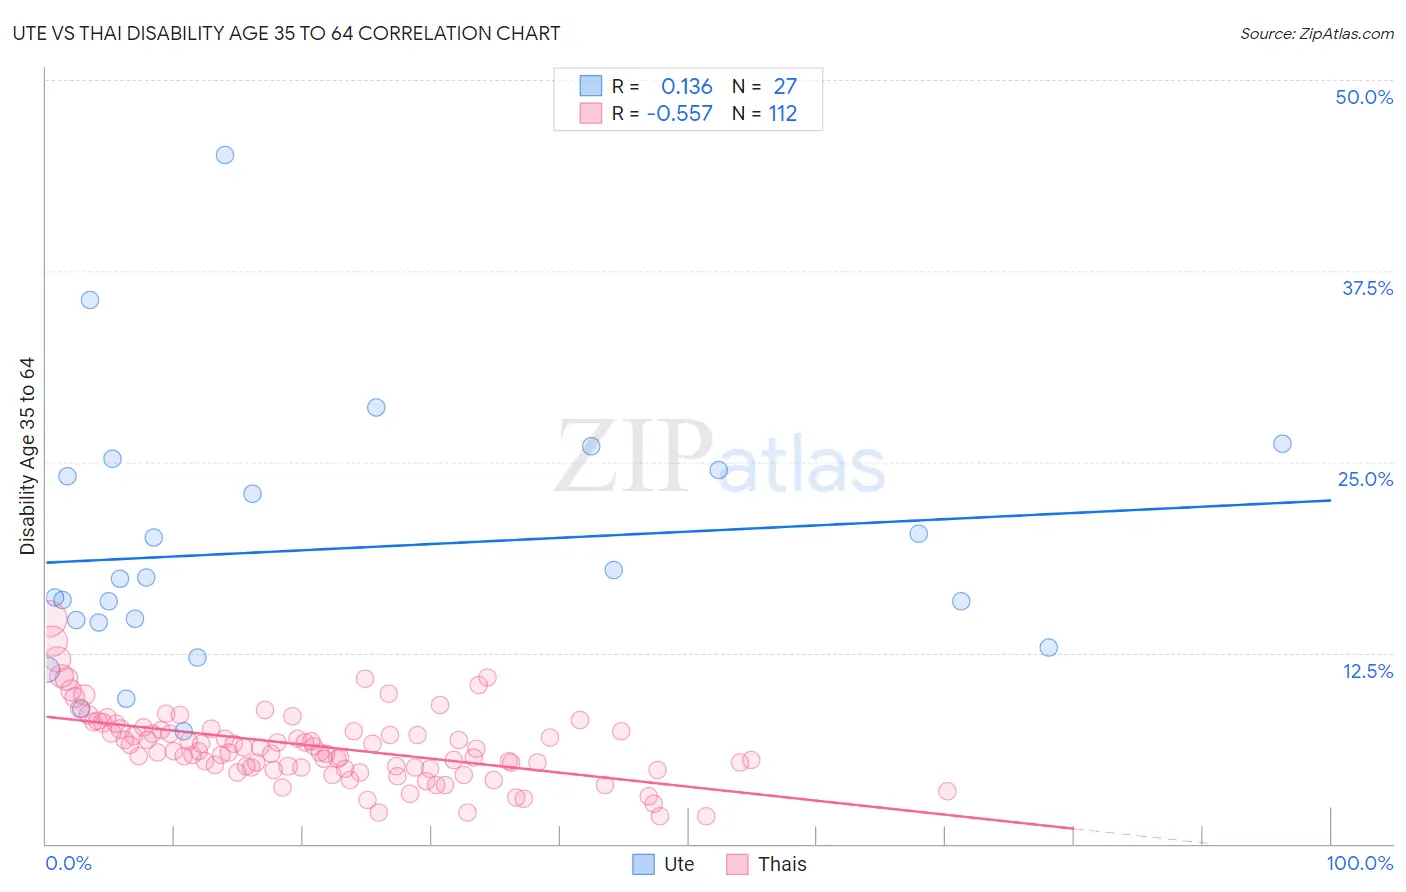
Ute vs Thai Disability Age 35 to 64 Correlation Chart
The statistical analysis conducted on geographies consisting of 55,657,463 people shows a poor positive correlation between the proportion of Ute and percentage of population with a disability between the ages 34 and 64 in the United States with a correlation coefficient (R) of 0.136 and weighted average of 13.4%. Similarly, the statistical analysis conducted on geographies consisting of 475,261,452 people shows a substantial negative correlation between the proportion of Thais and percentage of population with a disability between the ages 34 and 64 in the United States with a correlation coefficient (R) of -0.557 and weighted average of 8.6%, a difference of 56.0%.
Disability Age 35 to 64 Correlation Summary
| Measurement | Ute | Thai |
| Minimum | 7.4% | 1.8% |
| Maximum | 45.1% | 14.7% |
| Range | 37.7% | 12.9% |
| Mean | 19.3% | 6.4% |
| Median | 17.4% | 6.1% |
| Interquartile 25% (IQ1) | 14.4% | 5.0% |
| Interquartile 75% (IQ3) | 24.4% | 7.5% |
| Interquartile Range (IQR) | 10.0% | 2.5% |
| Standard Deviation (Sample) | 8.4% | 2.3% |
| Standard Deviation (Population) | 8.2% | 2.3% |
Similar Demographics by Disability Age 35 to 64
Demographics Similar to Ute by Disability Age 35 to 64
In terms of disability age 35 to 64, the demographic groups most similar to Ute are Puget Sound Salish (13.3%, a difference of 0.47%), Immigrants from Congo (13.3%, a difference of 0.52%), Yaqui (13.5%, a difference of 0.58%), Immigrants from Liberia (13.2%, a difference of 1.0%), and Indonesian (13.2%, a difference of 1.1%).
| Demographics | Rating | Rank | Disability Age 35 to 64 |
| Hmong | 0.0 /100 | #286 | Tragic 13.1% |
| Tlingit-Haida | 0.0 /100 | #287 | Tragic 13.2% |
| Fijians | 0.0 /100 | #288 | Tragic 13.2% |
| Indonesians | 0.0 /100 | #289 | Tragic 13.2% |
| Immigrants | Liberia | 0.0 /100 | #290 | Tragic 13.2% |
| Immigrants | Congo | 0.0 /100 | #291 | Tragic 13.3% |
| Puget Sound Salish | 0.0 /100 | #292 | Tragic 13.3% |
| Ute | 0.0 /100 | #293 | Tragic 13.4% |
| Yaqui | 0.0 /100 | #294 | Tragic 13.5% |
| Yakama | 0.0 /100 | #295 | Tragic 13.6% |
| Africans | 0.0 /100 | #296 | Tragic 13.6% |
| Bangladeshis | 0.0 /100 | #297 | Tragic 13.6% |
| Cheyenne | 0.0 /100 | #298 | Tragic 13.6% |
| Spanish Americans | 0.0 /100 | #299 | Tragic 13.7% |
| Delaware | 0.0 /100 | #300 | Tragic 13.7% |
Demographics Similar to Thais by Disability Age 35 to 64
In terms of disability age 35 to 64, the demographic groups most similar to Thais are Immigrants from Israel (8.6%, a difference of 0.42%), Immigrants from Iran (8.5%, a difference of 1.0%), Iranian (8.7%, a difference of 1.0%), Immigrants from China (8.7%, a difference of 1.4%), and Immigrants from Bolivia (8.7%, a difference of 1.7%).
| Demographics | Rating | Rank | Disability Age 35 to 64 |
| Immigrants | Taiwan | 100.0 /100 | #1 | Exceptional 7.8% |
| Filipinos | 100.0 /100 | #2 | Exceptional 8.0% |
| Immigrants | Hong Kong | 100.0 /100 | #3 | Exceptional 8.2% |
| Immigrants | India | 100.0 /100 | #4 | Exceptional 8.3% |
| Immigrants | Iran | 100.0 /100 | #5 | Exceptional 8.5% |
| Thais | 100.0 /100 | #6 | Exceptional 8.6% |
| Immigrants | Israel | 100.0 /100 | #7 | Exceptional 8.6% |
| Iranians | 100.0 /100 | #8 | Exceptional 8.7% |
| Immigrants | China | 100.0 /100 | #9 | Exceptional 8.7% |
| Immigrants | Bolivia | 100.0 /100 | #10 | Exceptional 8.7% |
| Immigrants | Eastern Asia | 100.0 /100 | #11 | Exceptional 8.8% |
| Indians (Asian) | 100.0 /100 | #12 | Exceptional 8.9% |
| Immigrants | South Central Asia | 100.0 /100 | #13 | Exceptional 8.9% |
| Immigrants | Singapore | 100.0 /100 | #14 | Exceptional 8.9% |
| Bolivians | 100.0 /100 | #15 | Exceptional 8.9% |