Thai vs Immigrants from Spain Disability Age 35 to 64
COMPARE
Thai
Immigrants from Spain
Disability Age 35 to 64
Disability Age 35 to 64 Comparison
Thais
Immigrants from Spain
8.6%
DISABILITY AGE 35 TO 64
100.0/ 100
METRIC RATING
6th/ 347
METRIC RANK
10.0%
DISABILITY AGE 35 TO 64
99.7/ 100
METRIC RATING
61st/ 347
METRIC RANK
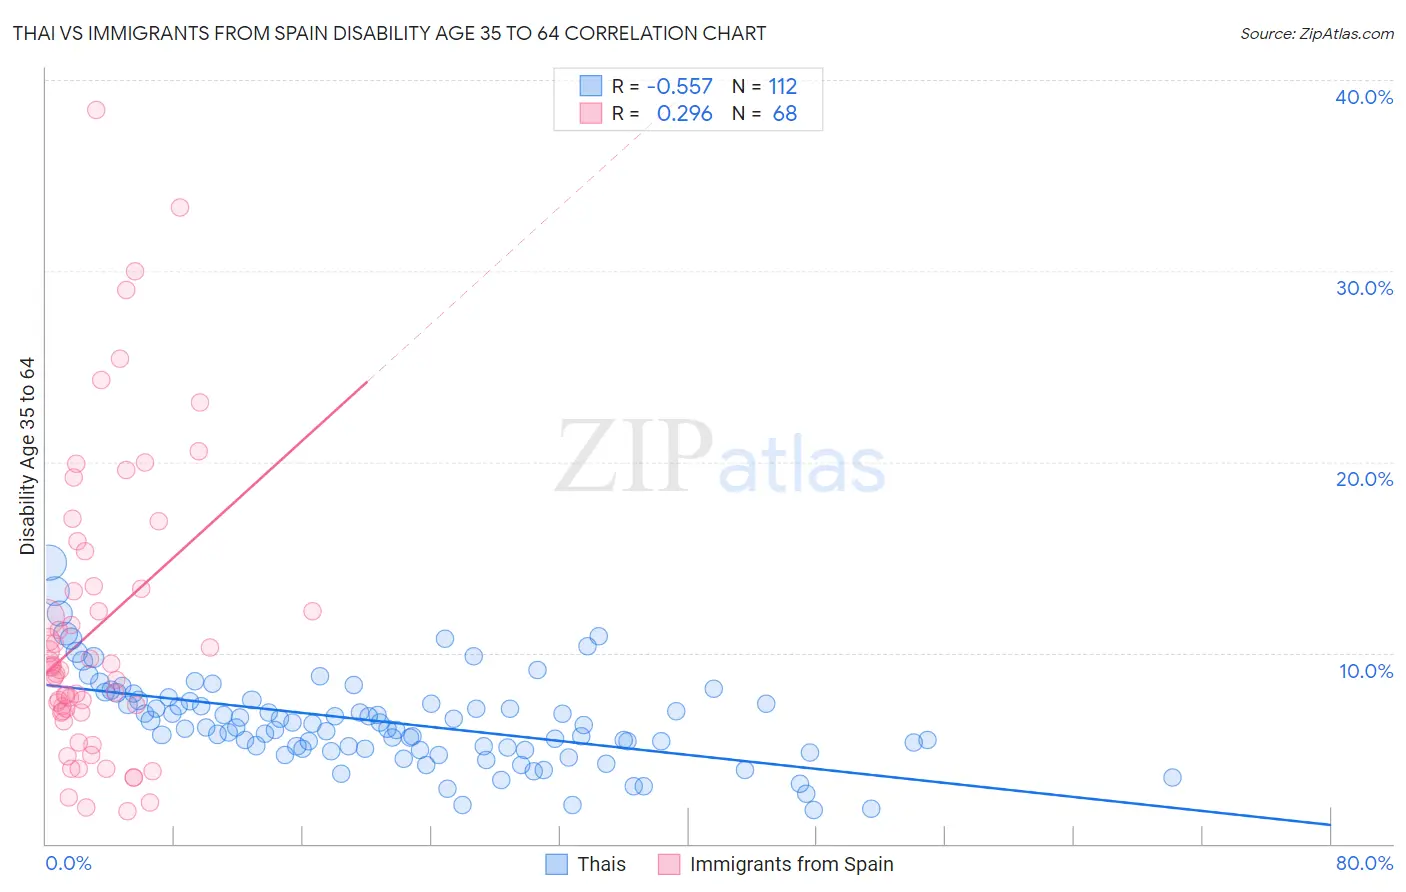
Thai vs Immigrants from Spain Disability Age 35 to 64 Correlation Chart
The statistical analysis conducted on geographies consisting of 475,261,452 people shows a substantial negative correlation between the proportion of Thais and percentage of population with a disability between the ages 34 and 64 in the United States with a correlation coefficient (R) of -0.557 and weighted average of 8.6%. Similarly, the statistical analysis conducted on geographies consisting of 239,593,165 people shows a weak positive correlation between the proportion of Immigrants from Spain and percentage of population with a disability between the ages 34 and 64 in the United States with a correlation coefficient (R) of 0.296 and weighted average of 10.0%, a difference of 16.0%.
Disability Age 35 to 64 Correlation Summary
| Measurement | Thai | Immigrants from Spain |
| Minimum | 1.8% | 1.7% |
| Maximum | 14.7% | 38.5% |
| Range | 12.9% | 36.8% |
| Mean | 6.4% | 11.3% |
| Median | 6.1% | 9.2% |
| Interquartile 25% (IQ1) | 5.0% | 6.9% |
| Interquartile 75% (IQ3) | 7.5% | 13.4% |
| Interquartile Range (IQR) | 2.5% | 6.5% |
| Standard Deviation (Sample) | 2.3% | 7.7% |
| Standard Deviation (Population) | 2.3% | 7.7% |
Similar Demographics by Disability Age 35 to 64
Demographics Similar to Thais by Disability Age 35 to 64
In terms of disability age 35 to 64, the demographic groups most similar to Thais are Immigrants from Israel (8.6%, a difference of 0.42%), Immigrants from Iran (8.5%, a difference of 1.0%), Iranian (8.7%, a difference of 1.0%), Immigrants from China (8.7%, a difference of 1.4%), and Immigrants from Bolivia (8.7%, a difference of 1.7%).
| Demographics | Rating | Rank | Disability Age 35 to 64 |
| Immigrants | Taiwan | 100.0 /100 | #1 | Exceptional 7.8% |
| Filipinos | 100.0 /100 | #2 | Exceptional 8.0% |
| Immigrants | Hong Kong | 100.0 /100 | #3 | Exceptional 8.2% |
| Immigrants | India | 100.0 /100 | #4 | Exceptional 8.3% |
| Immigrants | Iran | 100.0 /100 | #5 | Exceptional 8.5% |
| Thais | 100.0 /100 | #6 | Exceptional 8.6% |
| Immigrants | Israel | 100.0 /100 | #7 | Exceptional 8.6% |
| Iranians | 100.0 /100 | #8 | Exceptional 8.7% |
| Immigrants | China | 100.0 /100 | #9 | Exceptional 8.7% |
| Immigrants | Bolivia | 100.0 /100 | #10 | Exceptional 8.7% |
| Immigrants | Eastern Asia | 100.0 /100 | #11 | Exceptional 8.8% |
| Indians (Asian) | 100.0 /100 | #12 | Exceptional 8.9% |
| Immigrants | South Central Asia | 100.0 /100 | #13 | Exceptional 8.9% |
| Immigrants | Singapore | 100.0 /100 | #14 | Exceptional 8.9% |
| Bolivians | 100.0 /100 | #15 | Exceptional 8.9% |
Demographics Similar to Immigrants from Spain by Disability Age 35 to 64
In terms of disability age 35 to 64, the demographic groups most similar to Immigrants from Spain are Eastern European (10.0%, a difference of 0.10%), Immigrants from South America (9.9%, a difference of 0.12%), Immigrants from Czechoslovakia (10.0%, a difference of 0.22%), Immigrants from Sweden (9.9%, a difference of 0.33%), and Immigrants from Romania (10.0%, a difference of 0.41%).
| Demographics | Rating | Rank | Disability Age 35 to 64 |
| Immigrants | Russia | 99.8 /100 | #54 | Exceptional 9.8% |
| Peruvians | 99.8 /100 | #55 | Exceptional 9.9% |
| South Americans | 99.8 /100 | #56 | Exceptional 9.9% |
| Colombians | 99.8 /100 | #57 | Exceptional 9.9% |
| Armenians | 99.8 /100 | #58 | Exceptional 9.9% |
| Immigrants | Sweden | 99.7 /100 | #59 | Exceptional 9.9% |
| Immigrants | South America | 99.7 /100 | #60 | Exceptional 9.9% |
| Immigrants | Spain | 99.7 /100 | #61 | Exceptional 10.0% |
| Eastern Europeans | 99.7 /100 | #62 | Exceptional 10.0% |
| Immigrants | Czechoslovakia | 99.7 /100 | #63 | Exceptional 10.0% |
| Immigrants | Romania | 99.7 /100 | #64 | Exceptional 10.0% |
| Immigrants | Poland | 99.6 /100 | #65 | Exceptional 10.0% |
| Cubans | 99.6 /100 | #66 | Exceptional 10.0% |
| Immigrants | Uzbekistan | 99.5 /100 | #67 | Exceptional 10.1% |
| Immigrants | Switzerland | 99.5 /100 | #68 | Exceptional 10.1% |