Immigrants from Bahamas vs Immigrants from Spain Disability Age 35 to 64
COMPARE
Immigrants from Bahamas
Immigrants from Spain
Disability Age 35 to 64
Disability Age 35 to 64 Comparison
Immigrants from Bahamas
Immigrants from Spain
11.8%
DISABILITY AGE 35 TO 64
9.2/ 100
METRIC RATING
218th/ 347
METRIC RANK
10.0%
DISABILITY AGE 35 TO 64
99.7/ 100
METRIC RATING
61st/ 347
METRIC RANK
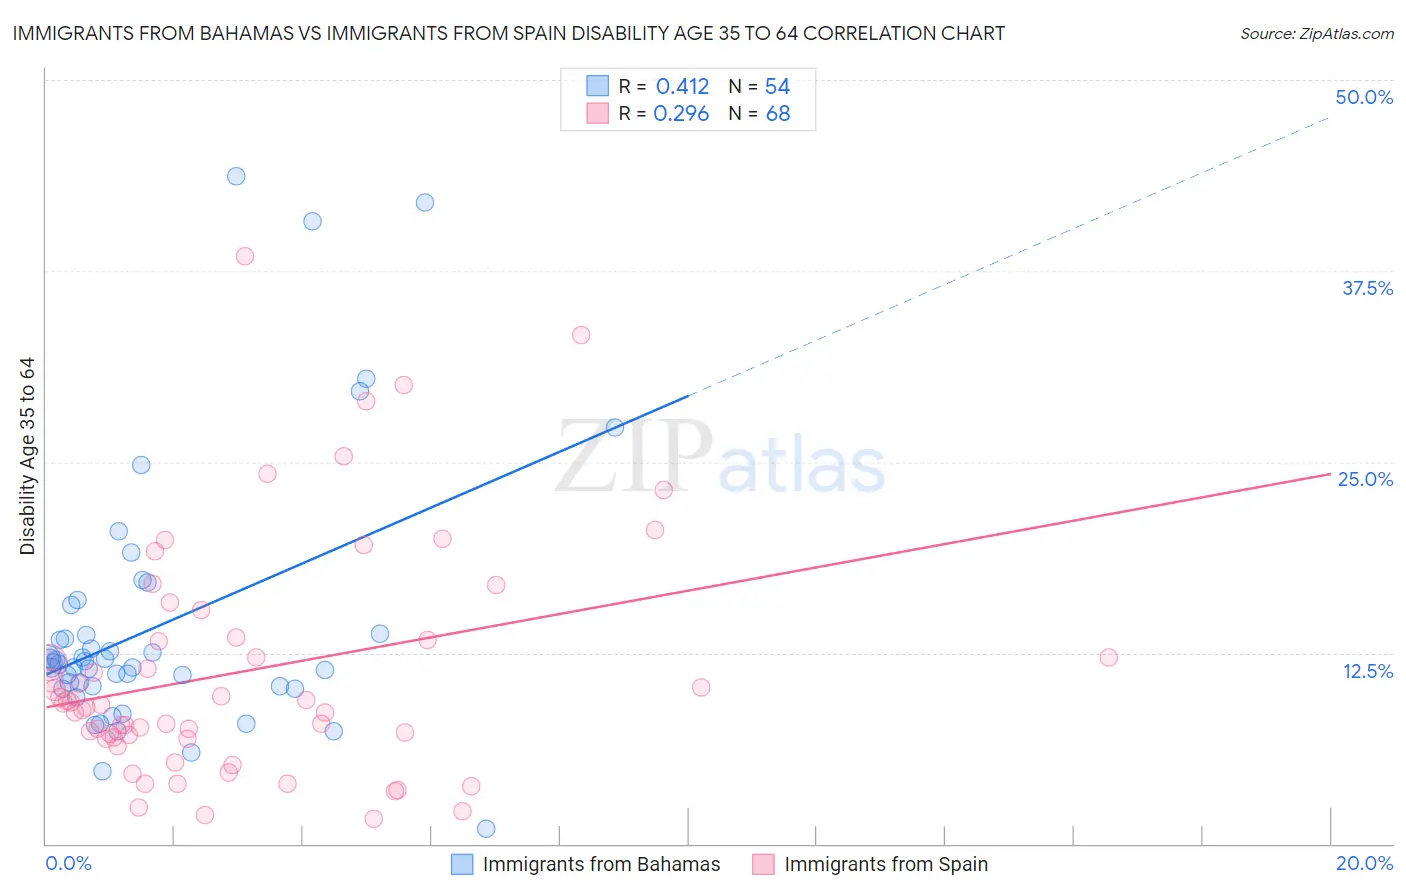
Immigrants from Bahamas vs Immigrants from Spain Disability Age 35 to 64 Correlation Chart
The statistical analysis conducted on geographies consisting of 104,614,213 people shows a moderate positive correlation between the proportion of Immigrants from Bahamas and percentage of population with a disability between the ages 34 and 64 in the United States with a correlation coefficient (R) of 0.412 and weighted average of 11.8%. Similarly, the statistical analysis conducted on geographies consisting of 239,593,165 people shows a weak positive correlation between the proportion of Immigrants from Spain and percentage of population with a disability between the ages 34 and 64 in the United States with a correlation coefficient (R) of 0.296 and weighted average of 10.0%, a difference of 18.5%.
Disability Age 35 to 64 Correlation Summary
| Measurement | Immigrants from Bahamas | Immigrants from Spain |
| Minimum | 0.98% | 1.7% |
| Maximum | 43.7% | 38.5% |
| Range | 42.7% | 36.8% |
| Mean | 14.3% | 11.3% |
| Median | 11.8% | 9.2% |
| Interquartile 25% (IQ1) | 10.3% | 6.9% |
| Interquartile 75% (IQ3) | 13.8% | 13.4% |
| Interquartile Range (IQR) | 3.4% | 6.5% |
| Standard Deviation (Sample) | 8.8% | 7.7% |
| Standard Deviation (Population) | 8.7% | 7.7% |
Similar Demographics by Disability Age 35 to 64
Demographics Similar to Immigrants from Bahamas by Disability Age 35 to 64
In terms of disability age 35 to 64, the demographic groups most similar to Immigrants from Bahamas are Czechoslovakian (11.8%, a difference of 0.040%), Barbadian (11.8%, a difference of 0.050%), Immigrants from West Indies (11.8%, a difference of 0.090%), Alsatian (11.8%, a difference of 0.18%), and Honduran (11.8%, a difference of 0.19%).
| Demographics | Rating | Rank | Disability Age 35 to 64 |
| Canadians | 13.0 /100 | #211 | Poor 11.7% |
| Immigrants | Jamaica | 11.8 /100 | #212 | Poor 11.7% |
| Yugoslavians | 11.6 /100 | #213 | Poor 11.7% |
| Immigrants | Sudan | 11.4 /100 | #214 | Poor 11.7% |
| Spanish American Indians | 11.1 /100 | #215 | Poor 11.7% |
| Bahamians | 10.7 /100 | #216 | Poor 11.8% |
| Barbadians | 9.5 /100 | #217 | Tragic 11.8% |
| Immigrants | Bahamas | 9.2 /100 | #218 | Tragic 11.8% |
| Czechoslovakians | 9.0 /100 | #219 | Tragic 11.8% |
| Immigrants | West Indies | 8.9 /100 | #220 | Tragic 11.8% |
| Alsatians | 8.5 /100 | #221 | Tragic 11.8% |
| Hondurans | 8.4 /100 | #222 | Tragic 11.8% |
| Immigrants | Honduras | 8.4 /100 | #223 | Tragic 11.8% |
| Immigrants | Ghana | 7.8 /100 | #224 | Tragic 11.8% |
| Immigrants | Belize | 6.6 /100 | #225 | Tragic 11.9% |
Demographics Similar to Immigrants from Spain by Disability Age 35 to 64
In terms of disability age 35 to 64, the demographic groups most similar to Immigrants from Spain are Eastern European (10.0%, a difference of 0.10%), Immigrants from South America (9.9%, a difference of 0.12%), Immigrants from Czechoslovakia (10.0%, a difference of 0.22%), Immigrants from Sweden (9.9%, a difference of 0.33%), and Immigrants from Romania (10.0%, a difference of 0.41%).
| Demographics | Rating | Rank | Disability Age 35 to 64 |
| Immigrants | Russia | 99.8 /100 | #54 | Exceptional 9.8% |
| Peruvians | 99.8 /100 | #55 | Exceptional 9.9% |
| South Americans | 99.8 /100 | #56 | Exceptional 9.9% |
| Colombians | 99.8 /100 | #57 | Exceptional 9.9% |
| Armenians | 99.8 /100 | #58 | Exceptional 9.9% |
| Immigrants | Sweden | 99.7 /100 | #59 | Exceptional 9.9% |
| Immigrants | South America | 99.7 /100 | #60 | Exceptional 9.9% |
| Immigrants | Spain | 99.7 /100 | #61 | Exceptional 10.0% |
| Eastern Europeans | 99.7 /100 | #62 | Exceptional 10.0% |
| Immigrants | Czechoslovakia | 99.7 /100 | #63 | Exceptional 10.0% |
| Immigrants | Romania | 99.7 /100 | #64 | Exceptional 10.0% |
| Immigrants | Poland | 99.6 /100 | #65 | Exceptional 10.0% |
| Cubans | 99.6 /100 | #66 | Exceptional 10.0% |
| Immigrants | Uzbekistan | 99.5 /100 | #67 | Exceptional 10.1% |
| Immigrants | Switzerland | 99.5 /100 | #68 | Exceptional 10.1% |