Thai vs Ecuadorian Disability Age 18 to 34
COMPARE
Thai
Ecuadorian
Disability Age 18 to 34
Disability Age 18 to 34 Comparison
Thais
Ecuadorians
5.6%
DISABILITY AGE 18 TO 34
100.0/ 100
METRIC RATING
19th/ 347
METRIC RANK
5.8%
DISABILITY AGE 18 TO 34
99.9/ 100
METRIC RATING
36th/ 347
METRIC RANK
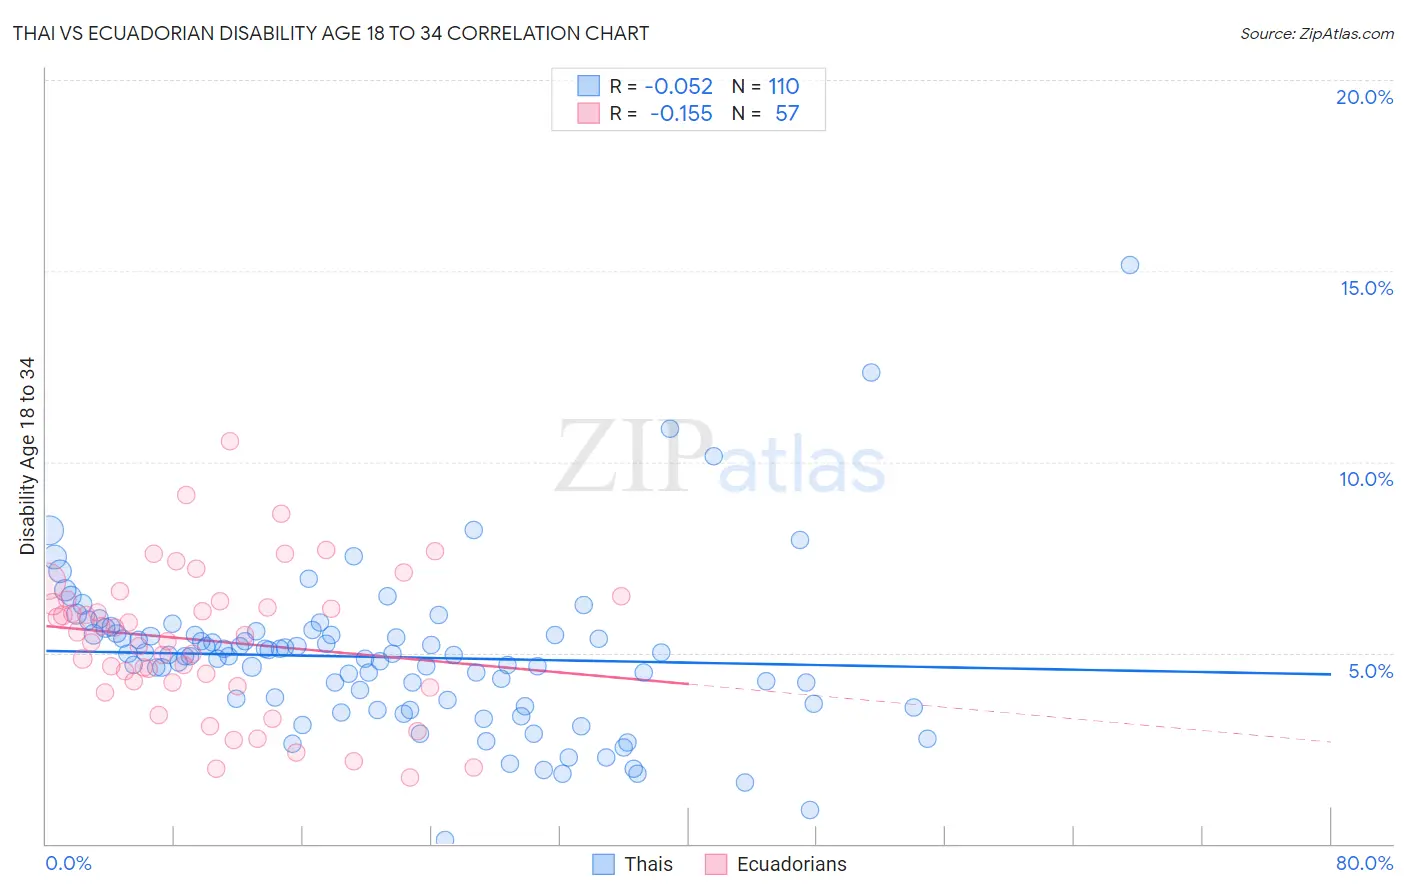
Thai vs Ecuadorian Disability Age 18 to 34 Correlation Chart
The statistical analysis conducted on geographies consisting of 474,471,926 people shows a slight negative correlation between the proportion of Thais and percentage of population with a disability between the ages 18 and 35 in the United States with a correlation coefficient (R) of -0.052 and weighted average of 5.6%. Similarly, the statistical analysis conducted on geographies consisting of 317,415,300 people shows a poor negative correlation between the proportion of Ecuadorians and percentage of population with a disability between the ages 18 and 35 in the United States with a correlation coefficient (R) of -0.155 and weighted average of 5.8%, a difference of 3.2%.
Disability Age 18 to 34 Correlation Summary
| Measurement | Thai | Ecuadorian |
| Minimum | 0.11% | 1.7% |
| Maximum | 15.2% | 10.5% |
| Range | 15.0% | 8.8% |
| Mean | 4.9% | 5.3% |
| Median | 4.9% | 5.5% |
| Interquartile 25% (IQ1) | 3.7% | 4.2% |
| Interquartile 75% (IQ3) | 5.5% | 6.4% |
| Interquartile Range (IQR) | 1.8% | 2.2% |
| Standard Deviation (Sample) | 2.1% | 1.9% |
| Standard Deviation (Population) | 2.1% | 1.9% |
Demographics Similar to Thais and Ecuadorians by Disability Age 18 to 34
In terms of disability age 18 to 34, the demographic groups most similar to Thais are Immigrants from Bolivia (5.6%, a difference of 0.070%), Immigrants from Bangladesh (5.6%, a difference of 0.17%), Immigrants from South Central Asia (5.7%, a difference of 0.74%), Immigrants from Nicaragua (5.7%, a difference of 0.81%), and Immigrants from Eastern Asia (5.6%, a difference of 0.83%). Similarly, the demographic groups most similar to Ecuadorians are Armenian (5.8%, a difference of 0.090%), Immigrants from Lithuania (5.8%, a difference of 0.15%), Venezuelan (5.8%, a difference of 0.38%), Argentinean (5.8%, a difference of 0.57%), and Iranian (5.8%, a difference of 0.59%).
| Demographics | Rating | Rank | Disability Age 18 to 34 |
| Immigrants | Eastern Asia | 100.0 /100 | #17 | Exceptional 5.6% |
| Immigrants | Bolivia | 100.0 /100 | #18 | Exceptional 5.6% |
| Thais | 100.0 /100 | #19 | Exceptional 5.6% |
| Immigrants | Bangladesh | 100.0 /100 | #20 | Exceptional 5.6% |
| Immigrants | South Central Asia | 100.0 /100 | #21 | Exceptional 5.7% |
| Immigrants | Nicaragua | 100.0 /100 | #22 | Exceptional 5.7% |
| Cubans | 100.0 /100 | #23 | Exceptional 5.7% |
| Immigrants | Argentina | 100.0 /100 | #24 | Exceptional 5.7% |
| Immigrants | Singapore | 100.0 /100 | #25 | Exceptional 5.7% |
| Immigrants | Colombia | 100.0 /100 | #26 | Exceptional 5.7% |
| Immigrants | Venezuela | 99.9 /100 | #27 | Exceptional 5.7% |
| Soviet Union | 99.9 /100 | #28 | Exceptional 5.7% |
| Immigrants | Ecuador | 99.9 /100 | #29 | Exceptional 5.7% |
| Immigrants | Pakistan | 99.9 /100 | #30 | Exceptional 5.8% |
| Iranians | 99.9 /100 | #31 | Exceptional 5.8% |
| Immigrants | Barbados | 99.9 /100 | #32 | Exceptional 5.8% |
| Argentineans | 99.9 /100 | #33 | Exceptional 5.8% |
| Venezuelans | 99.9 /100 | #34 | Exceptional 5.8% |
| Immigrants | Lithuania | 99.9 /100 | #35 | Exceptional 5.8% |
| Ecuadorians | 99.9 /100 | #36 | Exceptional 5.8% |
| Armenians | 99.9 /100 | #37 | Exceptional 5.8% |