Spaniard vs Carpatho Rusyn Female Disability
COMPARE
Spaniard
Carpatho Rusyn
Female Disability
Female Disability Comparison
Spaniards
Carpatho Rusyns
12.8%
FEMALE DISABILITY
0.7/ 100
METRIC RATING
263rd/ 347
METRIC RANK
12.6%
FEMALE DISABILITY
2.0/ 100
METRIC RATING
248th/ 347
METRIC RANK
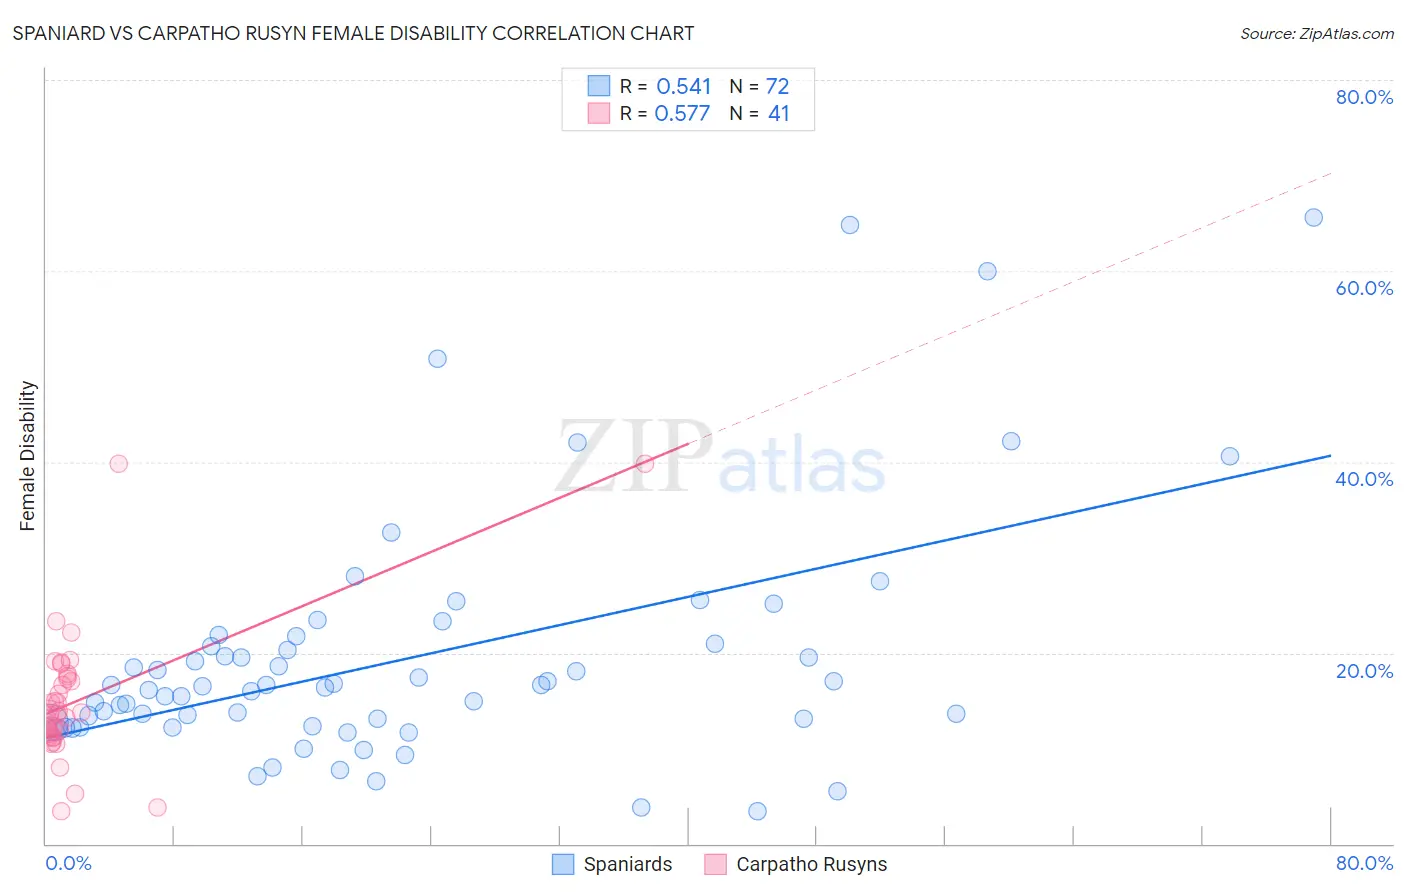
Spaniard vs Carpatho Rusyn Female Disability Correlation Chart
The statistical analysis conducted on geographies consisting of 443,418,073 people shows a substantial positive correlation between the proportion of Spaniards and percentage of females with a disability in the United States with a correlation coefficient (R) of 0.541 and weighted average of 12.8%. Similarly, the statistical analysis conducted on geographies consisting of 58,872,330 people shows a substantial positive correlation between the proportion of Carpatho Rusyns and percentage of females with a disability in the United States with a correlation coefficient (R) of 0.577 and weighted average of 12.6%, a difference of 0.97%.
Female Disability Correlation Summary
| Measurement | Spaniard | Carpatho Rusyn |
| Minimum | 3.4% | 3.5% |
| Maximum | 65.6% | 39.8% |
| Range | 62.2% | 36.3% |
| Mean | 19.4% | 14.9% |
| Median | 16.4% | 13.6% |
| Interquartile 25% (IQ1) | 12.5% | 11.3% |
| Interquartile 75% (IQ3) | 20.8% | 17.4% |
| Interquartile Range (IQR) | 8.3% | 6.1% |
| Standard Deviation (Sample) | 12.6% | 7.1% |
| Standard Deviation (Population) | 12.5% | 7.0% |
Demographics Similar to Spaniards and Carpatho Rusyns by Female Disability
In terms of female disability, the demographic groups most similar to Spaniards are Alaska Native (12.8%, a difference of 0.12%), Czechoslovakian (12.7%, a difference of 0.23%), Bermudan (12.7%, a difference of 0.30%), West Indian (12.8%, a difference of 0.31%), and Subsaharan African (12.7%, a difference of 0.34%). Similarly, the demographic groups most similar to Carpatho Rusyns are Menominee (12.6%, a difference of 0.040%), Spanish American Indian (12.6%, a difference of 0.050%), Immigrants from Jamaica (12.6%, a difference of 0.070%), Immigrants from Congo (12.7%, a difference of 0.13%), and Slovene (12.7%, a difference of 0.17%).
| Demographics | Rating | Rank | Female Disability |
| Immigrants | Jamaica | 2.2 /100 | #245 | Tragic 12.6% |
| Spanish American Indians | 2.1 /100 | #246 | Tragic 12.6% |
| Menominee | 2.1 /100 | #247 | Tragic 12.6% |
| Carpatho Rusyns | 2.0 /100 | #248 | Tragic 12.6% |
| Immigrants | Congo | 1.8 /100 | #249 | Tragic 12.7% |
| Slovenes | 1.7 /100 | #250 | Tragic 12.7% |
| Crow | 1.6 /100 | #251 | Tragic 12.7% |
| Immigrants | Caribbean | 1.4 /100 | #252 | Tragic 12.7% |
| Jamaicans | 1.4 /100 | #253 | Tragic 12.7% |
| Hawaiians | 1.4 /100 | #254 | Tragic 12.7% |
| Immigrants | Germany | 1.3 /100 | #255 | Tragic 12.7% |
| British West Indians | 1.2 /100 | #256 | Tragic 12.7% |
| Liberians | 1.1 /100 | #257 | Tragic 12.7% |
| Aleuts | 1.1 /100 | #258 | Tragic 12.7% |
| Immigrants | Armenia | 1.0 /100 | #259 | Tragic 12.7% |
| Sub-Saharan Africans | 1.0 /100 | #260 | Tragic 12.7% |
| Bermudans | 1.0 /100 | #261 | Tragic 12.7% |
| Czechoslovakians | 0.9 /100 | #262 | Tragic 12.7% |
| Spaniards | 0.7 /100 | #263 | Tragic 12.8% |
| Alaska Natives | 0.6 /100 | #264 | Tragic 12.8% |
| West Indians | 0.5 /100 | #265 | Tragic 12.8% |