Sioux vs Costa Rican Disability Age 35 to 64
COMPARE
Sioux
Costa Rican
Disability Age 35 to 64
Disability Age 35 to 64 Comparison
Sioux
Costa Ricans
13.9%
DISABILITY AGE 35 TO 64
0.0/ 100
METRIC RATING
303rd/ 347
METRIC RANK
10.7%
DISABILITY AGE 35 TO 64
91.4/ 100
METRIC RATING
139th/ 347
METRIC RANK
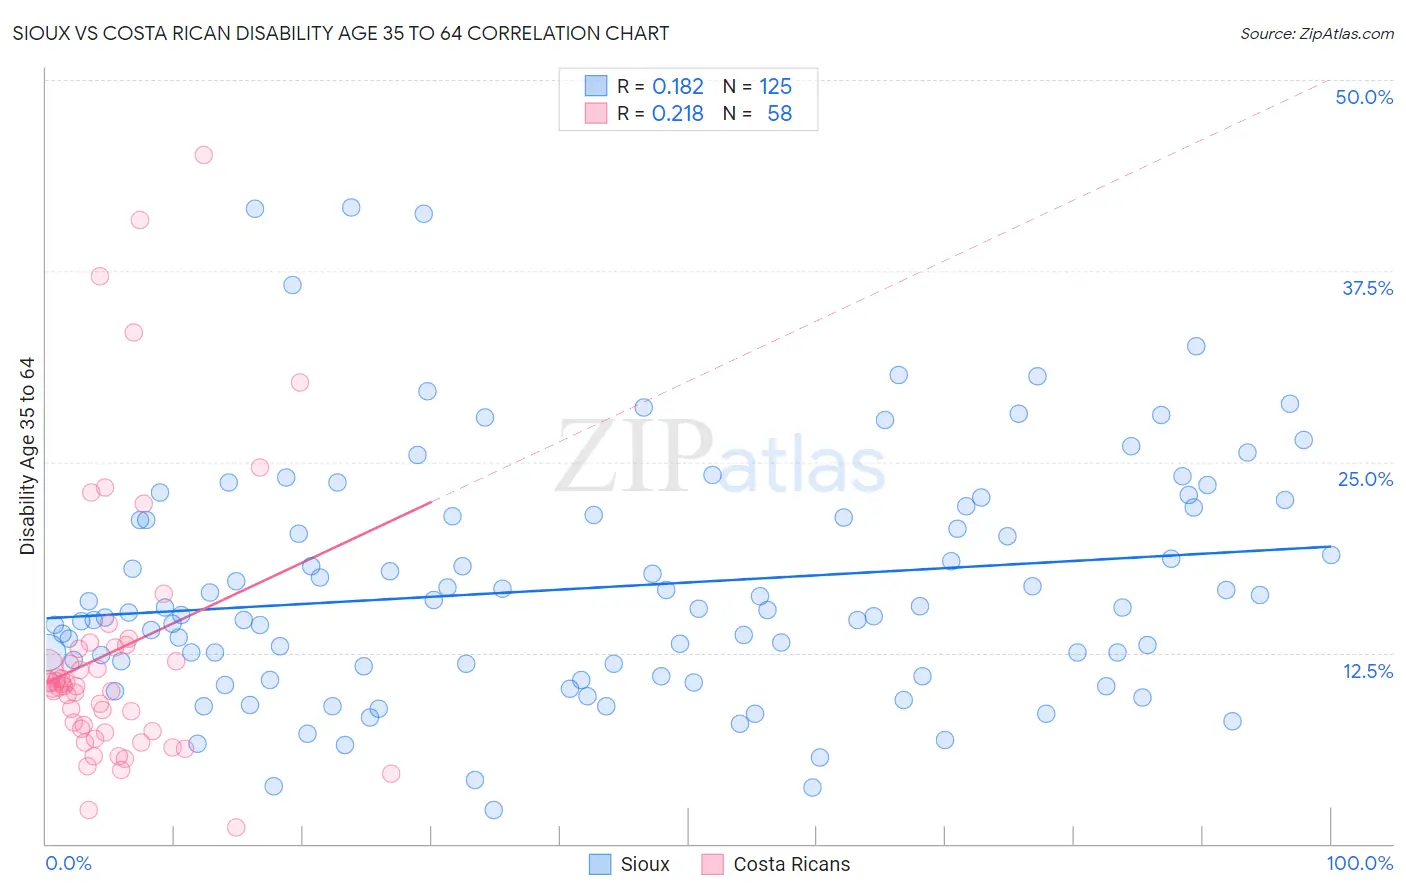
Sioux vs Costa Rican Disability Age 35 to 64 Correlation Chart
The statistical analysis conducted on geographies consisting of 234,072,168 people shows a poor positive correlation between the proportion of Sioux and percentage of population with a disability between the ages 34 and 64 in the United States with a correlation coefficient (R) of 0.182 and weighted average of 13.9%. Similarly, the statistical analysis conducted on geographies consisting of 253,472,399 people shows a weak positive correlation between the proportion of Costa Ricans and percentage of population with a disability between the ages 34 and 64 in the United States with a correlation coefficient (R) of 0.218 and weighted average of 10.7%, a difference of 29.1%.
Disability Age 35 to 64 Correlation Summary
| Measurement | Sioux | Costa Rican |
| Minimum | 2.2% | 1.1% |
| Maximum | 41.7% | 45.1% |
| Range | 39.5% | 44.0% |
| Mean | 16.8% | 12.6% |
| Median | 15.3% | 10.3% |
| Interquartile 25% (IQ1) | 11.3% | 7.4% |
| Interquartile 75% (IQ3) | 21.5% | 12.9% |
| Interquartile Range (IQR) | 10.2% | 5.5% |
| Standard Deviation (Sample) | 7.8% | 9.1% |
| Standard Deviation (Population) | 7.8% | 9.0% |
Similar Demographics by Disability Age 35 to 64
Demographics Similar to Sioux by Disability Age 35 to 64
In terms of disability age 35 to 64, the demographic groups most similar to Sioux are Hopi (13.9%, a difference of 0.030%), Aleut (13.8%, a difference of 0.18%), American (13.9%, a difference of 0.41%), French American Indian (13.7%, a difference of 1.1%), and Immigrants from Yemen (14.0%, a difference of 1.3%).
| Demographics | Rating | Rank | Disability Age 35 to 64 |
| Africans | 0.0 /100 | #296 | Tragic 13.6% |
| Bangladeshis | 0.0 /100 | #297 | Tragic 13.6% |
| Cheyenne | 0.0 /100 | #298 | Tragic 13.6% |
| Spanish Americans | 0.0 /100 | #299 | Tragic 13.7% |
| Delaware | 0.0 /100 | #300 | Tragic 13.7% |
| French American Indians | 0.0 /100 | #301 | Tragic 13.7% |
| Aleuts | 0.0 /100 | #302 | Tragic 13.8% |
| Sioux | 0.0 /100 | #303 | Tragic 13.9% |
| Hopi | 0.0 /100 | #304 | Tragic 13.9% |
| Americans | 0.0 /100 | #305 | Tragic 13.9% |
| Immigrants | Yemen | 0.0 /100 | #306 | Tragic 14.0% |
| Blackfeet | 0.0 /100 | #307 | Tragic 14.1% |
| Inupiat | 0.0 /100 | #308 | Tragic 14.1% |
| Cree | 0.0 /100 | #309 | Tragic 14.1% |
| Cape Verdeans | 0.0 /100 | #310 | Tragic 14.1% |
Demographics Similar to Costa Ricans by Disability Age 35 to 64
In terms of disability age 35 to 64, the demographic groups most similar to Costa Ricans are Immigrants from Southern Europe (10.7%, a difference of 0.010%), Immigrants from Scotland (10.7%, a difference of 0.050%), Immigrants from Costa Rica (10.7%, a difference of 0.060%), Salvadoran (10.7%, a difference of 0.13%), and Australian (10.8%, a difference of 0.18%).
| Demographics | Rating | Rank | Disability Age 35 to 64 |
| Immigrants | Albania | 92.5 /100 | #132 | Exceptional 10.7% |
| Immigrants | Immigrants | 92.5 /100 | #133 | Exceptional 10.7% |
| Immigrants | Ecuador | 92.5 /100 | #134 | Exceptional 10.7% |
| Greeks | 92.3 /100 | #135 | Exceptional 10.7% |
| Salvadorans | 91.9 /100 | #136 | Exceptional 10.7% |
| Immigrants | Costa Rica | 91.7 /100 | #137 | Exceptional 10.7% |
| Immigrants | Southern Europe | 91.5 /100 | #138 | Exceptional 10.7% |
| Costa Ricans | 91.4 /100 | #139 | Exceptional 10.7% |
| Immigrants | Scotland | 91.3 /100 | #140 | Exceptional 10.7% |
| Australians | 90.7 /100 | #141 | Exceptional 10.8% |
| Immigrants | Saudi Arabia | 90.6 /100 | #142 | Exceptional 10.8% |
| Sierra Leoneans | 89.7 /100 | #143 | Excellent 10.8% |
| Lithuanians | 88.7 /100 | #144 | Excellent 10.8% |
| Immigrants | Bangladesh | 85.6 /100 | #145 | Excellent 10.9% |
| South American Indians | 83.5 /100 | #146 | Excellent 10.9% |