Pueblo vs German Disability Age 18 to 34
COMPARE
Pueblo
German
Disability Age 18 to 34
Disability Age 18 to 34 Comparison
Pueblo
Germans
7.7%
DISABILITY AGE 18 TO 34
0.0/ 100
METRIC RATING
297th/ 347
METRIC RANK
7.7%
DISABILITY AGE 18 TO 34
0.0/ 100
METRIC RATING
299th/ 347
METRIC RANK
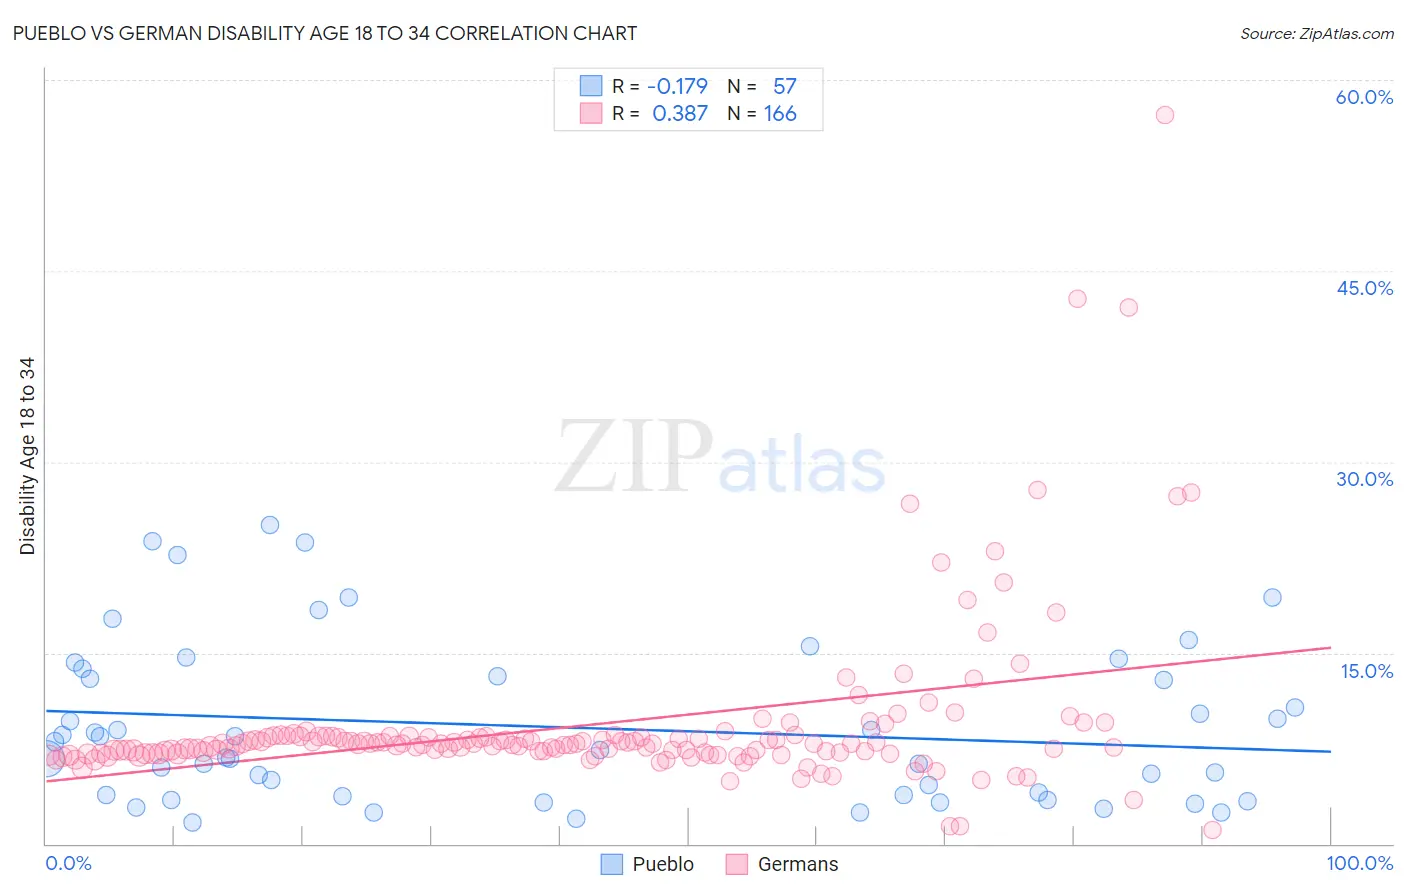
Pueblo vs German Disability Age 18 to 34 Correlation Chart
The statistical analysis conducted on geographies consisting of 119,981,806 people shows a poor negative correlation between the proportion of Pueblo and percentage of population with a disability between the ages 18 and 35 in the United States with a correlation coefficient (R) of -0.179 and weighted average of 7.7%. Similarly, the statistical analysis conducted on geographies consisting of 573,263,682 people shows a mild positive correlation between the proportion of Germans and percentage of population with a disability between the ages 18 and 35 in the United States with a correlation coefficient (R) of 0.387 and weighted average of 7.7%, a difference of 0.31%.
Disability Age 18 to 34 Correlation Summary
| Measurement | Pueblo | German |
| Minimum | 1.7% | 1.1% |
| Maximum | 25.0% | 57.2% |
| Range | 23.3% | 56.1% |
| Mean | 9.2% | 9.3% |
| Median | 7.4% | 7.8% |
| Interquartile 25% (IQ1) | 3.8% | 7.1% |
| Interquartile 75% (IQ3) | 13.4% | 8.4% |
| Interquartile Range (IQR) | 9.7% | 1.3% |
| Standard Deviation (Sample) | 6.3% | 6.7% |
| Standard Deviation (Population) | 6.3% | 6.7% |
Demographics Similar to Pueblo and Germans by Disability Age 18 to 34
In terms of disability age 18 to 34, the demographic groups most similar to Pueblo are Cape Verdean (7.7%, a difference of 0.020%), Dutch (7.7%, a difference of 0.080%), Tlingit-Haida (7.7%, a difference of 0.19%), Immigrants from Cabo Verde (7.7%, a difference of 0.20%), and Scottish (7.7%, a difference of 0.33%). Similarly, the demographic groups most similar to Germans are Scottish (7.7%, a difference of 0.010%), Pima (7.7%, a difference of 0.080%), Welsh (7.7%, a difference of 0.15%), Cheyenne (7.7%, a difference of 0.21%), and Dutch (7.7%, a difference of 0.24%).
| Demographics | Rating | Rank | Disability Age 18 to 34 |
| Whites/Caucasians | 0.0 /100 | #288 | Tragic 7.6% |
| Immigrants | Nonimmigrants | 0.0 /100 | #289 | Tragic 7.6% |
| Slovaks | 0.0 /100 | #290 | Tragic 7.7% |
| Irish | 0.0 /100 | #291 | Tragic 7.7% |
| Blacks/African Americans | 0.0 /100 | #292 | Tragic 7.7% |
| Scandinavians | 0.0 /100 | #293 | Tragic 7.7% |
| Immigrants | Cabo Verde | 0.0 /100 | #294 | Tragic 7.7% |
| Tlingit-Haida | 0.0 /100 | #295 | Tragic 7.7% |
| Cape Verdeans | 0.0 /100 | #296 | Tragic 7.7% |
| Pueblo | 0.0 /100 | #297 | Tragic 7.7% |
| Dutch | 0.0 /100 | #298 | Tragic 7.7% |
| Germans | 0.0 /100 | #299 | Tragic 7.7% |
| Scottish | 0.0 /100 | #300 | Tragic 7.7% |
| Pima | 0.0 /100 | #301 | Tragic 7.7% |
| Welsh | 0.0 /100 | #302 | Tragic 7.7% |
| Cheyenne | 0.0 /100 | #303 | Tragic 7.7% |
| Shoshone | 0.0 /100 | #304 | Tragic 7.8% |
| Menominee | 0.0 /100 | #305 | Tragic 7.8% |
| English | 0.0 /100 | #306 | Tragic 7.8% |
| Scotch-Irish | 0.0 /100 | #307 | Tragic 7.8% |
| Pennsylvania Germans | 0.0 /100 | #308 | Tragic 7.8% |