Jamaican vs Immigrants from Senegal Disability Age 65 to 74
COMPARE
Jamaican
Immigrants from Senegal
Disability Age 65 to 74
Disability Age 65 to 74 Comparison
Jamaicans
Immigrants from Senegal
24.0%
DISABILITY AGE 65 TO 74
12.2/ 100
METRIC RATING
216th/ 347
METRIC RANK
24.6%
DISABILITY AGE 65 TO 74
2.2/ 100
METRIC RATING
242nd/ 347
METRIC RANK
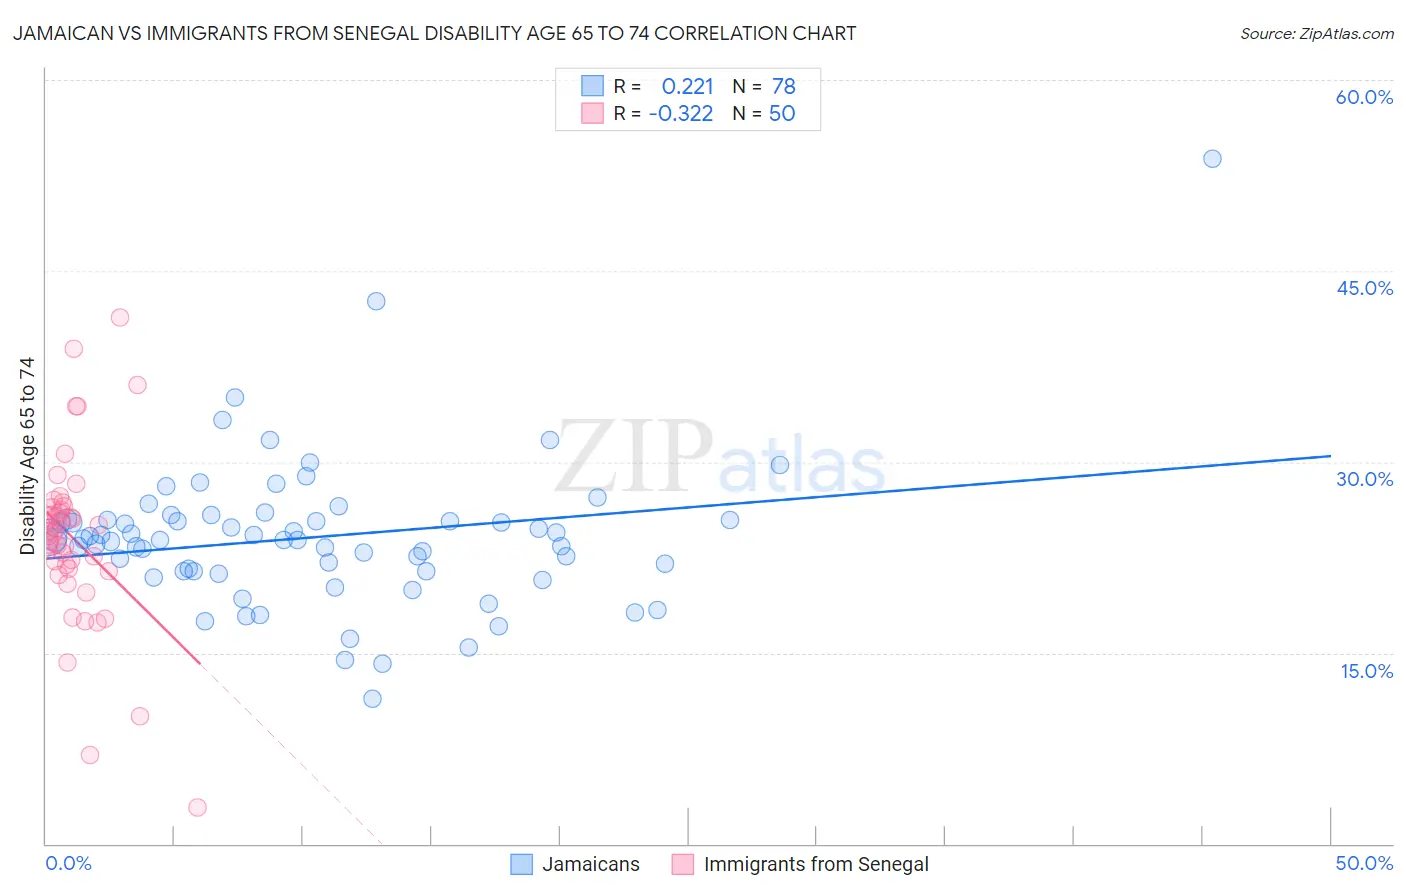
Jamaican vs Immigrants from Senegal Disability Age 65 to 74 Correlation Chart
The statistical analysis conducted on geographies consisting of 366,923,760 people shows a weak positive correlation between the proportion of Jamaicans and percentage of population with a disability between the ages 65 and 75 in the United States with a correlation coefficient (R) of 0.221 and weighted average of 24.0%. Similarly, the statistical analysis conducted on geographies consisting of 90,101,163 people shows a mild negative correlation between the proportion of Immigrants from Senegal and percentage of population with a disability between the ages 65 and 75 in the United States with a correlation coefficient (R) of -0.322 and weighted average of 24.6%, a difference of 2.6%.
Disability Age 65 to 74 Correlation Summary
| Measurement | Jamaican | Immigrants from Senegal |
| Minimum | 11.4% | 2.9% |
| Maximum | 53.8% | 41.4% |
| Range | 42.5% | 38.5% |
| Mean | 24.1% | 24.0% |
| Median | 23.9% | 24.5% |
| Interquartile 25% (IQ1) | 21.4% | 21.6% |
| Interquartile 75% (IQ3) | 25.4% | 26.4% |
| Interquartile Range (IQR) | 4.1% | 4.8% |
| Standard Deviation (Sample) | 5.8% | 6.8% |
| Standard Deviation (Population) | 5.8% | 6.8% |
Similar Demographics by Disability Age 65 to 74
Demographics Similar to Jamaicans by Disability Age 65 to 74
In terms of disability age 65 to 74, the demographic groups most similar to Jamaicans are Immigrants from Portugal (24.0%, a difference of 0.070%), Immigrants from Nigeria (24.0%, a difference of 0.070%), Immigrants from Burma/Myanmar (24.0%, a difference of 0.090%), Pennsylvania German (24.0%, a difference of 0.13%), and Immigrants from Oceania (24.0%, a difference of 0.18%).
| Demographics | Rating | Rank | Disability Age 65 to 74 |
| Immigrants | Kenya | 19.6 /100 | #209 | Poor 23.8% |
| Trinidadians and Tobagonians | 16.4 /100 | #210 | Poor 23.9% |
| Immigrants | West Indies | 15.9 /100 | #211 | Poor 23.9% |
| French | 15.7 /100 | #212 | Poor 23.9% |
| Nicaraguans | 14.3 /100 | #213 | Poor 23.9% |
| Immigrants | Oceania | 13.6 /100 | #214 | Poor 24.0% |
| Pennsylvania Germans | 13.3 /100 | #215 | Poor 24.0% |
| Jamaicans | 12.2 /100 | #216 | Poor 24.0% |
| Immigrants | Portugal | 11.7 /100 | #217 | Poor 24.0% |
| Immigrants | Nigeria | 11.7 /100 | #218 | Poor 24.0% |
| Immigrants | Burma/Myanmar | 11.6 /100 | #219 | Poor 24.0% |
| Ghanaians | 10.4 /100 | #220 | Poor 24.1% |
| Immigrants | Nicaragua | 9.8 /100 | #221 | Tragic 24.1% |
| Native Hawaiians | 9.3 /100 | #222 | Tragic 24.1% |
| Immigrants | Middle Africa | 8.9 /100 | #223 | Tragic 24.1% |
Demographics Similar to Immigrants from Senegal by Disability Age 65 to 74
In terms of disability age 65 to 74, the demographic groups most similar to Immigrants from Senegal are Spanish (24.6%, a difference of 0.010%), Immigrants from Western Africa (24.6%, a difference of 0.080%), Armenian (24.7%, a difference of 0.14%), British West Indian (24.7%, a difference of 0.14%), and Spaniard (24.6%, a difference of 0.16%).
| Demographics | Rating | Rank | Disability Age 65 to 74 |
| Scotch-Irish | 3.8 /100 | #235 | Tragic 24.4% |
| German Russians | 3.7 /100 | #236 | Tragic 24.4% |
| West Indians | 3.4 /100 | #237 | Tragic 24.5% |
| Immigrants | Ghana | 3.0 /100 | #238 | Tragic 24.5% |
| Immigrants | Caribbean | 2.6 /100 | #239 | Tragic 24.6% |
| Spaniards | 2.4 /100 | #240 | Tragic 24.6% |
| Immigrants | Western Africa | 2.3 /100 | #241 | Tragic 24.6% |
| Immigrants | Senegal | 2.2 /100 | #242 | Tragic 24.6% |
| Spanish | 2.2 /100 | #243 | Tragic 24.6% |
| Armenians | 2.0 /100 | #244 | Tragic 24.7% |
| British West Indians | 2.0 /100 | #245 | Tragic 24.7% |
| Immigrants | Iraq | 1.9 /100 | #246 | Tragic 24.7% |
| Indonesians | 1.1 /100 | #247 | Tragic 24.9% |
| Senegalese | 0.9 /100 | #248 | Tragic 24.9% |
| Immigrants | Fiji | 0.8 /100 | #249 | Tragic 25.0% |