Immigrants from Yemen vs Immigrants from South Eastern Asia Male Disability
COMPARE
Immigrants from Yemen
Immigrants from South Eastern Asia
Male Disability
Male Disability Comparison
Immigrants from Yemen
Immigrants from South Eastern Asia
12.0%
MALE DISABILITY
0.5/ 100
METRIC RATING
249th/ 347
METRIC RANK
10.9%
MALE DISABILITY
89.2/ 100
METRIC RATING
121st/ 347
METRIC RANK
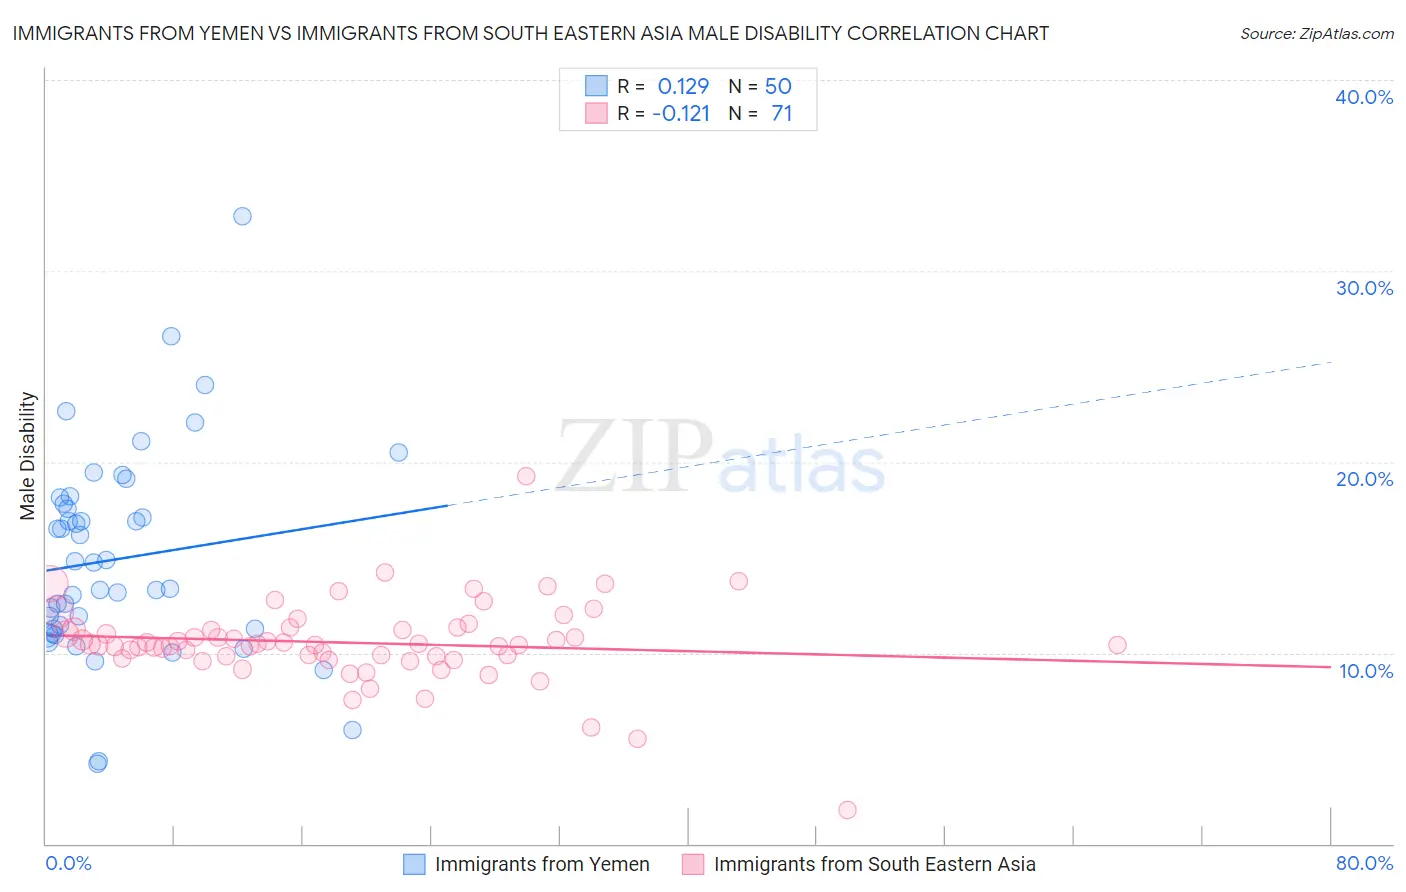
Immigrants from Yemen vs Immigrants from South Eastern Asia Male Disability Correlation Chart
The statistical analysis conducted on geographies consisting of 82,432,015 people shows a poor positive correlation between the proportion of Immigrants from Yemen and percentage of males with a disability in the United States with a correlation coefficient (R) of 0.129 and weighted average of 12.0%. Similarly, the statistical analysis conducted on geographies consisting of 512,522,029 people shows a poor negative correlation between the proportion of Immigrants from South Eastern Asia and percentage of males with a disability in the United States with a correlation coefficient (R) of -0.121 and weighted average of 10.9%, a difference of 10.4%.
Male Disability Correlation Summary
| Measurement | Immigrants from Yemen | Immigrants from South Eastern Asia |
| Minimum | 4.2% | 1.8% |
| Maximum | 32.8% | 19.3% |
| Range | 28.6% | 17.5% |
| Mean | 14.9% | 10.5% |
| Median | 14.0% | 10.4% |
| Interquartile 25% (IQ1) | 11.3% | 9.8% |
| Interquartile 75% (IQ3) | 17.8% | 11.2% |
| Interquartile Range (IQR) | 6.6% | 1.4% |
| Standard Deviation (Sample) | 5.4% | 2.2% |
| Standard Deviation (Population) | 5.4% | 2.2% |
Similar Demographics by Male Disability
Demographics Similar to Immigrants from Yemen by Male Disability
In terms of male disability, the demographic groups most similar to Immigrants from Yemen are Bangladeshi (12.0%, a difference of 0.050%), German Russian (12.0%, a difference of 0.060%), Slovene (12.0%, a difference of 0.13%), Guamanian/Chamorro (12.0%, a difference of 0.13%), and British (12.1%, a difference of 0.32%).
| Demographics | Rating | Rank | Male Disability |
| Northern Europeans | 1.1 /100 | #242 | Tragic 11.9% |
| Samoans | 1.1 /100 | #243 | Tragic 11.9% |
| Immigrants | Laos | 1.0 /100 | #244 | Tragic 11.9% |
| Immigrants | Liberia | 1.0 /100 | #245 | Tragic 11.9% |
| Danes | 0.9 /100 | #246 | Tragic 11.9% |
| Hungarians | 0.8 /100 | #247 | Tragic 12.0% |
| Poles | 0.7 /100 | #248 | Tragic 12.0% |
| Immigrants | Yemen | 0.5 /100 | #249 | Tragic 12.0% |
| Bangladeshis | 0.5 /100 | #250 | Tragic 12.0% |
| German Russians | 0.5 /100 | #251 | Tragic 12.0% |
| Slovenes | 0.5 /100 | #252 | Tragic 12.0% |
| Guamanians/Chamorros | 0.5 /100 | #253 | Tragic 12.0% |
| British | 0.4 /100 | #254 | Tragic 12.1% |
| Chinese | 0.4 /100 | #255 | Tragic 12.1% |
| Swiss | 0.3 /100 | #256 | Tragic 12.1% |
Demographics Similar to Immigrants from South Eastern Asia by Male Disability
In terms of male disability, the demographic groups most similar to Immigrants from South Eastern Asia are Immigrants from Ghana (10.9%, a difference of 0.010%), Immigrants from Africa (10.9%, a difference of 0.040%), Immigrants from Czechoslovakia (10.9%, a difference of 0.11%), Immigrants from Cuba (10.9%, a difference of 0.15%), and Armenian (10.9%, a difference of 0.15%).
| Demographics | Rating | Rank | Male Disability |
| Central Americans | 92.7 /100 | #114 | Exceptional 10.8% |
| Immigrants | Barbados | 92.2 /100 | #115 | Exceptional 10.8% |
| Immigrants | South Africa | 91.8 /100 | #116 | Exceptional 10.8% |
| Eastern Europeans | 90.6 /100 | #117 | Exceptional 10.9% |
| Immigrants | Cuba | 90.2 /100 | #118 | Exceptional 10.9% |
| Armenians | 90.1 /100 | #119 | Exceptional 10.9% |
| Immigrants | Africa | 89.4 /100 | #120 | Excellent 10.9% |
| Immigrants | South Eastern Asia | 89.2 /100 | #121 | Excellent 10.9% |
| Immigrants | Ghana | 89.0 /100 | #122 | Excellent 10.9% |
| Immigrants | Czechoslovakia | 88.4 /100 | #123 | Excellent 10.9% |
| South American Indians | 88.1 /100 | #124 | Excellent 10.9% |
| Immigrants | North Macedonia | 88.1 /100 | #125 | Excellent 10.9% |
| Immigrants | Trinidad and Tobago | 86.9 /100 | #126 | Excellent 10.9% |
| Immigrants | Ukraine | 86.8 /100 | #127 | Excellent 10.9% |
| Immigrants | Latvia | 85.5 /100 | #128 | Excellent 10.9% |