Immigrants from South Eastern Asia vs Scandinavian Cognitive Disability
COMPARE
Immigrants from South Eastern Asia
Scandinavian
Cognitive Disability
Cognitive Disability Comparison
Immigrants from South Eastern Asia
Scandinavians
17.0%
COGNITIVE DISABILITY
88.7/ 100
METRIC RATING
145th/ 347
METRIC RANK
16.9%
COGNITIVE DISABILITY
94.1/ 100
METRIC RATING
125th/ 347
METRIC RANK
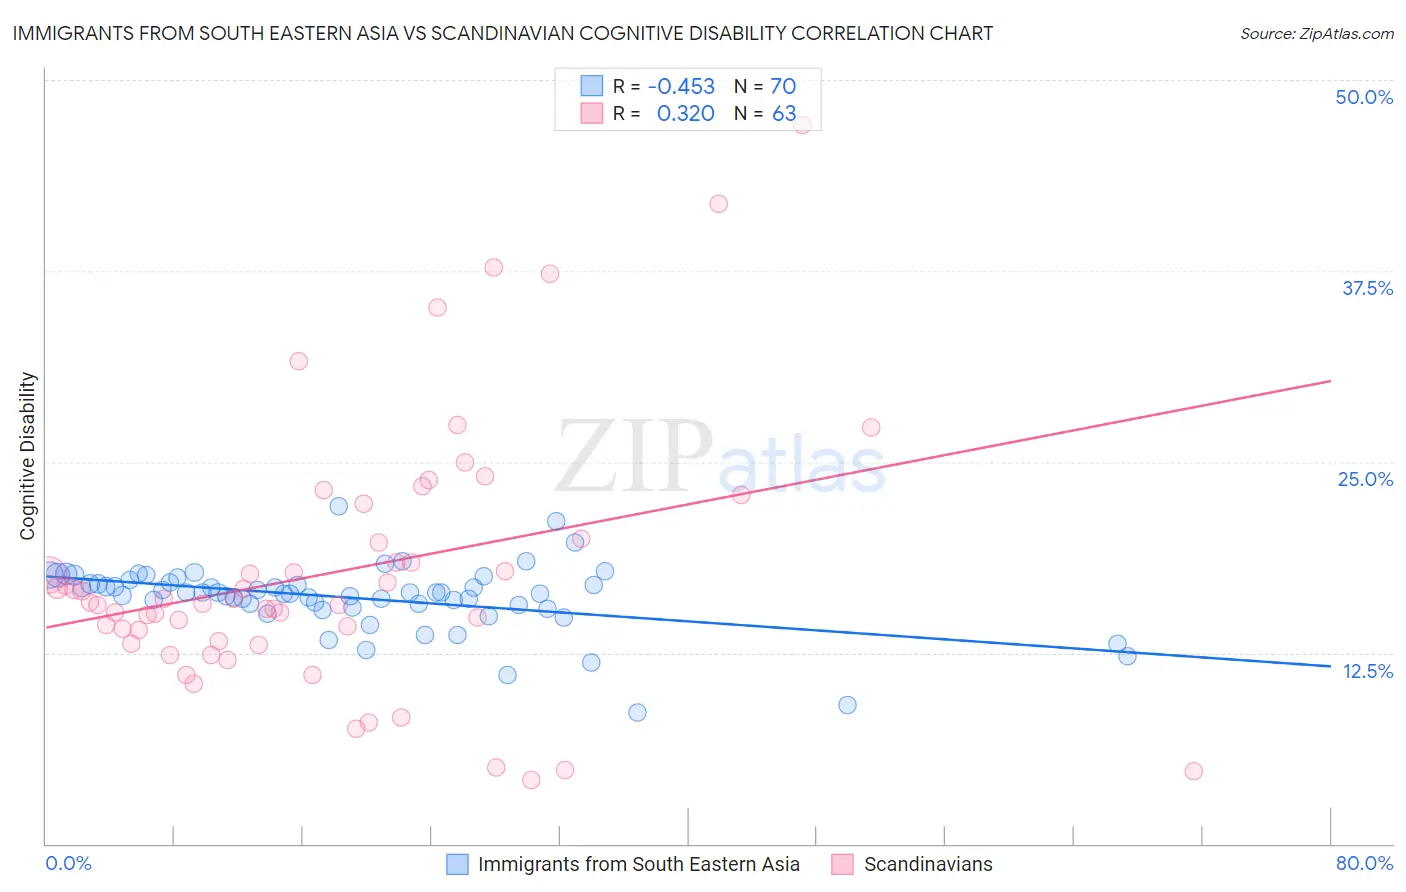
Immigrants from South Eastern Asia vs Scandinavian Cognitive Disability Correlation Chart
The statistical analysis conducted on geographies consisting of 512,576,863 people shows a moderate negative correlation between the proportion of Immigrants from South Eastern Asia and percentage of population with cognitive disability in the United States with a correlation coefficient (R) of -0.453 and weighted average of 17.0%. Similarly, the statistical analysis conducted on geographies consisting of 472,549,780 people shows a mild positive correlation between the proportion of Scandinavians and percentage of population with cognitive disability in the United States with a correlation coefficient (R) of 0.320 and weighted average of 16.9%, a difference of 0.52%.
Cognitive Disability Correlation Summary
| Measurement | Immigrants from South Eastern Asia | Scandinavian |
| Minimum | 8.6% | 4.2% |
| Maximum | 22.1% | 47.1% |
| Range | 13.5% | 42.9% |
| Mean | 16.1% | 17.8% |
| Median | 16.4% | 15.8% |
| Interquartile 25% (IQ1) | 15.6% | 13.3% |
| Interquartile 75% (IQ3) | 17.1% | 20.0% |
| Interquartile Range (IQR) | 1.5% | 6.7% |
| Standard Deviation (Sample) | 2.2% | 8.6% |
| Standard Deviation (Population) | 2.2% | 8.5% |
Demographics Similar to Immigrants from South Eastern Asia and Scandinavians by Cognitive Disability
In terms of cognitive disability, the demographic groups most similar to Immigrants from South Eastern Asia are British (17.0%, a difference of 0.050%), Immigrants from Brazil (17.0%, a difference of 0.050%), Carpatho Rusyn (17.0%, a difference of 0.070%), Aleut (17.0%, a difference of 0.090%), and French (17.0%, a difference of 0.10%). Similarly, the demographic groups most similar to Scandinavians are European (17.0%, a difference of 0.090%), Immigrants from Costa Rica (17.0%, a difference of 0.12%), Nicaraguan (17.0%, a difference of 0.14%), Immigrants from Uruguay (17.0%, a difference of 0.15%), and Immigrants from Vietnam (17.0%, a difference of 0.21%).
| Demographics | Rating | Rank | Cognitive Disability |
| Scandinavians | 94.1 /100 | #125 | Exceptional 16.9% |
| Europeans | 93.4 /100 | #126 | Exceptional 17.0% |
| Immigrants | Costa Rica | 93.1 /100 | #127 | Exceptional 17.0% |
| Nicaraguans | 93.0 /100 | #128 | Exceptional 17.0% |
| Immigrants | Uruguay | 92.9 /100 | #129 | Exceptional 17.0% |
| Immigrants | Vietnam | 92.4 /100 | #130 | Exceptional 17.0% |
| Immigrants | Germany | 92.1 /100 | #131 | Exceptional 17.0% |
| Whites/Caucasians | 92.1 /100 | #132 | Exceptional 17.0% |
| Immigrants | Jordan | 91.9 /100 | #133 | Exceptional 17.0% |
| Immigrants | Chile | 91.7 /100 | #134 | Exceptional 17.0% |
| Lebanese | 91.3 /100 | #135 | Exceptional 17.0% |
| Israelis | 91.0 /100 | #136 | Exceptional 17.0% |
| Immigrants | Norway | 90.9 /100 | #137 | Exceptional 17.0% |
| Welsh | 90.8 /100 | #138 | Exceptional 17.0% |
| French | 90.0 /100 | #139 | Excellent 17.0% |
| Chileans | 89.9 /100 | #140 | Excellent 17.0% |
| Aleuts | 89.9 /100 | #141 | Excellent 17.0% |
| Carpatho Rusyns | 89.6 /100 | #142 | Excellent 17.0% |
| British | 89.3 /100 | #143 | Excellent 17.0% |
| Immigrants | Brazil | 89.3 /100 | #144 | Excellent 17.0% |
| Immigrants | South Eastern Asia | 88.7 /100 | #145 | Excellent 17.0% |