Immigrants from South Eastern Asia vs Malaysian Cognitive Disability
COMPARE
Immigrants from South Eastern Asia
Malaysian
Cognitive Disability
Cognitive Disability Comparison
Immigrants from South Eastern Asia
Malaysians
17.0%
COGNITIVE DISABILITY
88.7/ 100
METRIC RATING
145th/ 347
METRIC RANK
17.9%
COGNITIVE DISABILITY
0.6/ 100
METRIC RATING
251st/ 347
METRIC RANK
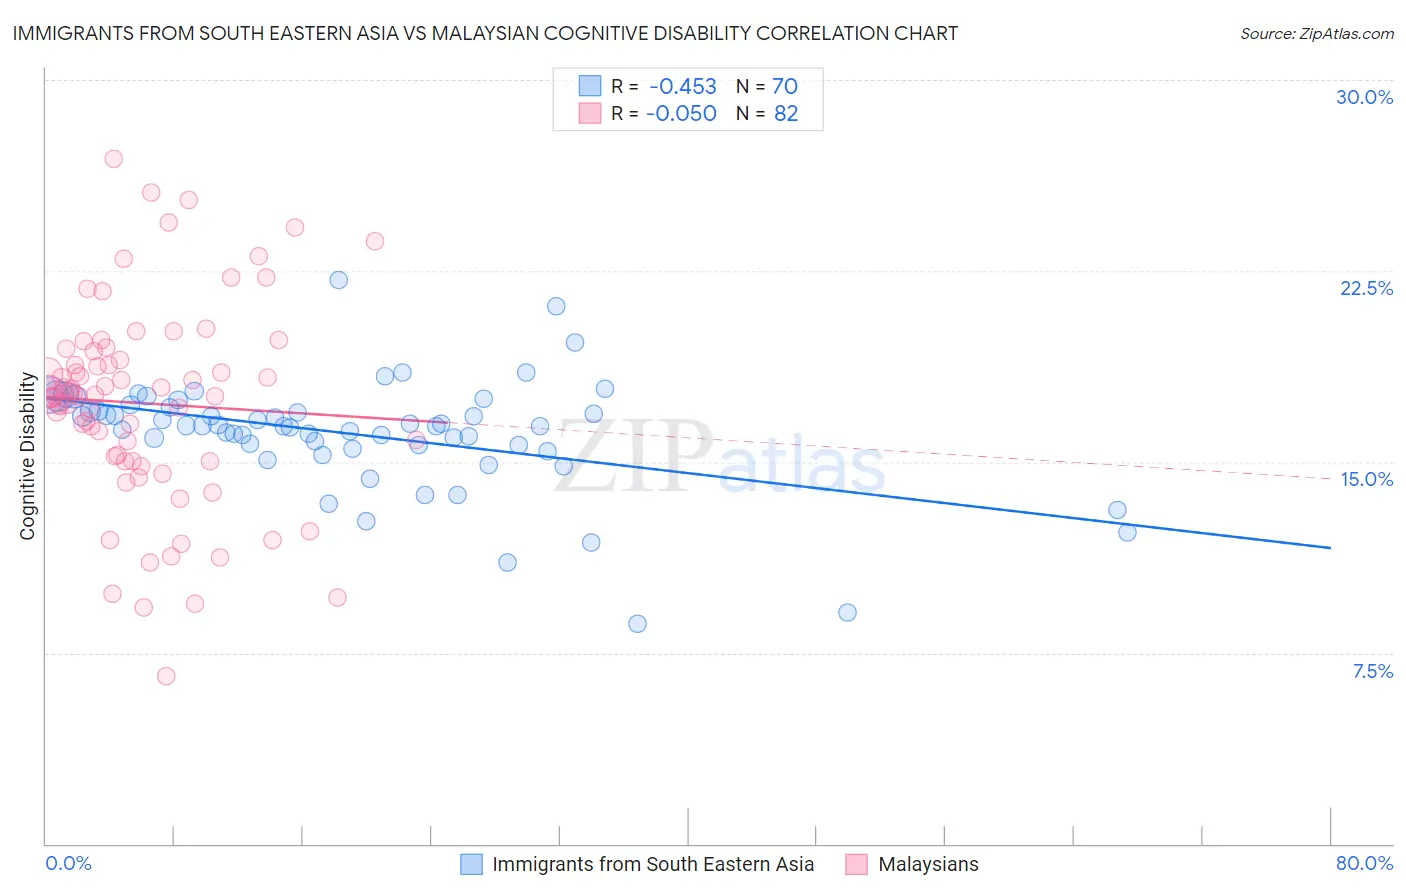
Immigrants from South Eastern Asia vs Malaysian Cognitive Disability Correlation Chart
The statistical analysis conducted on geographies consisting of 512,576,863 people shows a moderate negative correlation between the proportion of Immigrants from South Eastern Asia and percentage of population with cognitive disability in the United States with a correlation coefficient (R) of -0.453 and weighted average of 17.0%. Similarly, the statistical analysis conducted on geographies consisting of 226,070,316 people shows a slight negative correlation between the proportion of Malaysians and percentage of population with cognitive disability in the United States with a correlation coefficient (R) of -0.050 and weighted average of 17.9%, a difference of 5.1%.
Cognitive Disability Correlation Summary
| Measurement | Immigrants from South Eastern Asia | Malaysian |
| Minimum | 8.6% | 6.6% |
| Maximum | 22.1% | 26.9% |
| Range | 13.5% | 20.3% |
| Mean | 16.1% | 17.3% |
| Median | 16.4% | 17.6% |
| Interquartile 25% (IQ1) | 15.6% | 15.0% |
| Interquartile 75% (IQ3) | 17.1% | 19.3% |
| Interquartile Range (IQR) | 1.5% | 4.3% |
| Standard Deviation (Sample) | 2.2% | 4.0% |
| Standard Deviation (Population) | 2.2% | 3.9% |
Similar Demographics by Cognitive Disability
Demographics Similar to Immigrants from South Eastern Asia by Cognitive Disability
In terms of cognitive disability, the demographic groups most similar to Immigrants from South Eastern Asia are British (17.0%, a difference of 0.050%), Immigrants from Brazil (17.0%, a difference of 0.050%), Costa Rican (17.0%, a difference of 0.050%), Carpatho Rusyn (17.0%, a difference of 0.070%), and Aleut (17.0%, a difference of 0.090%).
| Demographics | Rating | Rank | Cognitive Disability |
| Welsh | 90.8 /100 | #138 | Exceptional 17.0% |
| French | 90.0 /100 | #139 | Excellent 17.0% |
| Chileans | 89.9 /100 | #140 | Excellent 17.0% |
| Aleuts | 89.9 /100 | #141 | Excellent 17.0% |
| Carpatho Rusyns | 89.6 /100 | #142 | Excellent 17.0% |
| British | 89.3 /100 | #143 | Excellent 17.0% |
| Immigrants | Brazil | 89.3 /100 | #144 | Excellent 17.0% |
| Immigrants | South Eastern Asia | 88.7 /100 | #145 | Excellent 17.0% |
| Costa Ricans | 88.0 /100 | #146 | Excellent 17.0% |
| Scotch-Irish | 85.9 /100 | #147 | Excellent 17.1% |
| French Canadians | 85.7 /100 | #148 | Excellent 17.1% |
| Cypriots | 85.7 /100 | #149 | Excellent 17.1% |
| Basques | 85.5 /100 | #150 | Excellent 17.1% |
| Syrians | 83.0 /100 | #151 | Excellent 17.1% |
| Immigrants | Indonesia | 82.7 /100 | #152 | Excellent 17.1% |
Demographics Similar to Malaysians by Cognitive Disability
In terms of cognitive disability, the demographic groups most similar to Malaysians are Cree (17.9%, a difference of 0.010%), Immigrants from Ethiopia (17.9%, a difference of 0.010%), Immigrants from Grenada (17.9%, a difference of 0.010%), Hopi (17.9%, a difference of 0.030%), and Hispanic or Latino (17.9%, a difference of 0.030%).
| Demographics | Rating | Rank | Cognitive Disability |
| Jamaicans | 0.9 /100 | #244 | Tragic 17.9% |
| Trinidadians and Tobagonians | 0.8 /100 | #245 | Tragic 17.9% |
| Immigrants | Thailand | 0.8 /100 | #246 | Tragic 17.9% |
| Samoans | 0.7 /100 | #247 | Tragic 17.9% |
| French American Indians | 0.7 /100 | #248 | Tragic 17.9% |
| Cree | 0.7 /100 | #249 | Tragic 17.9% |
| Immigrants | Ethiopia | 0.7 /100 | #250 | Tragic 17.9% |
| Malaysians | 0.6 /100 | #251 | Tragic 17.9% |
| Immigrants | Grenada | 0.6 /100 | #252 | Tragic 17.9% |
| Hopi | 0.6 /100 | #253 | Tragic 17.9% |
| Hispanics or Latinos | 0.6 /100 | #254 | Tragic 17.9% |
| Immigrants | Azores | 0.6 /100 | #255 | Tragic 17.9% |
| Bahamians | 0.6 /100 | #256 | Tragic 17.9% |
| Mexican American Indians | 0.6 /100 | #257 | Tragic 17.9% |
| Immigrants | Armenia | 0.6 /100 | #258 | Tragic 17.9% |