Immigrants from North Macedonia vs Native Hawaiian Disability Age 18 to 34
COMPARE
Immigrants from North Macedonia
Native Hawaiian
Disability Age 18 to 34
Disability Age 18 to 34 Comparison
Immigrants from North Macedonia
Native Hawaiians
6.0%
DISABILITY AGE 18 TO 34
99.5/ 100
METRIC RATING
67th/ 347
METRIC RANK
6.6%
DISABILITY AGE 18 TO 34
50.0/ 100
METRIC RATING
174th/ 347
METRIC RANK
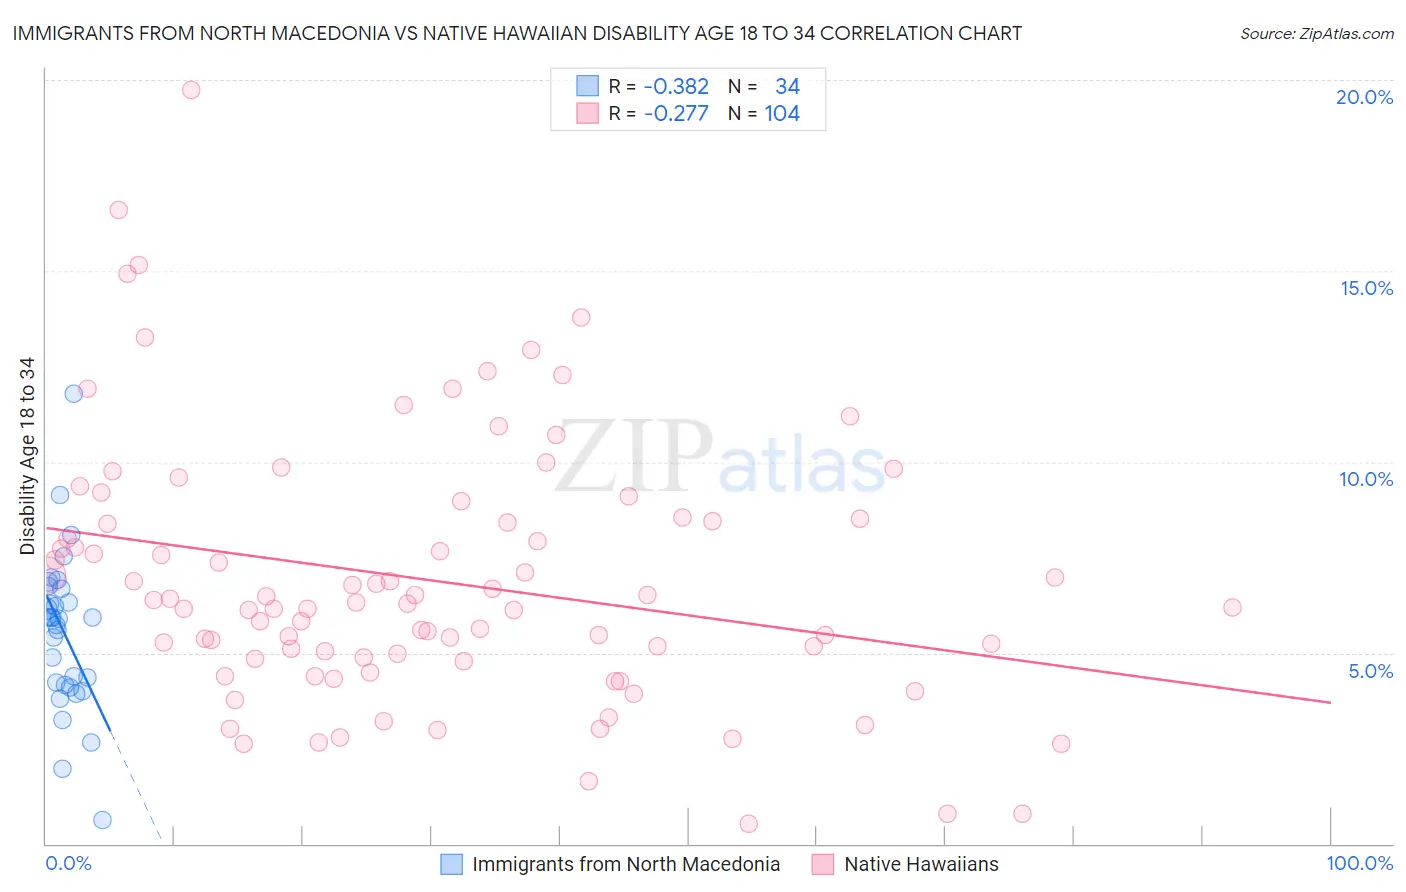
Immigrants from North Macedonia vs Native Hawaiian Disability Age 18 to 34 Correlation Chart
The statistical analysis conducted on geographies consisting of 74,269,972 people shows a mild negative correlation between the proportion of Immigrants from North Macedonia and percentage of population with a disability between the ages 18 and 35 in the United States with a correlation coefficient (R) of -0.382 and weighted average of 6.0%. Similarly, the statistical analysis conducted on geographies consisting of 331,479,390 people shows a weak negative correlation between the proportion of Native Hawaiians and percentage of population with a disability between the ages 18 and 35 in the United States with a correlation coefficient (R) of -0.277 and weighted average of 6.6%, a difference of 10.1%.
Disability Age 18 to 34 Correlation Summary
| Measurement | Immigrants from North Macedonia | Native Hawaiian |
| Minimum | 0.63% | 0.54% |
| Maximum | 11.8% | 19.7% |
| Range | 11.1% | 19.2% |
| Mean | 5.5% | 6.9% |
| Median | 5.9% | 6.3% |
| Interquartile 25% (IQ1) | 4.2% | 4.8% |
| Interquartile 75% (IQ3) | 6.7% | 8.5% |
| Interquartile Range (IQR) | 2.5% | 3.6% |
| Standard Deviation (Sample) | 2.1% | 3.4% |
| Standard Deviation (Population) | 2.0% | 3.4% |
Similar Demographics by Disability Age 18 to 34
Demographics Similar to Immigrants from North Macedonia by Disability Age 18 to 34
In terms of disability age 18 to 34, the demographic groups most similar to Immigrants from North Macedonia are Burmese (6.0%, a difference of 0.040%), Immigrants from Poland (6.0%, a difference of 0.060%), Trinidadian and Tobagonian (6.0%, a difference of 0.18%), Immigrants from West Indies (6.0%, a difference of 0.31%), and Taiwanese (6.0%, a difference of 0.32%).
| Demographics | Rating | Rank | Disability Age 18 to 34 |
| Immigrants | Sri Lanka | 99.6 /100 | #60 | Exceptional 6.0% |
| British West Indians | 99.6 /100 | #61 | Exceptional 6.0% |
| Peruvians | 99.6 /100 | #62 | Exceptional 6.0% |
| Salvadorans | 99.6 /100 | #63 | Exceptional 6.0% |
| Taiwanese | 99.6 /100 | #64 | Exceptional 6.0% |
| Trinidadians and Tobagonians | 99.5 /100 | #65 | Exceptional 6.0% |
| Burmese | 99.5 /100 | #66 | Exceptional 6.0% |
| Immigrants | North Macedonia | 99.5 /100 | #67 | Exceptional 6.0% |
| Immigrants | Poland | 99.5 /100 | #68 | Exceptional 6.0% |
| Immigrants | West Indies | 99.4 /100 | #69 | Exceptional 6.0% |
| Immigrants | Greece | 99.4 /100 | #70 | Exceptional 6.0% |
| Immigrants | Japan | 99.3 /100 | #71 | Exceptional 6.0% |
| Immigrants | Lebanon | 99.2 /100 | #72 | Exceptional 6.0% |
| Cypriots | 99.2 /100 | #73 | Exceptional 6.0% |
| Haitians | 99.2 /100 | #74 | Exceptional 6.0% |
Demographics Similar to Native Hawaiians by Disability Age 18 to 34
In terms of disability age 18 to 34, the demographic groups most similar to Native Hawaiians are Immigrants from Cambodia (6.6%, a difference of 0.24%), Immigrants from Mexico (6.6%, a difference of 0.29%), Immigrants from Africa (6.6%, a difference of 0.29%), Ghanaian (6.6%, a difference of 0.33%), and Bahamian (6.6%, a difference of 0.38%).
| Demographics | Rating | Rank | Disability Age 18 to 34 |
| Immigrants | Northern Europe | 64.1 /100 | #167 | Good 6.5% |
| Immigrants | Moldova | 63.1 /100 | #168 | Good 6.5% |
| Russians | 60.2 /100 | #169 | Good 6.5% |
| Immigrants | Bahamas | 57.9 /100 | #170 | Average 6.6% |
| Bahamians | 55.5 /100 | #171 | Average 6.6% |
| Ghanaians | 54.7 /100 | #172 | Average 6.6% |
| Immigrants | Mexico | 54.1 /100 | #173 | Average 6.6% |
| Native Hawaiians | 50.0 /100 | #174 | Average 6.6% |
| Immigrants | Cambodia | 46.5 /100 | #175 | Average 6.6% |
| Immigrants | Africa | 45.9 /100 | #176 | Average 6.6% |
| Syrians | 44.3 /100 | #177 | Average 6.6% |
| Nigerians | 43.7 /100 | #178 | Average 6.6% |
| Immigrants | Ghana | 42.1 /100 | #179 | Average 6.6% |
| Immigrants | Austria | 39.6 /100 | #180 | Fair 6.6% |
| Romanians | 39.5 /100 | #181 | Fair 6.6% |