Immigrants from Nepal vs Immigrants from Czechoslovakia Hearing Disability
COMPARE
Immigrants from Nepal
Immigrants from Czechoslovakia
Hearing Disability
Hearing Disability Comparison
Immigrants from Nepal
Immigrants from Czechoslovakia
2.7%
HEARING DISABILITY
98.3/ 100
METRIC RATING
65th/ 347
METRIC RANK
3.1%
HEARING DISABILITY
15.9/ 100
METRIC RATING
204th/ 347
METRIC RANK
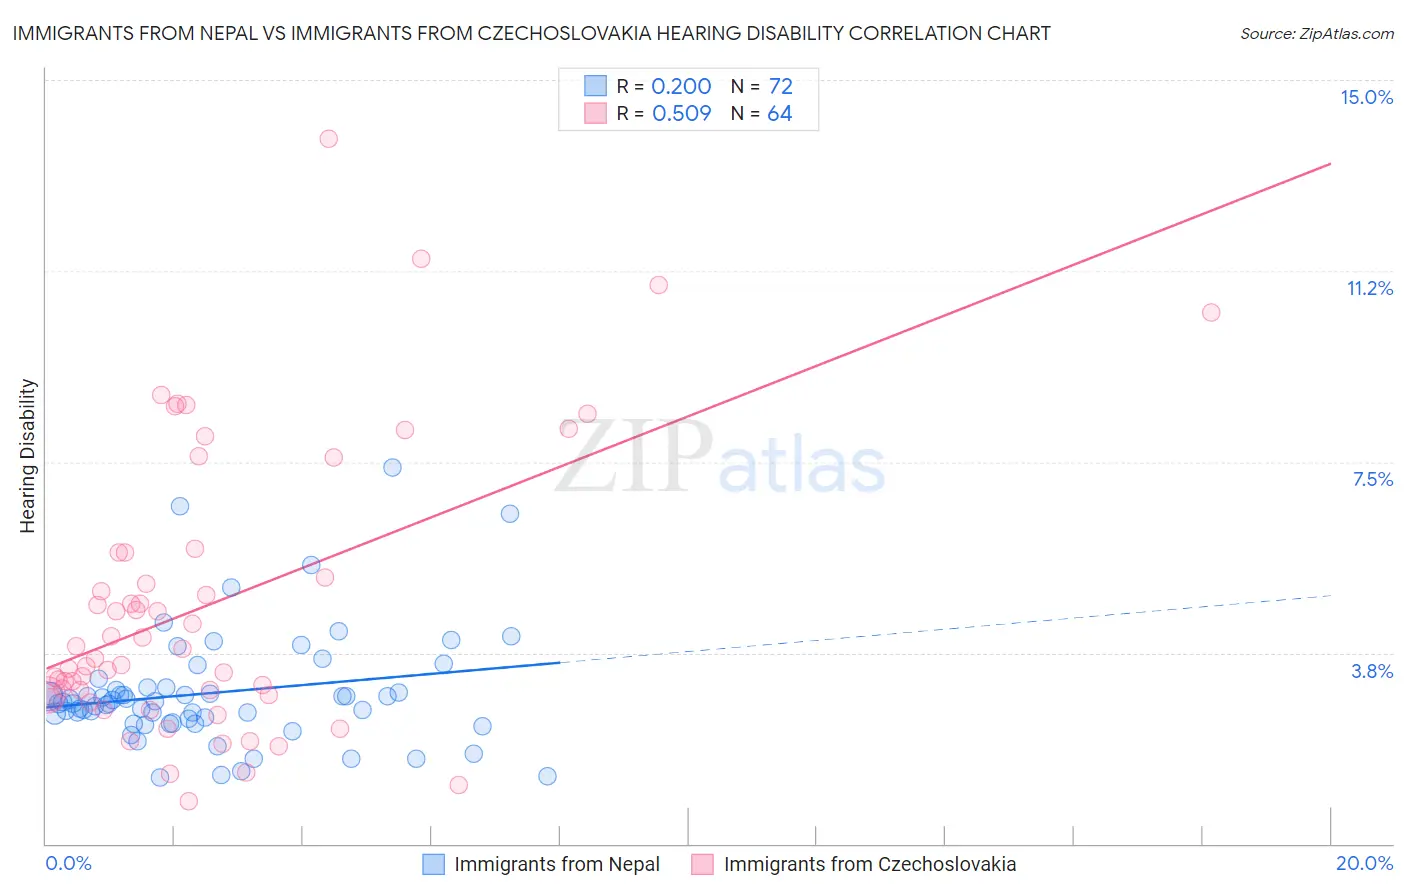
Immigrants from Nepal vs Immigrants from Czechoslovakia Hearing Disability Correlation Chart
The statistical analysis conducted on geographies consisting of 186,754,465 people shows a weak positive correlation between the proportion of Immigrants from Nepal and percentage of population with hearing disability in the United States with a correlation coefficient (R) of 0.200 and weighted average of 2.7%. Similarly, the statistical analysis conducted on geographies consisting of 195,448,522 people shows a substantial positive correlation between the proportion of Immigrants from Czechoslovakia and percentage of population with hearing disability in the United States with a correlation coefficient (R) of 0.509 and weighted average of 3.1%, a difference of 14.8%.
Hearing Disability Correlation Summary
| Measurement | Immigrants from Nepal | Immigrants from Czechoslovakia |
| Minimum | 1.3% | 0.83% |
| Maximum | 7.4% | 13.9% |
| Range | 6.1% | 13.0% |
| Mean | 3.0% | 4.7% |
| Median | 2.8% | 3.7% |
| Interquartile 25% (IQ1) | 2.4% | 2.9% |
| Interquartile 75% (IQ3) | 3.0% | 5.7% |
| Interquartile Range (IQR) | 0.63% | 2.8% |
| Standard Deviation (Sample) | 1.1% | 2.8% |
| Standard Deviation (Population) | 1.1% | 2.8% |
Similar Demographics by Hearing Disability
Demographics Similar to Immigrants from Nepal by Hearing Disability
In terms of hearing disability, the demographic groups most similar to Immigrants from Nepal are Immigrants from Sri Lanka (2.7%, a difference of 0.080%), Immigrants from Belize (2.7%, a difference of 0.12%), Indian (Asian) (2.7%, a difference of 0.14%), Immigrants from Uzbekistan (2.7%, a difference of 0.19%), and Immigrants from Colombia (2.7%, a difference of 0.19%).
| Demographics | Rating | Rank | Hearing Disability |
| Immigrants | Peru | 98.6 /100 | #58 | Exceptional 2.7% |
| Immigrants | Eritrea | 98.5 /100 | #59 | Exceptional 2.7% |
| Immigrants | Egypt | 98.5 /100 | #60 | Exceptional 2.7% |
| Immigrants | Uzbekistan | 98.4 /100 | #61 | Exceptional 2.7% |
| Immigrants | Colombia | 98.4 /100 | #62 | Exceptional 2.7% |
| Indians (Asian) | 98.4 /100 | #63 | Exceptional 2.7% |
| Immigrants | Sri Lanka | 98.4 /100 | #64 | Exceptional 2.7% |
| Immigrants | Nepal | 98.3 /100 | #65 | Exceptional 2.7% |
| Immigrants | Belize | 98.2 /100 | #66 | Exceptional 2.7% |
| Egyptians | 98.1 /100 | #67 | Exceptional 2.7% |
| Immigrants | Africa | 98.0 /100 | #68 | Exceptional 2.7% |
| Nicaraguans | 97.9 /100 | #69 | Exceptional 2.7% |
| Peruvians | 97.7 /100 | #70 | Exceptional 2.7% |
| Central Americans | 97.7 /100 | #71 | Exceptional 2.7% |
| Afghans | 97.6 /100 | #72 | Exceptional 2.7% |
Demographics Similar to Immigrants from Czechoslovakia by Hearing Disability
In terms of hearing disability, the demographic groups most similar to Immigrants from Czechoslovakia are Alsatian (3.1%, a difference of 0.0%), Immigrants from Denmark (3.1%, a difference of 0.050%), Eastern European (3.1%, a difference of 0.070%), Immigrants from Thailand (3.1%, a difference of 0.090%), and Hispanic or Latino (3.1%, a difference of 0.13%).
| Demographics | Rating | Rank | Hearing Disability |
| Immigrants | Bosnia and Herzegovina | 20.6 /100 | #197 | Fair 3.1% |
| Immigrants | Croatia | 20.5 /100 | #198 | Fair 3.1% |
| Syrians | 19.2 /100 | #199 | Poor 3.1% |
| Immigrants | North Macedonia | 19.1 /100 | #200 | Poor 3.1% |
| Iraqis | 19.0 /100 | #201 | Poor 3.1% |
| Immigrants | Thailand | 16.4 /100 | #202 | Poor 3.1% |
| Immigrants | Denmark | 16.2 /100 | #203 | Poor 3.1% |
| Immigrants | Czechoslovakia | 15.9 /100 | #204 | Poor 3.1% |
| Alsatians | 15.9 /100 | #205 | Poor 3.1% |
| Eastern Europeans | 15.5 /100 | #206 | Poor 3.1% |
| Hispanics or Latinos | 15.1 /100 | #207 | Poor 3.1% |
| Immigrants | Latvia | 12.7 /100 | #208 | Poor 3.1% |
| Immigrants | Hungary | 12.5 /100 | #209 | Poor 3.1% |
| Cape Verdeans | 12.2 /100 | #210 | Poor 3.1% |
| Romanians | 12.1 /100 | #211 | Poor 3.1% |