Immigrants from Liberia vs Arapaho Disability Age 18 to 34
COMPARE
Immigrants from Liberia
Arapaho
Disability Age 18 to 34
Disability Age 18 to 34 Comparison
Immigrants from Liberia
Arapaho
7.1%
DISABILITY AGE 18 TO 34
0.8/ 100
METRIC RATING
246th/ 347
METRIC RANK
7.1%
DISABILITY AGE 18 TO 34
1.1/ 100
METRIC RATING
240th/ 347
METRIC RANK
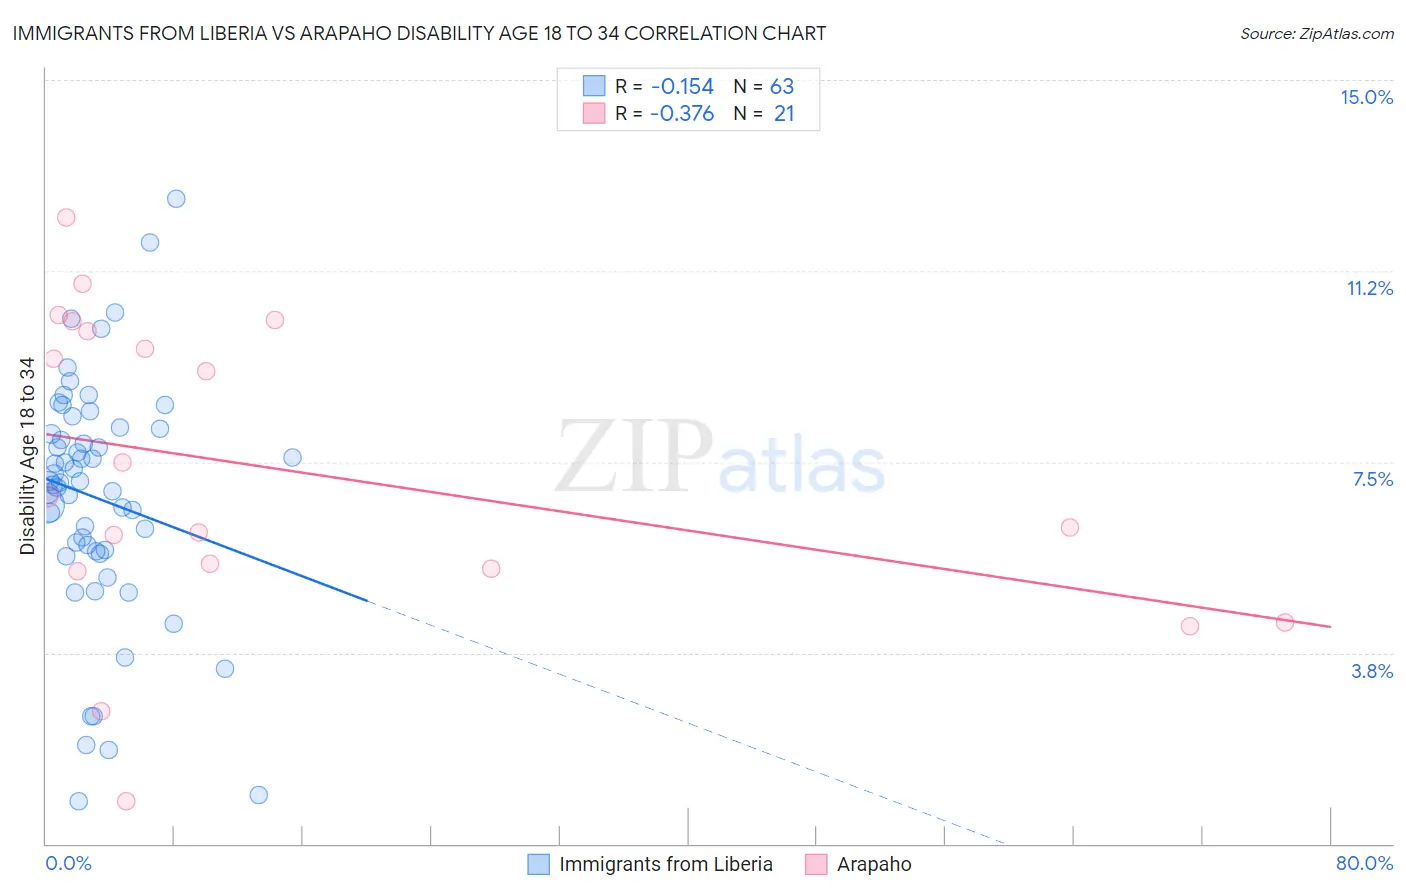
Immigrants from Liberia vs Arapaho Disability Age 18 to 34 Correlation Chart
The statistical analysis conducted on geographies consisting of 135,213,913 people shows a poor negative correlation between the proportion of Immigrants from Liberia and percentage of population with a disability between the ages 18 and 35 in the United States with a correlation coefficient (R) of -0.154 and weighted average of 7.1%. Similarly, the statistical analysis conducted on geographies consisting of 29,757,302 people shows a mild negative correlation between the proportion of Arapaho and percentage of population with a disability between the ages 18 and 35 in the United States with a correlation coefficient (R) of -0.376 and weighted average of 7.1%, a difference of 0.44%.
Disability Age 18 to 34 Correlation Summary
| Measurement | Immigrants from Liberia | Arapaho |
| Minimum | 0.85% | 0.84% |
| Maximum | 12.7% | 12.3% |
| Range | 11.8% | 11.5% |
| Mean | 6.8% | 7.3% |
| Median | 7.1% | 6.8% |
| Interquartile 25% (IQ1) | 5.7% | 5.4% |
| Interquartile 75% (IQ3) | 8.2% | 10.2% |
| Interquartile Range (IQR) | 2.4% | 4.8% |
| Standard Deviation (Sample) | 2.4% | 3.0% |
| Standard Deviation (Population) | 2.4% | 3.0% |
Demographics Similar to Immigrants from Liberia and Arapaho by Disability Age 18 to 34
In terms of disability age 18 to 34, the demographic groups most similar to Immigrants from Liberia are Hungarian (7.1%, a difference of 0.020%), Immigrants from Zaire (7.1%, a difference of 0.12%), Yugoslavian (7.2%, a difference of 0.15%), Guamanian/Chamorro (7.2%, a difference of 0.18%), and Malaysian (7.2%, a difference of 0.28%). Similarly, the demographic groups most similar to Arapaho are Nepalese (7.1%, a difference of 0.0%), Immigrants from Congo (7.1%, a difference of 0.050%), Icelander (7.1%, a difference of 0.11%), Italian (7.1%, a difference of 0.12%), and Marshallese (7.1%, a difference of 0.23%).
| Demographics | Rating | Rank | Disability Age 18 to 34 |
| New Zealanders | 2.7 /100 | #233 | Tragic 7.0% |
| Alsatians | 2.1 /100 | #234 | Tragic 7.0% |
| Sub-Saharan Africans | 1.7 /100 | #235 | Tragic 7.1% |
| Liberians | 1.5 /100 | #236 | Tragic 7.1% |
| Austrians | 1.3 /100 | #237 | Tragic 7.1% |
| Marshallese | 1.3 /100 | #238 | Tragic 7.1% |
| Italians | 1.2 /100 | #239 | Tragic 7.1% |
| Arapaho | 1.1 /100 | #240 | Tragic 7.1% |
| Nepalese | 1.1 /100 | #241 | Tragic 7.1% |
| Immigrants | Congo | 1.1 /100 | #242 | Tragic 7.1% |
| Icelanders | 1.0 /100 | #243 | Tragic 7.1% |
| Immigrants | Zaire | 0.9 /100 | #244 | Tragic 7.1% |
| Hungarians | 0.9 /100 | #245 | Tragic 7.1% |
| Immigrants | Liberia | 0.8 /100 | #246 | Tragic 7.1% |
| Yugoslavians | 0.8 /100 | #247 | Tragic 7.2% |
| Guamanians/Chamorros | 0.8 /100 | #248 | Tragic 7.2% |
| Malaysians | 0.7 /100 | #249 | Tragic 7.2% |
| Fijians | 0.6 /100 | #250 | Tragic 7.2% |
| Spaniards | 0.6 /100 | #251 | Tragic 7.2% |
| Poles | 0.6 /100 | #252 | Tragic 7.2% |
| Croatians | 0.5 /100 | #253 | Tragic 7.2% |