Immigrants from Laos vs Polish Disability Age 18 to 34
COMPARE
Immigrants from Laos
Polish
Disability Age 18 to 34
Disability Age 18 to 34 Comparison
Immigrants from Laos
Poles
7.2%
DISABILITY AGE 18 TO 34
0.4/ 100
METRIC RATING
256th/ 347
METRIC RANK
7.2%
DISABILITY AGE 18 TO 34
0.6/ 100
METRIC RATING
252nd/ 347
METRIC RANK
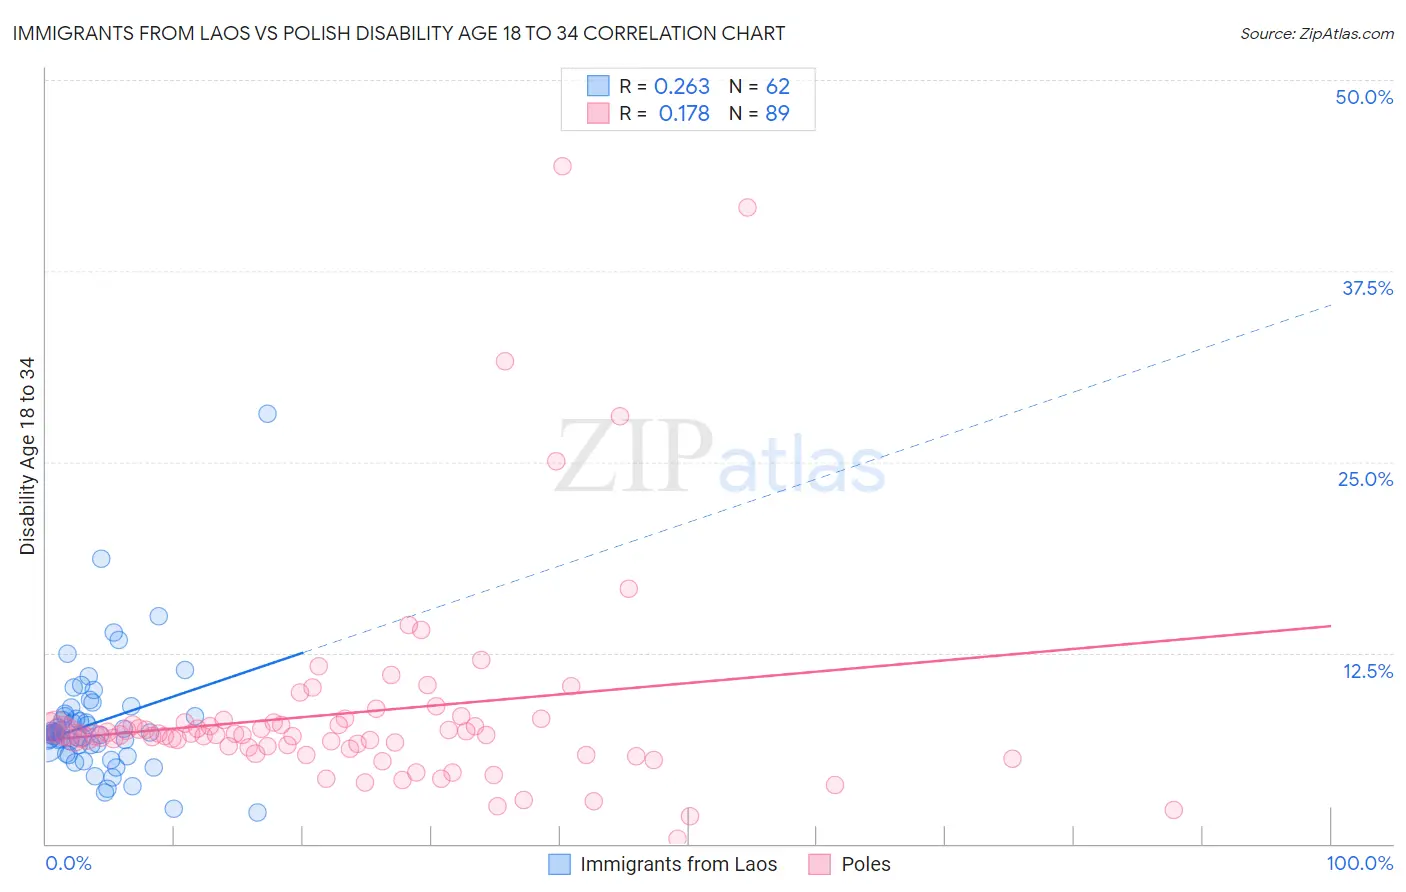
Immigrants from Laos vs Polish Disability Age 18 to 34 Correlation Chart
The statistical analysis conducted on geographies consisting of 201,298,297 people shows a weak positive correlation between the proportion of Immigrants from Laos and percentage of population with a disability between the ages 18 and 35 in the United States with a correlation coefficient (R) of 0.263 and weighted average of 7.2%. Similarly, the statistical analysis conducted on geographies consisting of 555,253,570 people shows a poor positive correlation between the proportion of Poles and percentage of population with a disability between the ages 18 and 35 in the United States with a correlation coefficient (R) of 0.178 and weighted average of 7.2%, a difference of 0.61%.
Disability Age 18 to 34 Correlation Summary
| Measurement | Immigrants from Laos | Polish |
| Minimum | 2.0% | 0.32% |
| Maximum | 28.2% | 44.4% |
| Range | 26.1% | 44.1% |
| Mean | 8.0% | 8.6% |
| Median | 7.3% | 7.1% |
| Interquartile 25% (IQ1) | 6.4% | 6.2% |
| Interquartile 75% (IQ3) | 8.5% | 7.9% |
| Interquartile Range (IQR) | 2.1% | 1.7% |
| Standard Deviation (Sample) | 3.9% | 7.0% |
| Standard Deviation (Population) | 3.9% | 6.9% |
Demographics Similar to Immigrants from Laos and Poles by Disability Age 18 to 34
In terms of disability age 18 to 34, the demographic groups most similar to Immigrants from Laos are Immigrants from Germany (7.2%, a difference of 0.030%), Indonesian (7.2%, a difference of 0.050%), Czech (7.2%, a difference of 0.27%), Croatian (7.2%, a difference of 0.34%), and Spaniard (7.2%, a difference of 0.62%). Similarly, the demographic groups most similar to Poles are Spaniard (7.2%, a difference of 0.020%), Fijian (7.2%, a difference of 0.030%), Croatian (7.2%, a difference of 0.27%), Malaysian (7.2%, a difference of 0.33%), and Guamanian/Chamorro (7.2%, a difference of 0.42%).
| Demographics | Rating | Rank | Disability Age 18 to 34 |
| Immigrants | Zaire | 0.9 /100 | #244 | Tragic 7.1% |
| Hungarians | 0.9 /100 | #245 | Tragic 7.1% |
| Immigrants | Liberia | 0.8 /100 | #246 | Tragic 7.1% |
| Yugoslavians | 0.8 /100 | #247 | Tragic 7.2% |
| Guamanians/Chamorros | 0.8 /100 | #248 | Tragic 7.2% |
| Malaysians | 0.7 /100 | #249 | Tragic 7.2% |
| Fijians | 0.6 /100 | #250 | Tragic 7.2% |
| Spaniards | 0.6 /100 | #251 | Tragic 7.2% |
| Poles | 0.6 /100 | #252 | Tragic 7.2% |
| Croatians | 0.5 /100 | #253 | Tragic 7.2% |
| Indonesians | 0.4 /100 | #254 | Tragic 7.2% |
| Immigrants | Germany | 0.4 /100 | #255 | Tragic 7.2% |
| Immigrants | Laos | 0.4 /100 | #256 | Tragic 7.2% |
| Czechs | 0.3 /100 | #257 | Tragic 7.2% |
| Immigrants | Micronesia | 0.3 /100 | #258 | Tragic 7.3% |
| Somalis | 0.2 /100 | #259 | Tragic 7.3% |
| Tohono O'odham | 0.2 /100 | #260 | Tragic 7.3% |
| Northern Europeans | 0.2 /100 | #261 | Tragic 7.3% |
| Canadians | 0.2 /100 | #262 | Tragic 7.3% |
| British | 0.2 /100 | #263 | Tragic 7.3% |
| Bermudans | 0.1 /100 | #264 | Tragic 7.3% |