Immigrants from Kazakhstan vs Immigrants from Romania Hearing Disability
COMPARE
Immigrants from Kazakhstan
Immigrants from Romania
Hearing Disability
Hearing Disability Comparison
Immigrants from Kazakhstan
Immigrants from Romania
2.9%
HEARING DISABILITY
69.6/ 100
METRIC RATING
157th/ 347
METRIC RANK
3.0%
HEARING DISABILITY
48.4/ 100
METRIC RATING
175th/ 347
METRIC RANK
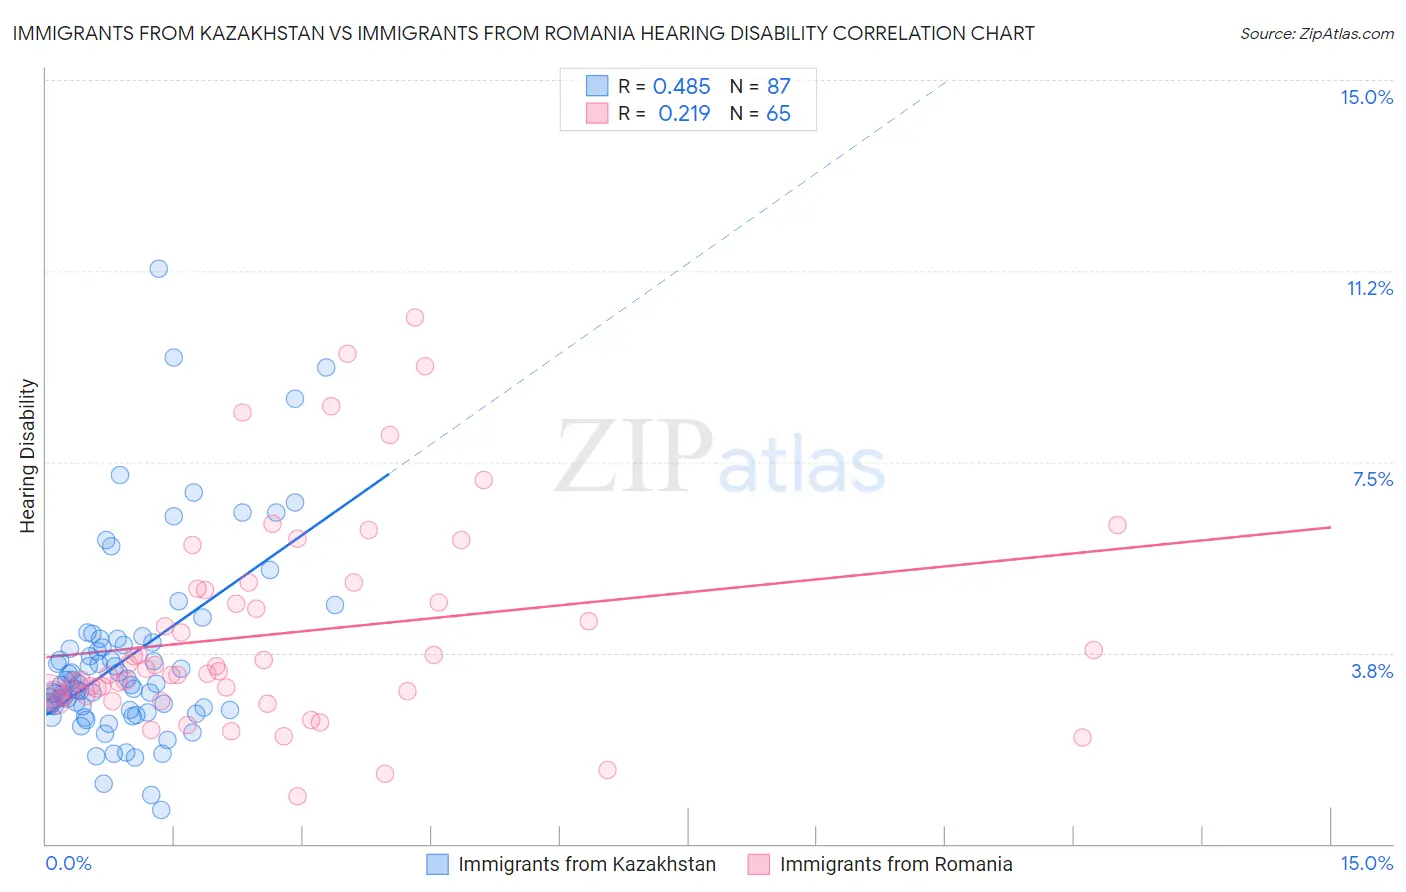
Immigrants from Kazakhstan vs Immigrants from Romania Hearing Disability Correlation Chart
The statistical analysis conducted on geographies consisting of 124,435,235 people shows a moderate positive correlation between the proportion of Immigrants from Kazakhstan and percentage of population with hearing disability in the United States with a correlation coefficient (R) of 0.485 and weighted average of 2.9%. Similarly, the statistical analysis conducted on geographies consisting of 256,976,190 people shows a weak positive correlation between the proportion of Immigrants from Romania and percentage of population with hearing disability in the United States with a correlation coefficient (R) of 0.219 and weighted average of 3.0%, a difference of 2.1%.
Hearing Disability Correlation Summary
| Measurement | Immigrants from Kazakhstan | Immigrants from Romania |
| Minimum | 0.67% | 0.93% |
| Maximum | 11.3% | 10.3% |
| Range | 10.6% | 9.4% |
| Mean | 3.6% | 4.1% |
| Median | 3.1% | 3.4% |
| Interquartile 25% (IQ1) | 2.6% | 2.9% |
| Interquartile 75% (IQ3) | 4.0% | 5.0% |
| Interquartile Range (IQR) | 1.3% | 2.1% |
| Standard Deviation (Sample) | 1.9% | 2.0% |
| Standard Deviation (Population) | 1.9% | 2.0% |
Demographics Similar to Immigrants from Kazakhstan and Immigrants from Romania by Hearing Disability
In terms of hearing disability, the demographic groups most similar to Immigrants from Kazakhstan are Immigrants from Burma/Myanmar (2.9%, a difference of 0.010%), Immigrants from Poland (2.9%, a difference of 0.070%), Immigrants from Australia (2.9%, a difference of 0.25%), Immigrants from Fiji (2.9%, a difference of 0.27%), and Albanian (2.9%, a difference of 0.33%). Similarly, the demographic groups most similar to Immigrants from Romania are Panamanian (3.0%, a difference of 0.14%), Indonesian (3.0%, a difference of 0.15%), Immigrants from Serbia (3.0%, a difference of 0.25%), Armenian (3.0%, a difference of 0.72%), and Immigrants from Ukraine (3.0%, a difference of 0.78%).
| Demographics | Rating | Rank | Hearing Disability |
| Immigrants | Poland | 70.2 /100 | #156 | Good 2.9% |
| Immigrants | Kazakhstan | 69.6 /100 | #157 | Good 2.9% |
| Immigrants | Burma/Myanmar | 69.5 /100 | #158 | Good 2.9% |
| Immigrants | Australia | 67.4 /100 | #159 | Good 2.9% |
| Immigrants | Fiji | 67.1 /100 | #160 | Good 2.9% |
| Albanians | 66.6 /100 | #161 | Good 2.9% |
| Immigrants | Japan | 66.3 /100 | #162 | Good 2.9% |
| Immigrants | Central America | 64.9 /100 | #163 | Good 3.0% |
| Immigrants | Cambodia | 64.8 /100 | #164 | Good 3.0% |
| Immigrants | Zimbabwe | 64.2 /100 | #165 | Good 3.0% |
| Immigrants | South Eastern Asia | 62.9 /100 | #166 | Good 3.0% |
| Immigrants | Eastern Europe | 58.1 /100 | #167 | Average 3.0% |
| Immigrants | Greece | 57.9 /100 | #168 | Average 3.0% |
| Arabs | 57.6 /100 | #169 | Average 3.0% |
| Immigrants | Cabo Verde | 56.9 /100 | #170 | Average 3.0% |
| Immigrants | Ukraine | 56.6 /100 | #171 | Average 3.0% |
| Armenians | 56.0 /100 | #172 | Average 3.0% |
| Immigrants | Serbia | 51.1 /100 | #173 | Average 3.0% |
| Indonesians | 50.0 /100 | #174 | Average 3.0% |
| Immigrants | Romania | 48.4 /100 | #175 | Average 3.0% |
| Panamanians | 47.0 /100 | #176 | Average 3.0% |