Immigrants from Italy vs New Zealander Female Disability

COMPARE

Immigrants from Italy
Race
Ancestry
AfghanAfricanAlaska NativeAlaskan AthabascanAlbanianAleutAlsatianAmericanApacheArabArapahoArgentineanArmenianAssyrian/Chaldean/SyriacAustralianAustrianBahamianBangladeshiBarbadianBasqueBelgianBelizeanBermudanBhutaneseBlackfeetBolivianBrazilianBritishBritish West IndianBulgarianBurmeseCajunCambodianCanadianCape VerdeanCarpatho RusynCelticCentral AmericanCentral American IndianCherokeeCheyenneChickasawChileanChineseChippewaChoctawColombianColvilleComancheCosta RicanCreeCreekCroatianCrowCubanCypriotCzechCzechoslovakianDanishDelawareDominicanDutchDutch West IndianEastern EuropeanEcuadorianEgyptianEnglishEstonianEthiopianEuropeanFijianFilipinoFinnishFrenchFrench American IndianFrench CanadianGermanGerman RussianGhanaianGreekGuamanian/ChamorroGuatemalanGuyaneseHaitianHmongHonduranHopiHoumaHungarianIcelanderIndian (Asian)IndonesianInupiatIranianIraqiIrishIroquoisIsraeliItalianJamaicanJapaneseJordanianKenyanKiowaKoreanLaotianLatvianLebaneseLiberianLithuanianLumbeeLuxembourgerMacedonianMalaysianMalteseMarshalleseMenomineeMexicanMexican American IndianMongolianMoroccanNative HawaiianNavajoNepaleseNicaraguanNigerianNorthern EuropeanNorwegianOkinawanOsageOttawaPaiutePakistaniPalestinianPanamanianParaguayanPennsylvania GermanPeruvianPimaPolishPortuguesePotawatomiPuebloPuerto RicanPuget Sound SalishRomanianRussianSalvadoranSamoanScandinavianScotch-IrishScottishSeminoleSenegaleseSerbianShoshoneSierra LeoneanSiouxSlavicSlovakSloveneSomaliSouth AfricanSouth AmericanSouth American IndianSoviet UnionSpaniardSpanishSpanish AmericanSpanish American IndianSri LankanSubsaharan AfricanSudaneseSwedishSwissSyrianTaiwaneseThaiTlingit-HaidaTohono O'OdhamTonganTrinidadian and TobagonianTsimshianTurkishU.S. Virgin IslanderUgandanUkrainianUruguayanUteVenezuelanVietnameseWelshWest IndianYakamaYaquiYugoslavianYumanYup'ikZimbabwean
Immigration
NonimmigrantsImmigrantsAfghanistanAfricaAlbaniaArgentinaArmeniaAsiaAustraliaAustriaBahamasBangladeshBarbadosBelarusBelgiumBelizeBoliviaBosnia and HerzegovinaBrazilBulgariaBurma/MyanmarCabo VerdeCambodiaCameroonCanadaCaribbeanCentral AmericaChileChinaColombiaCongoCosta RicaCroatiaCubaCzechoslovakiaDenmarkDominicaDominican RepublicEastern AfricaEastern AsiaEastern EuropeEcuadorEgyptEl SalvadorEnglandEritreaEthiopiaEuropeFijiFranceGermanyGhanaGreeceGrenadaGuatemalaGuyanaHaitiHondurasHong KongHungaryIndiaIndonesiaIranIraqIrelandIsraelItalyJamaicaJapanJordanKazakhstanKenyaKoreaKuwaitLaosLatin AmericaLatviaLebanonLiberiaLithuaniaMalaysiaMexicoMicronesiaMiddle AfricaMoldovaMoroccoNepalNetherlandsNicaraguaNigeriaNorth AmericaNorth MacedoniaNorthern AfricaNorthern EuropeNorwayOceaniaPakistanPanamaPeruPhilippinesPolandPortugalRomaniaRussiaSaudi ArabiaScotlandSenegalSerbiaSierra LeoneSingaporeSomaliaSouth AfricaSouth AmericaSouth Central AsiaSouth Eastern AsiaSouthern EuropeSpainSri LankaSt. Vincent and the GrenadinesSudanSwedenSwitzerlandSyriaTaiwanThailandTrinidad and TobagoTurkeyUgandaUkraineUruguayUzbekistanVenezuelaVietnamWest IndiesWestern AfricaWestern AsiaWestern EuropeYemenZaireZimbabweAzores
New Zealander
Race
Ancestry
AfghanAfricanAlaska NativeAlaskan AthabascanAlbanianAleutAlsatianAmericanApacheArabArapahoArgentineanArmenianAssyrian/Chaldean/SyriacAustralianAustrianBahamianBangladeshiBarbadianBasqueBelgianBelizeanBermudanBhutaneseBlackfeetBolivianBrazilianBritishBritish West IndianBulgarianBurmeseCajunCambodianCanadianCape VerdeanCarpatho RusynCelticCentral AmericanCentral American IndianCherokeeCheyenneChickasawChileanChineseChippewaChoctawColombianColvilleComancheCosta RicanCreeCreekCroatianCrowCubanCypriotCzechCzechoslovakianDanishDelawareDominicanDutchDutch West IndianEastern EuropeanEcuadorianEgyptianEnglishEstonianEthiopianEuropeanFijianFilipinoFinnishFrenchFrench American IndianFrench CanadianGermanGerman RussianGhanaianGreekGuamanian/ChamorroGuatemalanGuyaneseHaitianHmongHonduranHopiHoumaHungarianIcelanderIndian (Asian)IndonesianInupiatIranianIraqiIrishIroquoisIsraeliItalianJamaicanJapaneseJordanianKenyanKiowaKoreanLaotianLatvianLebaneseLiberianLithuanianLumbeeLuxembourgerMacedonianMalaysianMalteseMarshalleseMenomineeMexicanMexican American IndianMongolianMoroccanNative HawaiianNavajoNepaleseNew ZealanderNicaraguanNigerianNorthern EuropeanNorwegianOkinawanOsageOttawaPaiutePakistaniPalestinianPanamanianParaguayanPennsylvania GermanPeruvianPimaPolishPortuguesePotawatomiPuebloPuerto RicanPuget Sound SalishRomanianRussianSalvadoranSamoanScandinavianScotch-IrishScottishSeminoleSenegaleseSerbianShoshoneSierra LeoneanSiouxSlavicSlovakSloveneSomaliSouth AfricanSouth AmericanSouth American IndianSoviet UnionSpaniardSpanishSpanish AmericanSpanish American IndianSri LankanSubsaharan AfricanSudaneseSwedishSwissSyrianTaiwaneseThaiTlingit-HaidaTohono O'OdhamTonganTrinidadian and TobagonianTsimshianTurkishU.S. Virgin IslanderUgandanUkrainianUruguayanUteVenezuelanVietnameseWelshWest IndianYakamaYaquiYugoslavianYumanYup'ikZimbabwean
Immigration
NonimmigrantsImmigrantsAfghanistanAfricaAlbaniaArgentinaArmeniaAsiaAustraliaAustriaBahamasBangladeshBarbadosBelarusBelgiumBelizeBoliviaBosnia and HerzegovinaBrazilBulgariaBurma/MyanmarCabo VerdeCambodiaCameroonCanadaCaribbeanCentral AmericaChileChinaColombiaCongoCosta RicaCroatiaCubaCzechoslovakiaDenmarkDominicaDominican RepublicEastern AfricaEastern AsiaEastern EuropeEcuadorEgyptEl SalvadorEnglandEritreaEthiopiaEuropeFijiFranceGermanyGhanaGreeceGrenadaGuatemalaGuyanaHaitiHondurasHong KongHungaryIndiaIndonesiaIranIraqIrelandIsraelJamaicaJapanJordanKazakhstanKenyaKoreaKuwaitLaosLatin AmericaLatviaLebanonLiberiaLithuaniaMalaysiaMexicoMicronesiaMiddle AfricaMoldovaMoroccoNepalNetherlandsNicaraguaNigeriaNorth AmericaNorth MacedoniaNorthern AfricaNorthern EuropeNorwayOceaniaPakistanPanamaPeruPhilippinesPolandPortugalRomaniaRussiaSaudi ArabiaScotlandSenegalSerbiaSierra LeoneSingaporeSomaliaSouth AfricaSouth AmericaSouth Central AsiaSouth Eastern AsiaSouthern EuropeSpainSri LankaSt. Vincent and the GrenadinesSudanSwedenSwitzerlandSyriaTaiwanThailandTrinidad and TobagoTurkeyUgandaUkraineUruguayUzbekistanVenezuelaVietnamWest IndiesWestern AfricaWestern AsiaWestern EuropeYemenZaireZimbabweAzores
Female Disability
Income
Poverty
Unemployment
Labor Participation
Family Structure
Vehicle Availability
Education Level
Disability

Female Disability Comparison

Immigrants from Italy

New Zealanders

Exceptional
Exceptional
11.8%
FEMALE DISABILITY
96.4/ 100
METRIC RATING
125th/ 347
METRIC RANK
11.7%
FEMALE DISABILITY
98.1/ 100
METRIC RATING
108th/ 347
METRIC RANK

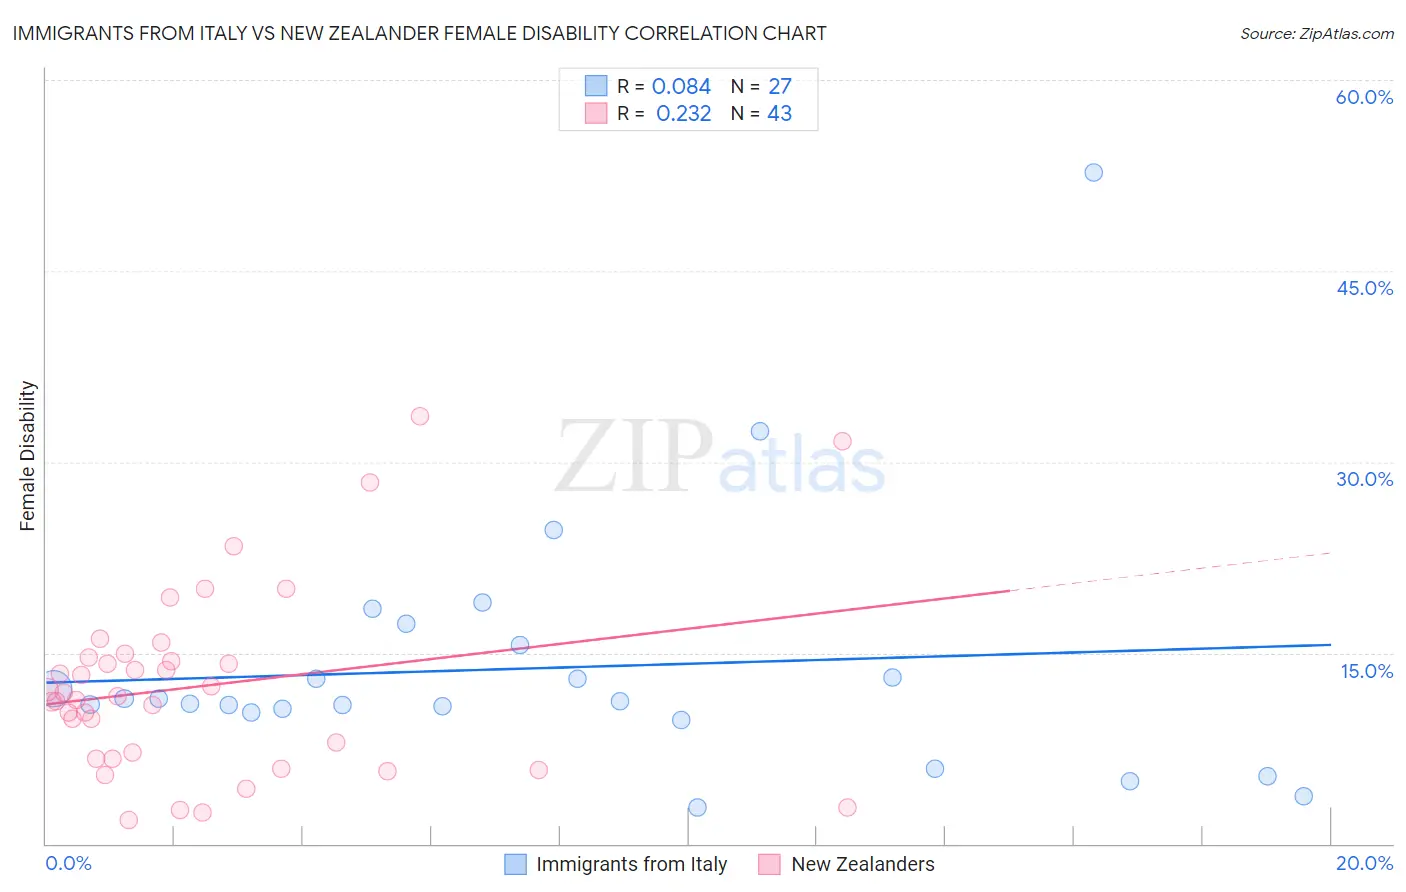
Immigrants from Italy vs New Zealander Female Disability Correlation Chart

The statistical analysis conducted on geographies consisting of 324,199,365 people shows a slight positive correlation between the proportion of Immigrants from Italy and percentage of females with a disability in the United States with a correlation coefficient (R) of 0.084 and weighted average of 11.8%. Similarly, the statistical analysis conducted on geographies consisting of 106,921,285 people shows a weak positive correlation between the proportion of New Zealanders and percentage of females with a disability in the United States with a correlation coefficient (R) of 0.232 and weighted average of 11.7%, a difference of 0.66%.
Immigrants from Italy vs New Zealander Female Disability

Female Disability Correlation Summary

MeasurementImmigrants from ItalyNew Zealander
Minimum2.9%1.9%
Maximum52.8%33.6%
Range49.9%31.7%
Mean13.8%12.4%
Median11.2%11.6%
Interquartile 25% (IQ1)10.3%6.7%
Interquartile 75% (IQ3)15.6%14.7%
Interquartile Range (IQR)5.3%7.9%
Standard Deviation (Sample)10.0%7.2%
Standard Deviation (Population)9.8%7.1%

Demographics Similar to Immigrants from Italy and New Zealanders by Female Disability

In terms of female disability, the demographic groups most similar to Immigrants from Italy are Russian (11.8%, a difference of 0.030%), Immigrants from Europe (11.8%, a difference of 0.060%), Immigrants from Croatia (11.8%, a difference of 0.070%), Immigrants from North Macedonia (11.8%, a difference of 0.13%), and Immigrants from Netherlands (11.8%, a difference of 0.14%). Similarly, the demographic groups most similar to New Zealanders are Latvian (11.7%, a difference of 0.020%), Immigrants (11.7%, a difference of 0.030%), Soviet Union (11.7%, a difference of 0.030%), Immigrants from Greece (11.7%, a difference of 0.050%), and Costa Rican (11.7%, a difference of 0.050%).
DemographicsRating | RankFemale Disability
Immigrants | Greece
98.2
/100
|
#106
Exceptional
11.7%
Latvians
98.2
/100
|
#107
Exceptional
11.7%
New Zealanders
98.1
/100
|
#108
Exceptional
11.7%
Immigrants | Immigrants
98.1
/100
|
#109
Exceptional
11.7%
Soviet Union
98.1
/100
|
#110
Exceptional
11.7%
Costa Ricans
98.1
/100
|
#111
Exceptional
11.7%
Immigrants | Bangladesh
97.8
/100
|
#112
Exceptional
11.8%
Immigrants | Belarus
97.8
/100
|
#113
Exceptional
11.8%
South Africans
97.7
/100
|
#114
Exceptional
11.8%
Brazilians
97.7
/100
|
#115
Exceptional
11.8%
Immigrants | Morocco
97.6
/100
|
#116
Exceptional
11.8%
Immigrants | Eastern Europe
97.2
/100
|
#117
Exceptional
11.8%
Immigrants | Nigeria
97.2
/100
|
#118
Exceptional
11.8%
Immigrants | Uganda
97.2
/100
|
#119
Exceptional
11.8%
Immigrants | Kazakhstan
97.0
/100
|
#120
Exceptional
11.8%
Immigrants | Netherlands
96.9
/100
|
#121
Exceptional
11.8%
Immigrants | North Macedonia
96.8
/100
|
#122
Exceptional
11.8%
Immigrants | Croatia
96.7
/100
|
#123
Exceptional
11.8%
Russians
96.5
/100
|
#124
Exceptional
11.8%
Immigrants | Italy
96.4
/100
|
#125
Exceptional
11.8%
Immigrants | Europe
96.2
/100
|
#126
Exceptional
11.8%