Immigrants from England vs Liberian Female Disability
COMPARE
Immigrants from England
Liberian
Female Disability
Female Disability Comparison
Immigrants from England
Liberians
12.2%
FEMALE DISABILITY
50.0/ 100
METRIC RATING
174th/ 347
METRIC RANK
12.7%
FEMALE DISABILITY
1.1/ 100
METRIC RATING
257th/ 347
METRIC RANK
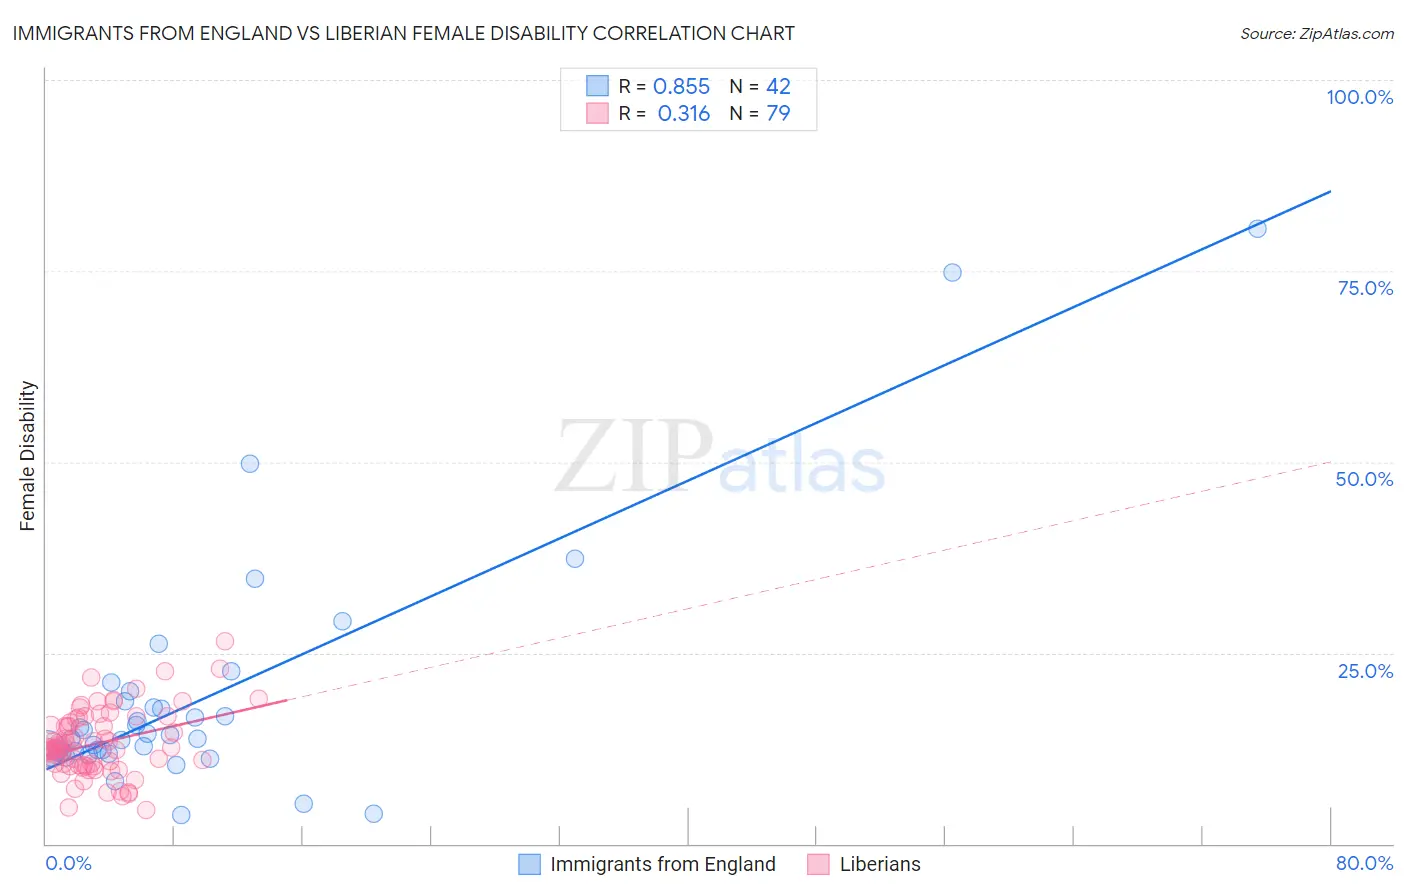
Immigrants from England vs Liberian Female Disability Correlation Chart
The statistical analysis conducted on geographies consisting of 391,881,475 people shows a very strong positive correlation between the proportion of Immigrants from England and percentage of females with a disability in the United States with a correlation coefficient (R) of 0.855 and weighted average of 12.2%. Similarly, the statistical analysis conducted on geographies consisting of 118,083,063 people shows a mild positive correlation between the proportion of Liberians and percentage of females with a disability in the United States with a correlation coefficient (R) of 0.316 and weighted average of 12.7%, a difference of 4.2%.
Female Disability Correlation Summary
| Measurement | Immigrants from England | Liberian |
| Minimum | 3.8% | 4.4% |
| Maximum | 80.5% | 26.5% |
| Range | 76.6% | 22.2% |
| Mean | 19.1% | 13.1% |
| Median | 14.0% | 12.5% |
| Interquartile 25% (IQ1) | 11.9% | 10.3% |
| Interquartile 75% (IQ3) | 18.7% | 15.9% |
| Interquartile Range (IQR) | 6.8% | 5.6% |
| Standard Deviation (Sample) | 15.8% | 4.3% |
| Standard Deviation (Population) | 15.6% | 4.3% |
Similar Demographics by Female Disability
Demographics Similar to Immigrants from England by Female Disability
In terms of female disability, the demographic groups most similar to Immigrants from England are Immigrants from St. Vincent and the Grenadines (12.2%, a difference of 0.010%), Immigrants from Mexico (12.2%, a difference of 0.030%), Haitian (12.2%, a difference of 0.070%), Immigrants from Southern Europe (12.2%, a difference of 0.24%), and Maltese (12.2%, a difference of 0.26%).
| Demographics | Rating | Rank | Female Disability |
| Immigrants | Latin America | 59.0 /100 | #167 | Average 12.2% |
| Immigrants | Haiti | 58.8 /100 | #168 | Average 12.2% |
| Lebanese | 58.1 /100 | #169 | Average 12.2% |
| Maltese | 57.0 /100 | #170 | Average 12.2% |
| Immigrants | Southern Europe | 56.3 /100 | #171 | Average 12.2% |
| Haitians | 51.9 /100 | #172 | Average 12.2% |
| Immigrants | Mexico | 50.8 /100 | #173 | Average 12.2% |
| Immigrants | England | 50.0 /100 | #174 | Average 12.2% |
| Immigrants | St. Vincent and the Grenadines | 49.7 /100 | #175 | Average 12.2% |
| Immigrants | Guyana | 43.1 /100 | #176 | Average 12.2% |
| Immigrants | Ghana | 42.5 /100 | #177 | Average 12.2% |
| Immigrants | Western Europe | 40.9 /100 | #178 | Average 12.2% |
| Immigrants | Fiji | 38.2 /100 | #179 | Fair 12.3% |
| Albanians | 37.9 /100 | #180 | Fair 12.3% |
| Immigrants | Canada | 37.2 /100 | #181 | Fair 12.3% |
Demographics Similar to Liberians by Female Disability
In terms of female disability, the demographic groups most similar to Liberians are Aleut (12.7%, a difference of 0.0%), British West Indian (12.7%, a difference of 0.030%), Immigrants from Armenia (12.7%, a difference of 0.080%), Immigrants from Germany (12.7%, a difference of 0.10%), and Subsaharan African (12.7%, a difference of 0.10%).
| Demographics | Rating | Rank | Female Disability |
| Slovenes | 1.7 /100 | #250 | Tragic 12.7% |
| Crow | 1.6 /100 | #251 | Tragic 12.7% |
| Immigrants | Caribbean | 1.4 /100 | #252 | Tragic 12.7% |
| Jamaicans | 1.4 /100 | #253 | Tragic 12.7% |
| Hawaiians | 1.4 /100 | #254 | Tragic 12.7% |
| Immigrants | Germany | 1.3 /100 | #255 | Tragic 12.7% |
| British West Indians | 1.2 /100 | #256 | Tragic 12.7% |
| Liberians | 1.1 /100 | #257 | Tragic 12.7% |
| Aleuts | 1.1 /100 | #258 | Tragic 12.7% |
| Immigrants | Armenia | 1.0 /100 | #259 | Tragic 12.7% |
| Sub-Saharan Africans | 1.0 /100 | #260 | Tragic 12.7% |
| Bermudans | 1.0 /100 | #261 | Tragic 12.7% |
| Czechoslovakians | 0.9 /100 | #262 | Tragic 12.7% |
| Spaniards | 0.7 /100 | #263 | Tragic 12.8% |
| Alaska Natives | 0.6 /100 | #264 | Tragic 12.8% |