Immigrants from Eastern Europe vs Costa Rican Disability Age 65 to 74
COMPARE
Immigrants from Eastern Europe
Costa Rican
Disability Age 65 to 74
Disability Age 65 to 74 Comparison
Immigrants from Eastern Europe
Costa Ricans
21.8%
DISABILITY AGE 65 TO 74
99.0/ 100
METRIC RATING
78th/ 347
METRIC RANK
22.6%
DISABILITY AGE 65 TO 74
89.2/ 100
METRIC RATING
132nd/ 347
METRIC RANK
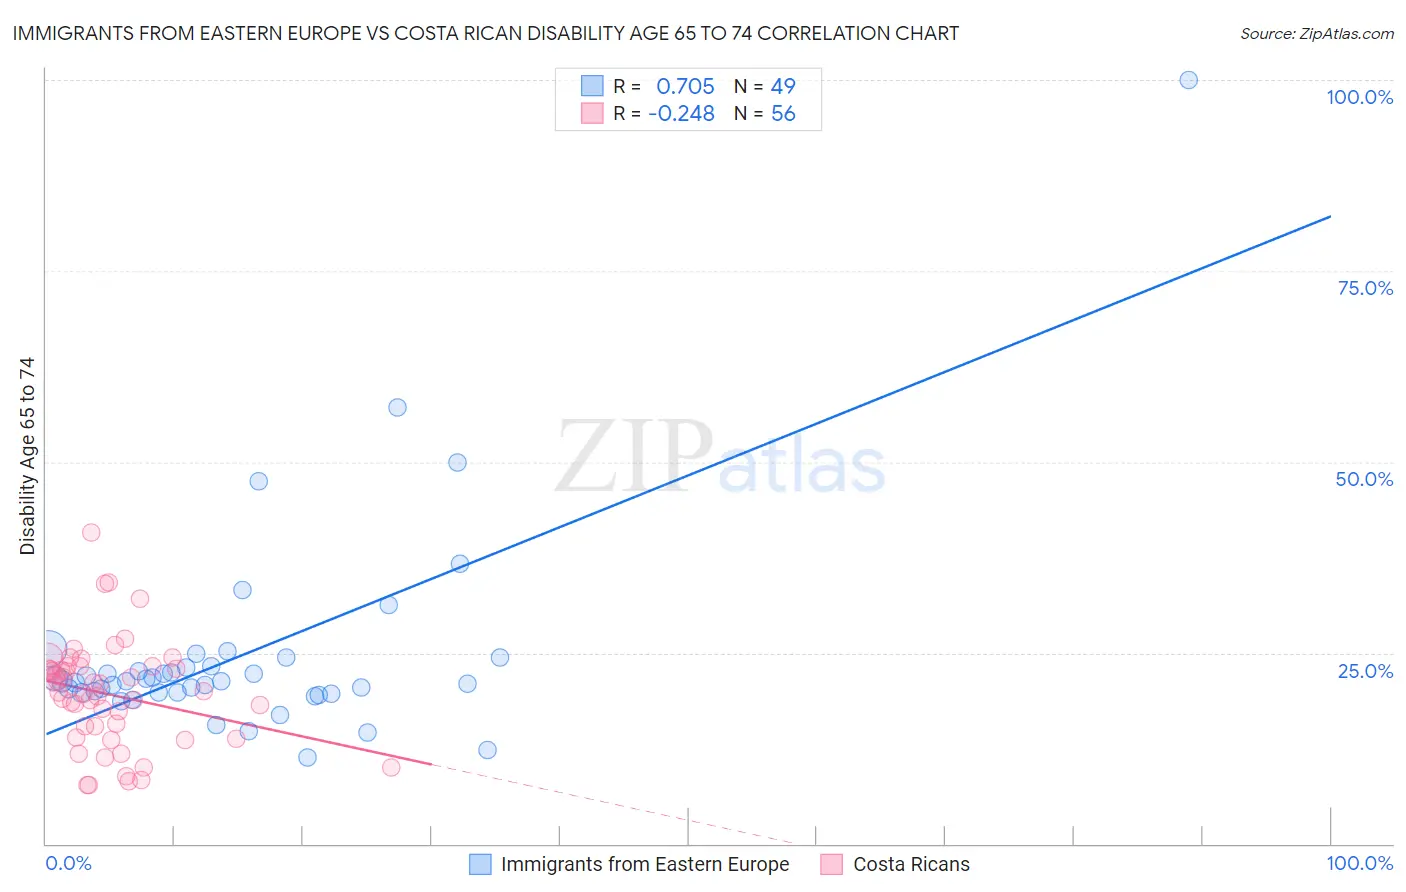
Immigrants from Eastern Europe vs Costa Rican Disability Age 65 to 74 Correlation Chart
The statistical analysis conducted on geographies consisting of 474,651,194 people shows a strong positive correlation between the proportion of Immigrants from Eastern Europe and percentage of population with a disability between the ages 65 and 75 in the United States with a correlation coefficient (R) of 0.705 and weighted average of 21.8%. Similarly, the statistical analysis conducted on geographies consisting of 253,274,171 people shows a weak negative correlation between the proportion of Costa Ricans and percentage of population with a disability between the ages 65 and 75 in the United States with a correlation coefficient (R) of -0.248 and weighted average of 22.6%, a difference of 3.8%.
Disability Age 65 to 74 Correlation Summary
| Measurement | Immigrants from Eastern Europe | Costa Rican |
| Minimum | 11.2% | 7.7% |
| Maximum | 100.0% | 40.7% |
| Range | 88.8% | 33.1% |
| Mean | 24.8% | 19.6% |
| Median | 21.3% | 19.9% |
| Interquartile 25% (IQ1) | 19.7% | 14.7% |
| Interquartile 75% (IQ3) | 23.8% | 23.0% |
| Interquartile Range (IQR) | 4.1% | 8.4% |
| Standard Deviation (Sample) | 13.9% | 6.9% |
| Standard Deviation (Population) | 13.8% | 6.8% |
Similar Demographics by Disability Age 65 to 74
Demographics Similar to Immigrants from Eastern Europe by Disability Age 65 to 74
In terms of disability age 65 to 74, the demographic groups most similar to Immigrants from Eastern Europe are Venezuelan (21.8%, a difference of 0.0%), Immigrants from Norway (21.8%, a difference of 0.020%), Immigrants from Poland (21.8%, a difference of 0.060%), Croatian (21.8%, a difference of 0.080%), and Greek (21.8%, a difference of 0.11%).
| Demographics | Rating | Rank | Disability Age 65 to 74 |
| Immigrants | Belarus | 99.2 /100 | #71 | Exceptional 21.7% |
| Immigrants | Hungary | 99.2 /100 | #72 | Exceptional 21.7% |
| Immigrants | Venezuela | 99.0 /100 | #73 | Exceptional 21.8% |
| Cambodians | 99.0 /100 | #74 | Exceptional 21.8% |
| Mongolians | 99.0 /100 | #75 | Exceptional 21.8% |
| Greeks | 99.0 /100 | #76 | Exceptional 21.8% |
| Immigrants | Poland | 99.0 /100 | #77 | Exceptional 21.8% |
| Immigrants | Eastern Europe | 99.0 /100 | #78 | Exceptional 21.8% |
| Venezuelans | 99.0 /100 | #79 | Exceptional 21.8% |
| Immigrants | Norway | 98.9 /100 | #80 | Exceptional 21.8% |
| Croatians | 98.9 /100 | #81 | Exceptional 21.8% |
| Immigrants | Indonesia | 98.7 /100 | #82 | Exceptional 21.9% |
| Immigrants | Brazil | 98.5 /100 | #83 | Exceptional 21.9% |
| Immigrants | Spain | 98.5 /100 | #84 | Exceptional 21.9% |
| Immigrants | Lebanon | 98.4 /100 | #85 | Exceptional 21.9% |
Demographics Similar to Costa Ricans by Disability Age 65 to 74
In terms of disability age 65 to 74, the demographic groups most similar to Costa Ricans are Immigrants from Nepal (22.6%, a difference of 0.040%), Northern European (22.6%, a difference of 0.050%), Afghan (22.6%, a difference of 0.10%), Immigrants from Albania (22.6%, a difference of 0.13%), and Immigrants from Ukraine (22.6%, a difference of 0.13%).
| Demographics | Rating | Rank | Disability Age 65 to 74 |
| Immigrants | Western Europe | 92.3 /100 | #125 | Exceptional 22.5% |
| Lebanese | 92.2 /100 | #126 | Exceptional 22.5% |
| Slovaks | 91.6 /100 | #127 | Exceptional 22.5% |
| Immigrants | Costa Rica | 90.4 /100 | #128 | Exceptional 22.6% |
| Immigrants | Uruguay | 90.1 /100 | #129 | Exceptional 22.6% |
| Immigrants | Albania | 90.0 /100 | #130 | Excellent 22.6% |
| Immigrants | Nepal | 89.4 /100 | #131 | Excellent 22.6% |
| Costa Ricans | 89.2 /100 | #132 | Excellent 22.6% |
| Northern Europeans | 88.9 /100 | #133 | Excellent 22.6% |
| Afghans | 88.6 /100 | #134 | Excellent 22.6% |
| Immigrants | Ukraine | 88.4 /100 | #135 | Excellent 22.6% |
| Ethiopians | 87.9 /100 | #136 | Excellent 22.7% |
| Taiwanese | 87.6 /100 | #137 | Excellent 22.7% |
| Immigrants | Moldova | 87.3 /100 | #138 | Excellent 22.7% |
| Immigrants | Syria | 85.8 /100 | #139 | Excellent 22.7% |