Immigrants from Congo vs Scotch-Irish Disability Age 18 to 34
COMPARE
Immigrants from Congo
Scotch-Irish
Disability Age 18 to 34
Disability Age 18 to 34 Comparison
Immigrants from Congo
Scotch-Irish
7.1%
DISABILITY AGE 18 TO 34
1.1/ 100
METRIC RATING
242nd/ 347
METRIC RANK
7.8%
DISABILITY AGE 18 TO 34
0.0/ 100
METRIC RATING
307th/ 347
METRIC RANK
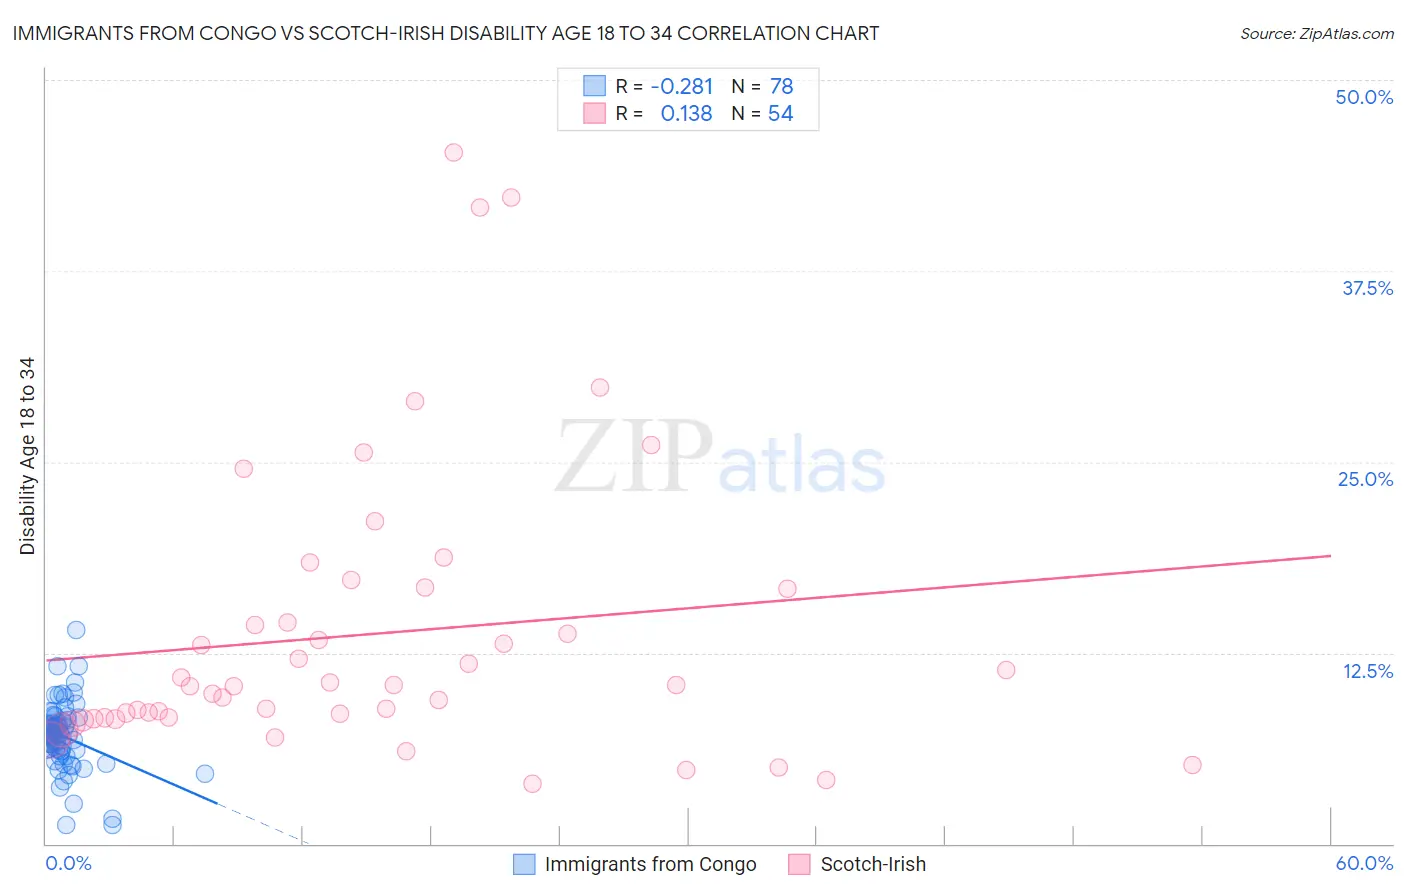
Immigrants from Congo vs Scotch-Irish Disability Age 18 to 34 Correlation Chart
The statistical analysis conducted on geographies consisting of 92,094,835 people shows a weak negative correlation between the proportion of Immigrants from Congo and percentage of population with a disability between the ages 18 and 35 in the United States with a correlation coefficient (R) of -0.281 and weighted average of 7.1%. Similarly, the statistical analysis conducted on geographies consisting of 544,079,261 people shows a poor positive correlation between the proportion of Scotch-Irish and percentage of population with a disability between the ages 18 and 35 in the United States with a correlation coefficient (R) of 0.138 and weighted average of 7.8%, a difference of 9.7%.
Disability Age 18 to 34 Correlation Summary
| Measurement | Immigrants from Congo | Scotch-Irish |
| Minimum | 1.2% | 3.9% |
| Maximum | 14.0% | 45.2% |
| Range | 12.8% | 41.3% |
| Mean | 7.0% | 13.7% |
| Median | 7.2% | 10.4% |
| Interquartile 25% (IQ1) | 6.1% | 8.2% |
| Interquartile 75% (IQ3) | 7.9% | 16.7% |
| Interquartile Range (IQR) | 1.8% | 8.4% |
| Standard Deviation (Sample) | 2.1% | 9.4% |
| Standard Deviation (Population) | 2.1% | 9.4% |
Similar Demographics by Disability Age 18 to 34
Demographics Similar to Immigrants from Congo by Disability Age 18 to 34
In terms of disability age 18 to 34, the demographic groups most similar to Immigrants from Congo are Nepalese (7.1%, a difference of 0.040%), Arapaho (7.1%, a difference of 0.050%), Icelander (7.1%, a difference of 0.070%), Italian (7.1%, a difference of 0.16%), and Immigrants from Zaire (7.1%, a difference of 0.27%).
| Demographics | Rating | Rank | Disability Age 18 to 34 |
| Sub-Saharan Africans | 1.7 /100 | #235 | Tragic 7.1% |
| Liberians | 1.5 /100 | #236 | Tragic 7.1% |
| Austrians | 1.3 /100 | #237 | Tragic 7.1% |
| Marshallese | 1.3 /100 | #238 | Tragic 7.1% |
| Italians | 1.2 /100 | #239 | Tragic 7.1% |
| Arapaho | 1.1 /100 | #240 | Tragic 7.1% |
| Nepalese | 1.1 /100 | #241 | Tragic 7.1% |
| Immigrants | Congo | 1.1 /100 | #242 | Tragic 7.1% |
| Icelanders | 1.0 /100 | #243 | Tragic 7.1% |
| Immigrants | Zaire | 0.9 /100 | #244 | Tragic 7.1% |
| Hungarians | 0.9 /100 | #245 | Tragic 7.1% |
| Immigrants | Liberia | 0.8 /100 | #246 | Tragic 7.1% |
| Yugoslavians | 0.8 /100 | #247 | Tragic 7.2% |
| Guamanians/Chamorros | 0.8 /100 | #248 | Tragic 7.2% |
| Malaysians | 0.7 /100 | #249 | Tragic 7.2% |
Demographics Similar to Scotch-Irish by Disability Age 18 to 34
In terms of disability age 18 to 34, the demographic groups most similar to Scotch-Irish are Pennsylvania German (7.8%, a difference of 0.030%), Alaska Native (7.8%, a difference of 0.040%), Finnish (7.8%, a difference of 0.10%), English (7.8%, a difference of 0.26%), and Menominee (7.8%, a difference of 0.34%).
| Demographics | Rating | Rank | Disability Age 18 to 34 |
| Scottish | 0.0 /100 | #300 | Tragic 7.7% |
| Pima | 0.0 /100 | #301 | Tragic 7.7% |
| Welsh | 0.0 /100 | #302 | Tragic 7.7% |
| Cheyenne | 0.0 /100 | #303 | Tragic 7.7% |
| Shoshone | 0.0 /100 | #304 | Tragic 7.8% |
| Menominee | 0.0 /100 | #305 | Tragic 7.8% |
| English | 0.0 /100 | #306 | Tragic 7.8% |
| Scotch-Irish | 0.0 /100 | #307 | Tragic 7.8% |
| Pennsylvania Germans | 0.0 /100 | #308 | Tragic 7.8% |
| Alaska Natives | 0.0 /100 | #309 | Tragic 7.8% |
| Finns | 0.0 /100 | #310 | Tragic 7.8% |
| French | 0.0 /100 | #311 | Tragic 7.9% |
| Spanish Americans | 0.0 /100 | #312 | Tragic 7.9% |
| Iroquois | 0.0 /100 | #313 | Tragic 7.9% |
| Colville | 0.0 /100 | #314 | Tragic 7.9% |