Immigrants from Caribbean vs Central American Indian Disability Age 18 to 34
COMPARE
Immigrants from Caribbean
Central American Indian
Disability Age 18 to 34
Disability Age 18 to 34 Comparison
Immigrants from Caribbean
Central American Indians
6.0%
DISABILITY AGE 18 TO 34
99.6/ 100
METRIC RATING
59th/ 347
METRIC RANK
6.9%
DISABILITY AGE 18 TO 34
4.7/ 100
METRIC RATING
225th/ 347
METRIC RANK
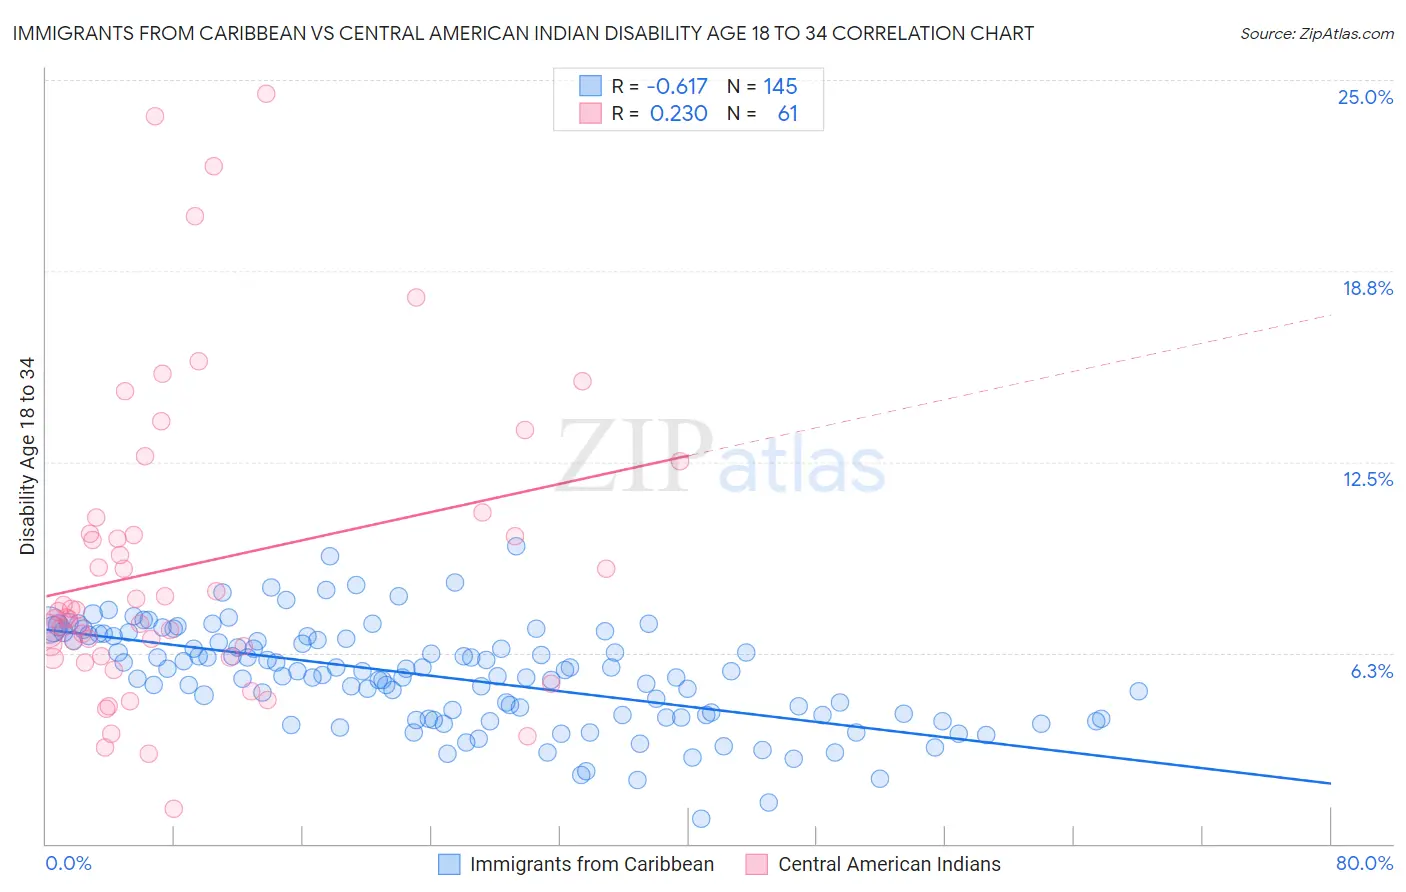
Immigrants from Caribbean vs Central American Indian Disability Age 18 to 34 Correlation Chart
The statistical analysis conducted on geographies consisting of 448,580,700 people shows a significant negative correlation between the proportion of Immigrants from Caribbean and percentage of population with a disability between the ages 18 and 35 in the United States with a correlation coefficient (R) of -0.617 and weighted average of 6.0%. Similarly, the statistical analysis conducted on geographies consisting of 325,794,306 people shows a weak positive correlation between the proportion of Central American Indians and percentage of population with a disability between the ages 18 and 35 in the United States with a correlation coefficient (R) of 0.230 and weighted average of 6.9%, a difference of 16.6%.
Disability Age 18 to 34 Correlation Summary
| Measurement | Immigrants from Caribbean | Central American Indian |
| Minimum | 0.83% | 1.1% |
| Maximum | 9.7% | 24.6% |
| Range | 8.9% | 23.4% |
| Mean | 5.5% | 9.1% |
| Median | 5.6% | 7.6% |
| Interquartile 25% (IQ1) | 4.2% | 6.1% |
| Interquartile 75% (IQ3) | 6.8% | 10.4% |
| Interquartile Range (IQR) | 2.6% | 4.3% |
| Standard Deviation (Sample) | 1.6% | 5.0% |
| Standard Deviation (Population) | 1.6% | 5.0% |
Similar Demographics by Disability Age 18 to 34
Demographics Similar to Immigrants from Caribbean by Disability Age 18 to 34
In terms of disability age 18 to 34, the demographic groups most similar to Immigrants from Caribbean are Immigrants from Sri Lanka (6.0%, a difference of 0.0%), Immigrants from Serbia (5.9%, a difference of 0.14%), Immigrants from Haiti (5.9%, a difference of 0.16%), British West Indian (6.0%, a difference of 0.26%), and Paraguayan (5.9%, a difference of 0.27%).
| Demographics | Rating | Rank | Disability Age 18 to 34 |
| Okinawans | 99.7 /100 | #52 | Exceptional 5.9% |
| Immigrants | Indonesia | 99.7 /100 | #53 | Exceptional 5.9% |
| Immigrants | Malaysia | 99.7 /100 | #54 | Exceptional 5.9% |
| Immigrants | Spain | 99.7 /100 | #55 | Exceptional 5.9% |
| Paraguayans | 99.7 /100 | #56 | Exceptional 5.9% |
| Immigrants | Haiti | 99.7 /100 | #57 | Exceptional 5.9% |
| Immigrants | Serbia | 99.7 /100 | #58 | Exceptional 5.9% |
| Immigrants | Caribbean | 99.6 /100 | #59 | Exceptional 6.0% |
| Immigrants | Sri Lanka | 99.6 /100 | #60 | Exceptional 6.0% |
| British West Indians | 99.6 /100 | #61 | Exceptional 6.0% |
| Peruvians | 99.6 /100 | #62 | Exceptional 6.0% |
| Salvadorans | 99.6 /100 | #63 | Exceptional 6.0% |
| Taiwanese | 99.6 /100 | #64 | Exceptional 6.0% |
| Trinidadians and Tobagonians | 99.5 /100 | #65 | Exceptional 6.0% |
| Burmese | 99.5 /100 | #66 | Exceptional 6.0% |
Demographics Similar to Central American Indians by Disability Age 18 to 34
In terms of disability age 18 to 34, the demographic groups most similar to Central American Indians are Senegalese (6.9%, a difference of 0.090%), Ugandan (6.9%, a difference of 0.11%), Immigrants from Canada (7.0%, a difference of 0.15%), Carpatho Rusyn (6.9%, a difference of 0.17%), and Immigrants from England (6.9%, a difference of 0.20%).
| Demographics | Rating | Rank | Disability Age 18 to 34 |
| Ukrainians | 6.7 /100 | #218 | Tragic 6.9% |
| Hawaiians | 6.5 /100 | #219 | Tragic 6.9% |
| Immigrants | Senegal | 5.5 /100 | #220 | Tragic 6.9% |
| Immigrants | Middle Africa | 5.5 /100 | #221 | Tragic 6.9% |
| Immigrants | England | 5.3 /100 | #222 | Tragic 6.9% |
| Carpatho Rusyns | 5.2 /100 | #223 | Tragic 6.9% |
| Senegalese | 4.9 /100 | #224 | Tragic 6.9% |
| Central American Indians | 4.7 /100 | #225 | Tragic 6.9% |
| Ugandans | 4.4 /100 | #226 | Tragic 6.9% |
| Immigrants | Canada | 4.3 /100 | #227 | Tragic 7.0% |
| Immigrants | Yemen | 4.2 /100 | #228 | Tragic 7.0% |
| Lithuanians | 4.1 /100 | #229 | Tragic 7.0% |
| Immigrants | North America | 3.9 /100 | #230 | Tragic 7.0% |
| Ute | 3.8 /100 | #231 | Tragic 7.0% |
| Samoans | 3.2 /100 | #232 | Tragic 7.0% |