Immigrants from Bulgaria vs Slovene Hearing Disability
COMPARE
Immigrants from Bulgaria
Slovene
Hearing Disability
Hearing Disability Comparison
Immigrants from Bulgaria
Slovenes
2.9%
HEARING DISABILITY
79.2/ 100
METRIC RATING
144th/ 347
METRIC RANK
3.5%
HEARING DISABILITY
0.1/ 100
METRIC RATING
259th/ 347
METRIC RANK
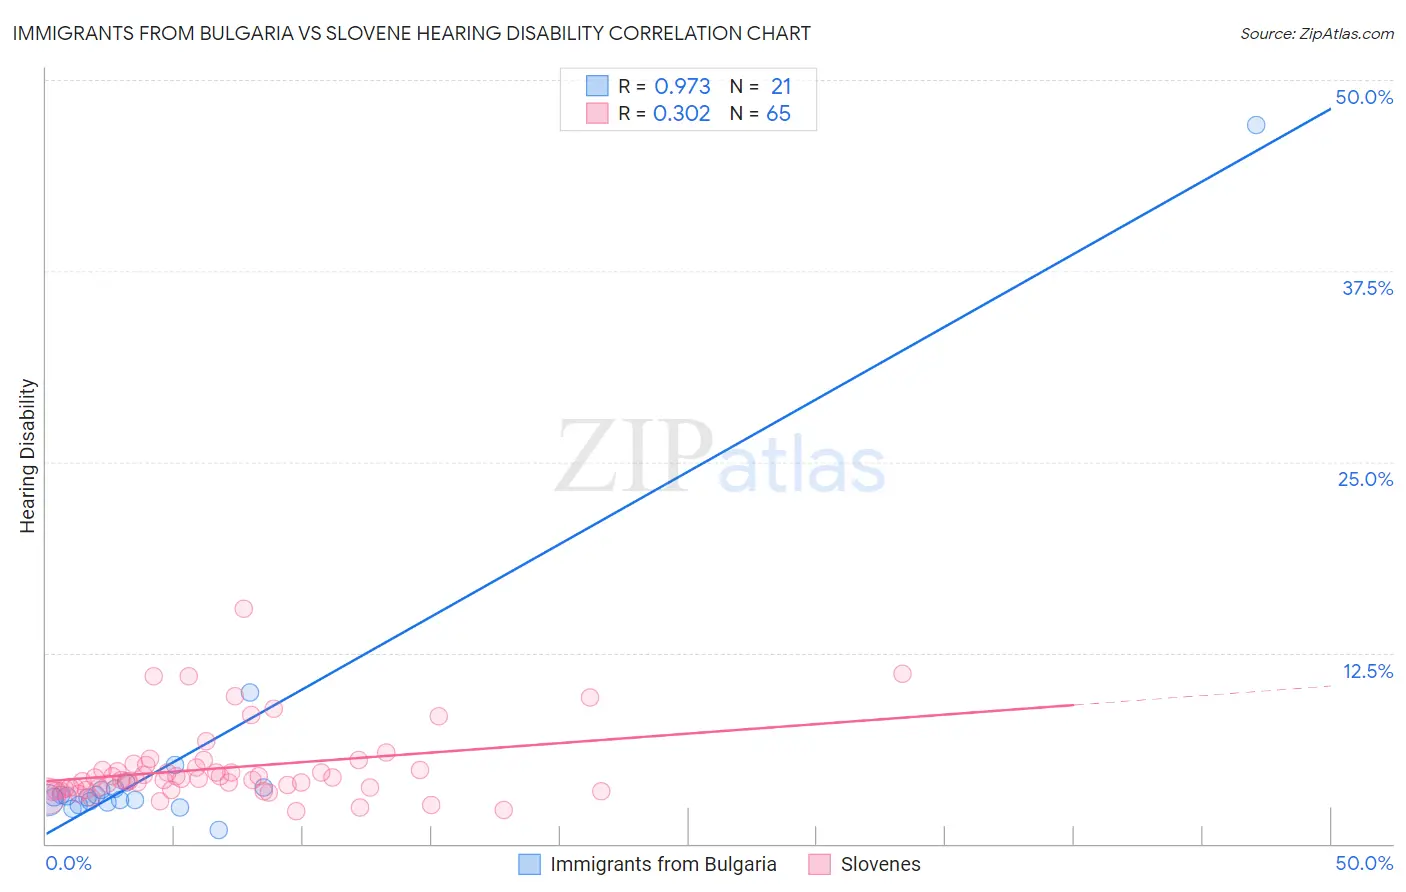
Immigrants from Bulgaria vs Slovene Hearing Disability Correlation Chart
The statistical analysis conducted on geographies consisting of 172,536,031 people shows a perfect positive correlation between the proportion of Immigrants from Bulgaria and percentage of population with hearing disability in the United States with a correlation coefficient (R) of 0.973 and weighted average of 2.9%. Similarly, the statistical analysis conducted on geographies consisting of 261,288,798 people shows a mild positive correlation between the proportion of Slovenes and percentage of population with hearing disability in the United States with a correlation coefficient (R) of 0.302 and weighted average of 3.5%, a difference of 19.1%.
Hearing Disability Correlation Summary
| Measurement | Immigrants from Bulgaria | Slovene |
| Minimum | 0.89% | 2.2% |
| Maximum | 47.1% | 15.4% |
| Range | 46.2% | 13.2% |
| Mean | 5.5% | 5.0% |
| Median | 3.1% | 4.3% |
| Interquartile 25% (IQ1) | 2.8% | 3.6% |
| Interquartile 75% (IQ3) | 3.6% | 5.1% |
| Interquartile Range (IQR) | 0.89% | 1.5% |
| Standard Deviation (Sample) | 9.7% | 2.5% |
| Standard Deviation (Population) | 9.4% | 2.4% |
Similar Demographics by Hearing Disability
Demographics Similar to Immigrants from Bulgaria by Hearing Disability
In terms of hearing disability, the demographic groups most similar to Immigrants from Bulgaria are Immigrants from Congo (2.9%, a difference of 0.050%), Brazilian (2.9%, a difference of 0.070%), Tongan (2.9%, a difference of 0.080%), Immigrants from Russia (2.9%, a difference of 0.21%), and Immigrants from Bahamas (2.9%, a difference of 0.27%).
| Demographics | Rating | Rank | Hearing Disability |
| Sri Lankans | 84.1 /100 | #137 | Excellent 2.9% |
| Immigrants | Costa Rica | 84.0 /100 | #138 | Excellent 2.9% |
| Bermudans | 83.8 /100 | #139 | Excellent 2.9% |
| Immigrants | Jordan | 83.7 /100 | #140 | Excellent 2.9% |
| Sub-Saharan Africans | 83.3 /100 | #141 | Excellent 2.9% |
| Laotians | 81.1 /100 | #142 | Excellent 2.9% |
| Immigrants | Bahamas | 80.9 /100 | #143 | Excellent 2.9% |
| Immigrants | Bulgaria | 79.2 /100 | #144 | Good 2.9% |
| Immigrants | Congo | 78.9 /100 | #145 | Good 2.9% |
| Brazilians | 78.7 /100 | #146 | Good 2.9% |
| Tongans | 78.6 /100 | #147 | Good 2.9% |
| Immigrants | Russia | 77.7 /100 | #148 | Good 2.9% |
| Immigrants | Panama | 76.9 /100 | #149 | Good 2.9% |
| Palestinians | 73.6 /100 | #150 | Good 2.9% |
| Immigrants | France | 73.1 /100 | #151 | Good 2.9% |
Demographics Similar to Slovenes by Hearing Disability
In terms of hearing disability, the demographic groups most similar to Slovenes are Portuguese (3.5%, a difference of 0.080%), Hawaiian (3.5%, a difference of 0.11%), Immigrants from North America (3.5%, a difference of 0.23%), Northern European (3.4%, a difference of 0.24%), and Immigrants from Canada (3.5%, a difference of 0.27%).
| Demographics | Rating | Rank | Hearing Disability |
| Croatians | 0.4 /100 | #252 | Tragic 3.4% |
| Carpatho Rusyns | 0.3 /100 | #253 | Tragic 3.4% |
| Slavs | 0.2 /100 | #254 | Tragic 3.4% |
| Poles | 0.2 /100 | #255 | Tragic 3.4% |
| Hmong | 0.2 /100 | #256 | Tragic 3.4% |
| Yaqui | 0.2 /100 | #257 | Tragic 3.4% |
| Northern Europeans | 0.2 /100 | #258 | Tragic 3.4% |
| Slovenes | 0.1 /100 | #259 | Tragic 3.5% |
| Portuguese | 0.1 /100 | #260 | Tragic 3.5% |
| Hawaiians | 0.1 /100 | #261 | Tragic 3.5% |
| Immigrants | North America | 0.1 /100 | #262 | Tragic 3.5% |
| Immigrants | Canada | 0.1 /100 | #263 | Tragic 3.5% |
| Immigrants | Germany | 0.1 /100 | #264 | Tragic 3.5% |
| British | 0.1 /100 | #265 | Tragic 3.5% |
| Belgians | 0.1 /100 | #266 | Tragic 3.5% |