Immigrants from Belgium vs Navajo Female Disability
COMPARE
Immigrants from Belgium
Navajo
Female Disability
Female Disability Comparison
Immigrants from Belgium
Navajo
11.3%
FEMALE DISABILITY
100.0/ 100
METRIC RATING
51st/ 347
METRIC RANK
14.2%
FEMALE DISABILITY
0.0/ 100
METRIC RATING
325th/ 347
METRIC RANK
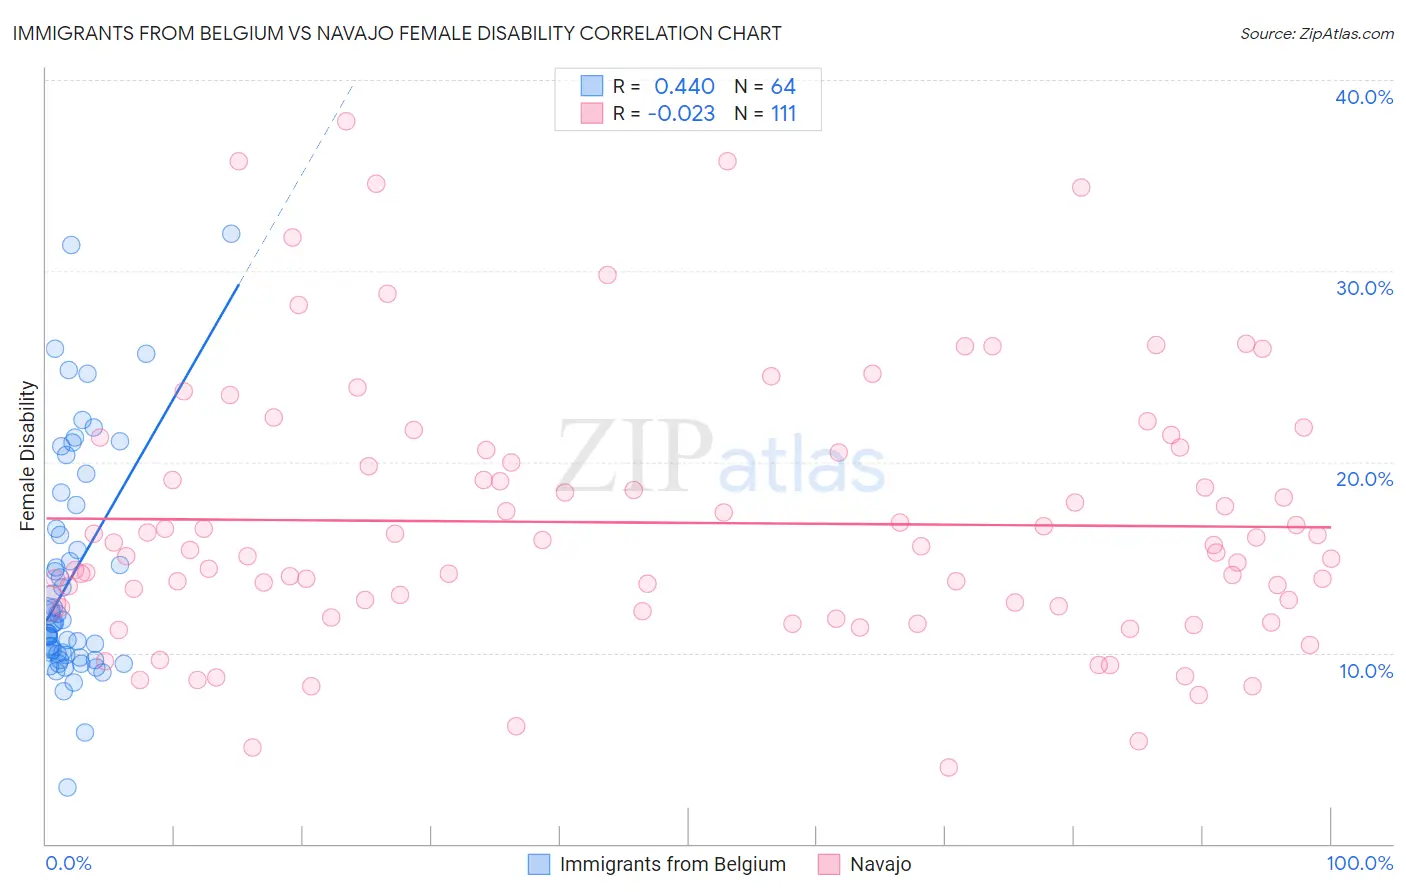
Immigrants from Belgium vs Navajo Female Disability Correlation Chart
The statistical analysis conducted on geographies consisting of 146,716,941 people shows a moderate positive correlation between the proportion of Immigrants from Belgium and percentage of females with a disability in the United States with a correlation coefficient (R) of 0.440 and weighted average of 11.3%. Similarly, the statistical analysis conducted on geographies consisting of 224,768,780 people shows no correlation between the proportion of Navajo and percentage of females with a disability in the United States with a correlation coefficient (R) of -0.023 and weighted average of 14.2%, a difference of 25.2%.
Female Disability Correlation Summary
| Measurement | Immigrants from Belgium | Navajo |
| Minimum | 2.9% | 4.0% |
| Maximum | 31.9% | 37.8% |
| Range | 29.0% | 33.8% |
| Mean | 14.0% | 16.8% |
| Median | 11.5% | 15.4% |
| Interquartile 25% (IQ1) | 9.9% | 12.5% |
| Interquartile 75% (IQ3) | 17.1% | 20.5% |
| Interquartile Range (IQR) | 7.2% | 8.0% |
| Standard Deviation (Sample) | 6.0% | 6.9% |
| Standard Deviation (Population) | 6.0% | 6.9% |
Similar Demographics by Female Disability
Demographics Similar to Immigrants from Belgium by Female Disability
In terms of female disability, the demographic groups most similar to Immigrants from Belgium are Inupiat (11.3%, a difference of 0.080%), Immigrants from Peru (11.3%, a difference of 0.12%), Immigrants from Saudi Arabia (11.3%, a difference of 0.16%), Peruvian (11.3%, a difference of 0.22%), and Bulgarian (11.3%, a difference of 0.24%).
| Demographics | Rating | Rank | Female Disability |
| Cambodians | 100.0 /100 | #44 | Exceptional 11.3% |
| Immigrants | Sweden | 100.0 /100 | #45 | Exceptional 11.3% |
| Immigrants | Nepal | 100.0 /100 | #46 | Exceptional 11.3% |
| Jordanians | 100.0 /100 | #47 | Exceptional 11.3% |
| Zimbabweans | 100.0 /100 | #48 | Exceptional 11.3% |
| Tongans | 100.0 /100 | #49 | Exceptional 11.3% |
| Inupiat | 100.0 /100 | #50 | Exceptional 11.3% |
| Immigrants | Belgium | 100.0 /100 | #51 | Exceptional 11.3% |
| Immigrants | Peru | 99.9 /100 | #52 | Exceptional 11.3% |
| Immigrants | Saudi Arabia | 99.9 /100 | #53 | Exceptional 11.3% |
| Peruvians | 99.9 /100 | #54 | Exceptional 11.3% |
| Bulgarians | 99.9 /100 | #55 | Exceptional 11.3% |
| Taiwanese | 99.9 /100 | #56 | Exceptional 11.4% |
| South Americans | 99.9 /100 | #57 | Exceptional 11.4% |
| Laotians | 99.9 /100 | #58 | Exceptional 11.4% |
Demographics Similar to Navajo by Female Disability
In terms of female disability, the demographic groups most similar to Navajo are Comanche (14.2%, a difference of 0.11%), Native/Alaskan (14.1%, a difference of 0.14%), Black/African American (14.1%, a difference of 0.16%), Pueblo (14.1%, a difference of 0.32%), and Potawatomi (14.1%, a difference of 0.33%).
| Demographics | Rating | Rank | Female Disability |
| Paiute | 0.0 /100 | #318 | Tragic 14.0% |
| Iroquois | 0.0 /100 | #319 | Tragic 14.0% |
| Americans | 0.0 /100 | #320 | Tragic 14.1% |
| Potawatomi | 0.0 /100 | #321 | Tragic 14.1% |
| Pueblo | 0.0 /100 | #322 | Tragic 14.1% |
| Blacks/African Americans | 0.0 /100 | #323 | Tragic 14.1% |
| Natives/Alaskans | 0.0 /100 | #324 | Tragic 14.1% |
| Navajo | 0.0 /100 | #325 | Tragic 14.2% |
| Comanche | 0.0 /100 | #326 | Tragic 14.2% |
| Ottawa | 0.0 /100 | #327 | Tragic 14.2% |
| Cape Verdeans | 0.0 /100 | #328 | Tragic 14.2% |
| Osage | 0.0 /100 | #329 | Tragic 14.3% |
| Yuman | 0.0 /100 | #330 | Tragic 14.5% |
| Immigrants | Cabo Verde | 0.0 /100 | #331 | Tragic 14.6% |
| Pima | 0.0 /100 | #332 | Tragic 14.8% |