Immigrants from Bangladesh vs Immigrants from Cambodia Disability Age 35 to 64
COMPARE
Immigrants from Bangladesh
Immigrants from Cambodia
Disability Age 35 to 64
Disability Age 35 to 64 Comparison
Immigrants from Bangladesh
Immigrants from Cambodia
10.9%
DISABILITY AGE 35 TO 64
85.6/ 100
METRIC RATING
145th/ 347
METRIC RANK
12.0%
DISABILITY AGE 35 TO 64
3.9/ 100
METRIC RATING
237th/ 347
METRIC RANK
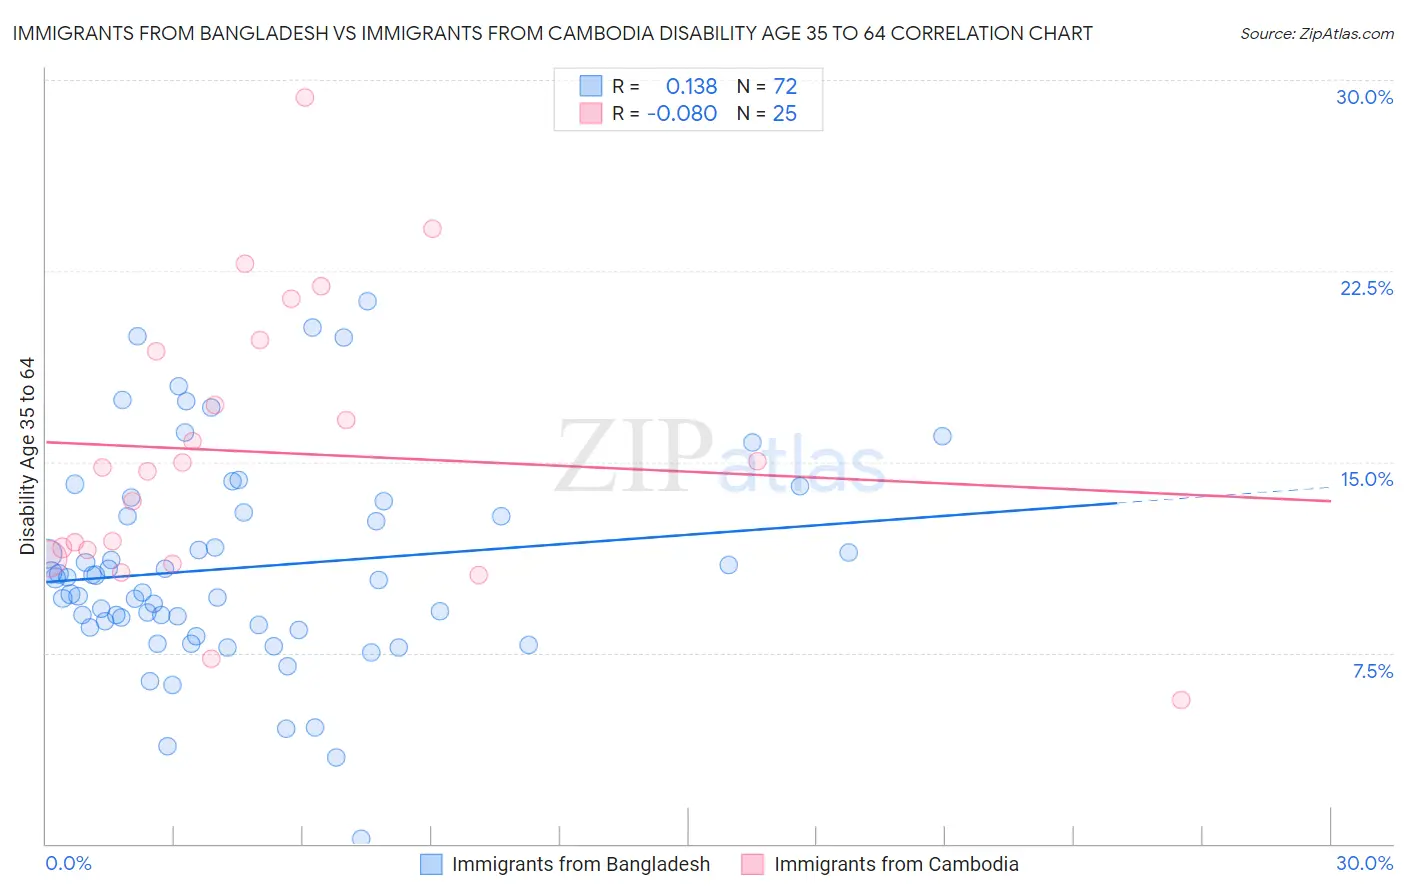
Immigrants from Bangladesh vs Immigrants from Cambodia Disability Age 35 to 64 Correlation Chart
The statistical analysis conducted on geographies consisting of 203,551,406 people shows a poor positive correlation between the proportion of Immigrants from Bangladesh and percentage of population with a disability between the ages 34 and 64 in the United States with a correlation coefficient (R) of 0.138 and weighted average of 10.9%. Similarly, the statistical analysis conducted on geographies consisting of 205,109,401 people shows a slight negative correlation between the proportion of Immigrants from Cambodia and percentage of population with a disability between the ages 34 and 64 in the United States with a correlation coefficient (R) of -0.080 and weighted average of 12.0%, a difference of 10.4%.
Disability Age 35 to 64 Correlation Summary
| Measurement | Immigrants from Bangladesh | Immigrants from Cambodia |
| Minimum | 0.20% | 5.7% |
| Maximum | 21.3% | 29.3% |
| Range | 21.1% | 23.6% |
| Mean | 10.9% | 15.4% |
| Median | 10.4% | 14.8% |
| Interquartile 25% (IQ1) | 8.5% | 11.4% |
| Interquartile 75% (IQ3) | 12.9% | 19.6% |
| Interquartile Range (IQR) | 4.4% | 8.2% |
| Standard Deviation (Sample) | 4.1% | 5.6% |
| Standard Deviation (Population) | 4.1% | 5.5% |
Similar Demographics by Disability Age 35 to 64
Demographics Similar to Immigrants from Bangladesh by Disability Age 35 to 64
In terms of disability age 35 to 64, the demographic groups most similar to Immigrants from Bangladesh are South American Indian (10.9%, a difference of 0.34%), Immigrants from Eritrea (10.9%, a difference of 0.36%), Arab (10.9%, a difference of 0.45%), Lithuanian (10.8%, a difference of 0.58%), and Immigrants from Cameroon (10.9%, a difference of 0.68%).
| Demographics | Rating | Rank | Disability Age 35 to 64 |
| Immigrants | Southern Europe | 91.5 /100 | #138 | Exceptional 10.7% |
| Costa Ricans | 91.4 /100 | #139 | Exceptional 10.7% |
| Immigrants | Scotland | 91.3 /100 | #140 | Exceptional 10.7% |
| Australians | 90.7 /100 | #141 | Exceptional 10.8% |
| Immigrants | Saudi Arabia | 90.6 /100 | #142 | Exceptional 10.8% |
| Sierra Leoneans | 89.7 /100 | #143 | Excellent 10.8% |
| Lithuanians | 88.7 /100 | #144 | Excellent 10.8% |
| Immigrants | Bangladesh | 85.6 /100 | #145 | Excellent 10.9% |
| South American Indians | 83.5 /100 | #146 | Excellent 10.9% |
| Immigrants | Eritrea | 83.4 /100 | #147 | Excellent 10.9% |
| Arabs | 82.7 /100 | #148 | Excellent 10.9% |
| Immigrants | Cameroon | 81.1 /100 | #149 | Excellent 10.9% |
| Syrians | 79.8 /100 | #150 | Good 11.0% |
| New Zealanders | 79.3 /100 | #151 | Good 11.0% |
| Ukrainians | 78.0 /100 | #152 | Good 11.0% |
Demographics Similar to Immigrants from Cambodia by Disability Age 35 to 64
In terms of disability age 35 to 64, the demographic groups most similar to Immigrants from Cambodia are West Indian (12.0%, a difference of 0.10%), Immigrants from Middle Africa (12.0%, a difference of 0.26%), Belizean (12.0%, a difference of 0.28%), Immigrants from Western Africa (12.0%, a difference of 0.36%), and Immigrants from Thailand (12.0%, a difference of 0.37%).
| Demographics | Rating | Rank | Disability Age 35 to 64 |
| Panamanians | 5.8 /100 | #230 | Tragic 11.9% |
| Jamaicans | 5.7 /100 | #231 | Tragic 11.9% |
| Sudanese | 5.3 /100 | #232 | Tragic 11.9% |
| Bermudans | 5.0 /100 | #233 | Tragic 11.9% |
| Portuguese | 4.9 /100 | #234 | Tragic 11.9% |
| Belizeans | 4.5 /100 | #235 | Tragic 12.0% |
| Immigrants | Middle Africa | 4.5 /100 | #236 | Tragic 12.0% |
| Immigrants | Cambodia | 3.9 /100 | #237 | Tragic 12.0% |
| West Indians | 3.7 /100 | #238 | Tragic 12.0% |
| Immigrants | Western Africa | 3.3 /100 | #239 | Tragic 12.0% |
| Immigrants | Thailand | 3.3 /100 | #240 | Tragic 12.0% |
| Mexican American Indians | 3.2 /100 | #241 | Tragic 12.0% |
| Samoans | 2.8 /100 | #242 | Tragic 12.1% |
| Slovaks | 2.7 /100 | #243 | Tragic 12.1% |
| Finns | 2.3 /100 | #244 | Tragic 12.1% |