Immigrants from Australia vs Dominican Disability Age 35 to 64

COMPARE

Immigrants from Australia
Race
Ancestry
AfghanAfricanAlaska NativeAlaskan AthabascanAlbanianAleutAlsatianAmericanApacheArabArapahoArgentineanArmenianAssyrian/Chaldean/SyriacAustralianAustrianBahamianBangladeshiBarbadianBasqueBelgianBelizeanBermudanBhutaneseBlackfeetBolivianBrazilianBritishBritish West IndianBulgarianBurmeseCajunCambodianCanadianCape VerdeanCarpatho RusynCelticCentral AmericanCentral American IndianCherokeeCheyenneChickasawChileanChineseChippewaChoctawColombianColvilleComancheCosta RicanCreeCreekCroatianCrowCubanCypriotCzechCzechoslovakianDanishDelawareDutchDutch West IndianEastern EuropeanEcuadorianEgyptianEnglishEstonianEthiopianEuropeanFijianFilipinoFinnishFrenchFrench American IndianFrench CanadianGermanGerman RussianGhanaianGreekGuamanian/ChamorroGuatemalanGuyaneseHaitianHmongHonduranHopiHoumaHungarianIcelanderIndian (Asian)IndonesianInupiatIranianIraqiIrishIroquoisIsraeliItalianJamaicanJapaneseJordanianKenyanKiowaKoreanLaotianLatvianLebaneseLiberianLithuanianLumbeeLuxembourgerMacedonianMalaysianMalteseMarshalleseMenomineeMexicanMexican American IndianMongolianMoroccanNative HawaiianNavajoNepaleseNew ZealanderNicaraguanNigerianNorthern EuropeanNorwegianOkinawanOsageOttawaPaiutePakistaniPalestinianPanamanianParaguayanPennsylvania GermanPeruvianPimaPolishPortuguesePotawatomiPuebloPuerto RicanPuget Sound SalishRomanianRussianSalvadoranSamoanScandinavianScotch-IrishScottishSeminoleSenegaleseSerbianShoshoneSierra LeoneanSiouxSlavicSlovakSloveneSomaliSouth AfricanSouth AmericanSouth American IndianSoviet UnionSpaniardSpanishSpanish AmericanSpanish American IndianSri LankanSubsaharan AfricanSudaneseSwedishSwissSyrianTaiwaneseThaiTlingit-HaidaTohono O'OdhamTonganTrinidadian and TobagonianTsimshianTurkishU.S. Virgin IslanderUgandanUkrainianUruguayanUteVenezuelanVietnameseWelshWest IndianYakamaYaquiYugoslavianYumanYup'ikZimbabwean
Immigration
NonimmigrantsImmigrantsAfghanistanAfricaAlbaniaArgentinaArmeniaAsiaAustraliaAustriaBahamasBangladeshBarbadosBelarusBelgiumBelizeBoliviaBosnia and HerzegovinaBrazilBulgariaBurma/MyanmarCabo VerdeCambodiaCameroonCanadaCaribbeanCentral AmericaChileChinaColombiaCongoCosta RicaCroatiaCubaCzechoslovakiaDenmarkDominicaDominican RepublicEastern AfricaEastern AsiaEastern EuropeEcuadorEgyptEl SalvadorEnglandEritreaEthiopiaEuropeFijiFranceGermanyGhanaGreeceGrenadaGuatemalaGuyanaHaitiHondurasHong KongHungaryIndiaIndonesiaIranIraqIrelandIsraelItalyJamaicaJapanJordanKazakhstanKenyaKoreaKuwaitLaosLatin AmericaLatviaLebanonLiberiaLithuaniaMalaysiaMexicoMicronesiaMiddle AfricaMoldovaMoroccoNepalNetherlandsNicaraguaNigeriaNorth AmericaNorth MacedoniaNorthern AfricaNorthern EuropeNorwayOceaniaPakistanPanamaPeruPhilippinesPolandPortugalRomaniaRussiaSaudi ArabiaScotlandSenegalSerbiaSierra LeoneSingaporeSomaliaSouth AfricaSouth AmericaSouth Central AsiaSouth Eastern AsiaSouthern EuropeSpainSri LankaSt. Vincent and the GrenadinesSudanSwedenSwitzerlandSyriaTaiwanThailandTrinidad and TobagoTurkeyUgandaUkraineUruguayUzbekistanVenezuelaVietnamWest IndiesWestern AfricaWestern AsiaWestern EuropeYemenZaireZimbabweAzores
Dominican
Race
Ancestry
AfghanAfricanAlaska NativeAlaskan AthabascanAlbanianAleutAlsatianAmericanApacheArabArapahoArgentineanArmenianAssyrian/Chaldean/SyriacAustralianAustrianBahamianBangladeshiBarbadianBasqueBelgianBelizeanBermudanBhutaneseBlackfeetBolivianBrazilianBritishBritish West IndianBulgarianBurmeseCajunCambodianCanadianCape VerdeanCarpatho RusynCelticCentral AmericanCentral American IndianCherokeeCheyenneChickasawChileanChineseChippewaChoctawColombianColvilleComancheCosta RicanCreeCreekCroatianCrowCubanCypriotCzechCzechoslovakianDanishDelawareDominicanDutchDutch West IndianEastern EuropeanEcuadorianEgyptianEnglishEstonianEthiopianEuropeanFijianFilipinoFinnishFrenchFrench American IndianFrench CanadianGermanGerman RussianGhanaianGreekGuamanian/ChamorroGuatemalanGuyaneseHaitianHmongHonduranHopiHoumaHungarianIcelanderIndian (Asian)IndonesianInupiatIranianIraqiIrishIroquoisIsraeliItalianJamaicanJapaneseJordanianKenyanKiowaKoreanLaotianLatvianLebaneseLiberianLithuanianLumbeeLuxembourgerMacedonianMalaysianMalteseMarshalleseMenomineeMexicanMexican American IndianMongolianMoroccanNative HawaiianNavajoNepaleseNew ZealanderNicaraguanNigerianNorthern EuropeanNorwegianOkinawanOsageOttawaPaiutePakistaniPalestinianPanamanianParaguayanPennsylvania GermanPeruvianPimaPolishPortuguesePotawatomiPuebloPuerto RicanPuget Sound SalishRomanianRussianSalvadoranSamoanScandinavianScotch-IrishScottishSeminoleSenegaleseSerbianShoshoneSierra LeoneanSiouxSlavicSlovakSloveneSomaliSouth AfricanSouth AmericanSouth American IndianSoviet UnionSpaniardSpanishSpanish AmericanSpanish American IndianSri LankanSubsaharan AfricanSudaneseSwedishSwissSyrianTaiwaneseThaiTlingit-HaidaTohono O'OdhamTonganTrinidadian and TobagonianTsimshianTurkishU.S. Virgin IslanderUgandanUkrainianUruguayanUteVenezuelanVietnameseWelshWest IndianYakamaYaquiYugoslavianYumanYup'ikZimbabwean
Immigration
NonimmigrantsImmigrantsAfghanistanAfricaAlbaniaArgentinaArmeniaAsiaAustriaBahamasBangladeshBarbadosBelarusBelgiumBelizeBoliviaBosnia and HerzegovinaBrazilBulgariaBurma/MyanmarCabo VerdeCambodiaCameroonCanadaCaribbeanCentral AmericaChileChinaColombiaCongoCosta RicaCroatiaCubaCzechoslovakiaDenmarkDominicaDominican RepublicEastern AfricaEastern AsiaEastern EuropeEcuadorEgyptEl SalvadorEnglandEritreaEthiopiaEuropeFijiFranceGermanyGhanaGreeceGrenadaGuatemalaGuyanaHaitiHondurasHong KongHungaryIndiaIndonesiaIranIraqIrelandIsraelItalyJamaicaJapanJordanKazakhstanKenyaKoreaKuwaitLaosLatin AmericaLatviaLebanonLiberiaLithuaniaMalaysiaMexicoMicronesiaMiddle AfricaMoldovaMoroccoNepalNetherlandsNicaraguaNigeriaNorth AmericaNorth MacedoniaNorthern AfricaNorthern EuropeNorwayOceaniaPakistanPanamaPeruPhilippinesPolandPortugalRomaniaRussiaSaudi ArabiaScotlandSenegalSerbiaSierra LeoneSingaporeSomaliaSouth AfricaSouth AmericaSouth Central AsiaSouth Eastern AsiaSouthern EuropeSpainSri LankaSt. Vincent and the GrenadinesSudanSwedenSwitzerlandSyriaTaiwanThailandTrinidad and TobagoTurkeyUgandaUkraineUruguayUzbekistanVenezuelaVietnamWest IndiesWestern AfricaWestern AsiaWestern EuropeYemenZaireZimbabweAzores
Disability Age 35 to 64
Income
Poverty
Unemployment
Labor Participation
Family Structure
Vehicle Availability
Education Level
Disability

Disability Age 35 to 64 Comparison

Immigrants from Australia

Dominicans

Exceptional
Tragic
9.7%
DISABILITY AGE 35 TO 64
99.9/ 100
METRIC RATING
34th/ 347
METRIC RANK
12.9%
DISABILITY AGE 35 TO 64
0.1/ 100
METRIC RATING
275th/ 347
METRIC RANK

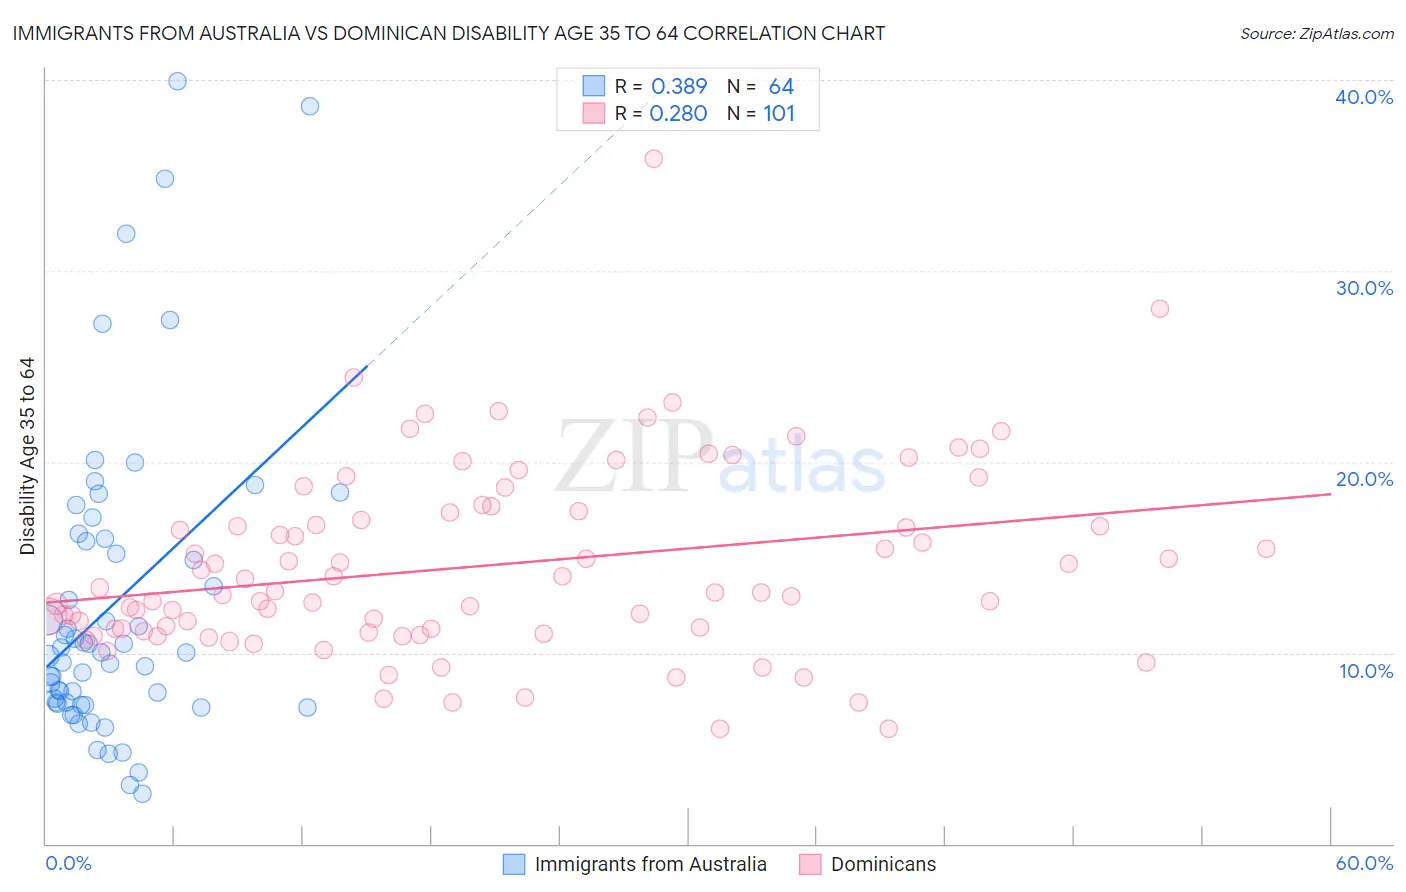
Immigrants from Australia vs Dominican Disability Age 35 to 64 Correlation Chart

The statistical analysis conducted on geographies consisting of 227,131,013 people shows a mild positive correlation between the proportion of Immigrants from Australia and percentage of population with a disability between the ages 34 and 64 in the United States with a correlation coefficient (R) of 0.389 and weighted average of 9.7%. Similarly, the statistical analysis conducted on geographies consisting of 354,697,529 people shows a weak positive correlation between the proportion of Dominicans and percentage of population with a disability between the ages 34 and 64 in the United States with a correlation coefficient (R) of 0.280 and weighted average of 12.9%, a difference of 33.2%.
Immigrants from Australia vs Dominican Disability Age 35 to 64

Disability Age 35 to 64 Correlation Summary

MeasurementImmigrants from AustraliaDominican
Minimum2.6%6.0%
Maximum40.0%35.9%
Range37.3%29.8%
Mean12.5%14.6%
Median10.0%13.1%
Interquartile 25% (IQ1)7.3%11.2%
Interquartile 75% (IQ3)15.9%17.4%
Interquartile Range (IQR)8.6%6.2%
Standard Deviation (Sample)8.1%4.9%
Standard Deviation (Population)8.1%4.9%

Similar Demographics by Disability Age 35 to 64

Demographics Similar to Immigrants from Australia by Disability Age 35 to 64

In terms of disability age 35 to 64, the demographic groups most similar to Immigrants from Australia are Immigrants from Indonesia (9.7%, a difference of 0.070%), Bulgarian (9.7%, a difference of 0.10%), Immigrants from Cuba (9.7%, a difference of 0.14%), Turkish (9.7%, a difference of 0.15%), and Immigrants from Turkey (9.7%, a difference of 0.22%).
DemographicsRating | RankDisability Age 35 to 64
Immigrants | Asia
100.0
/100
|
#27
Exceptional
9.5%
Immigrants | Pakistan
100.0
/100
|
#28
Exceptional
9.5%
Immigrants | Ireland
100.0
/100
|
#29
Exceptional
9.5%
Immigrants | Japan
100.0
/100
|
#30
Exceptional
9.5%
Immigrants | Lithuania
99.9
/100
|
#31
Exceptional
9.6%
Turks
99.9
/100
|
#32
Exceptional
9.7%
Immigrants | Indonesia
99.9
/100
|
#33
Exceptional
9.7%
Immigrants | Australia
99.9
/100
|
#34
Exceptional
9.7%
Bulgarians
99.9
/100
|
#35
Exceptional
9.7%
Immigrants | Cuba
99.9
/100
|
#36
Exceptional
9.7%
Immigrants | Turkey
99.9
/100
|
#37
Exceptional
9.7%
Egyptians
99.9
/100
|
#38
Exceptional
9.7%
Immigrants | Belarus
99.9
/100
|
#39
Exceptional
9.7%
Immigrants | Armenia
99.9
/100
|
#40
Exceptional
9.7%
Israelis
99.9
/100
|
#41
Exceptional
9.7%

Demographics Similar to Dominicans by Disability Age 35 to 64

In terms of disability age 35 to 64, the demographic groups most similar to Dominicans are Somali (12.9%, a difference of 0.12%), Celtic (12.9%, a difference of 0.14%), Pennsylvania German (12.8%, a difference of 0.16%), U.S. Virgin Islander (12.8%, a difference of 0.25%), and Immigrants from Dominican Republic (12.9%, a difference of 0.31%).
DemographicsRating | RankDisability Age 35 to 64
Immigrants | Dominica
0.2
/100
|
#268
Tragic
12.7%
Spanish
0.2
/100
|
#269
Tragic
12.7%
French
0.2
/100
|
#270
Tragic
12.7%
Nepalese
0.1
/100
|
#271
Tragic
12.8%
U.S. Virgin Islanders
0.1
/100
|
#272
Tragic
12.8%
Pennsylvania Germans
0.1
/100
|
#273
Tragic
12.8%
Celtics
0.1
/100
|
#274
Tragic
12.9%
Dominicans
0.1
/100
|
#275
Tragic
12.9%
Somalis
0.1
/100
|
#276
Tragic
12.9%
Immigrants | Dominican Republic
0.1
/100
|
#277
Tragic
12.9%
French Canadians
0.1
/100
|
#278
Tragic
12.9%
Immigrants | Micronesia
0.1
/100
|
#279
Tragic
12.9%
Liberians
0.1
/100
|
#280
Tragic
12.9%
Scotch-Irish
0.1
/100
|
#281
Tragic
13.0%
Immigrants | Laos
0.1
/100
|
#282
Tragic
13.0%