Immigrants from Africa vs Immigrants from Southern Europe Disability Age 18 to 34
COMPARE
Immigrants from Africa
Immigrants from Southern Europe
Disability Age 18 to 34
Disability Age 18 to 34 Comparison
Immigrants from Africa
Immigrants from Southern Europe
6.6%
DISABILITY AGE 18 TO 34
45.9/ 100
METRIC RATING
176th/ 347
METRIC RANK
6.5%
DISABILITY AGE 18 TO 34
72.5/ 100
METRIC RATING
160th/ 347
METRIC RANK
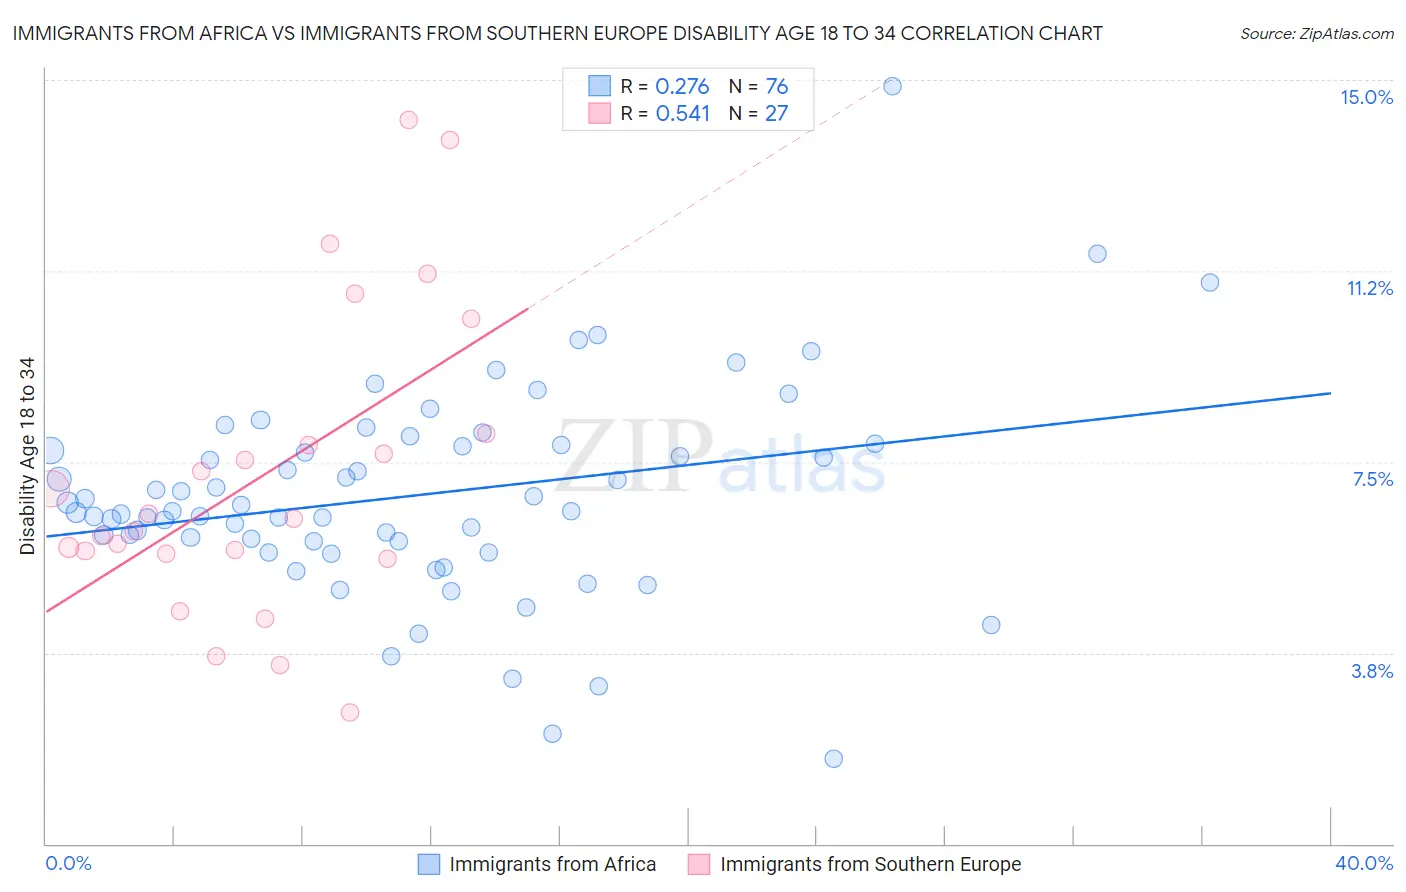
Immigrants from Africa vs Immigrants from Southern Europe Disability Age 18 to 34 Correlation Chart
The statistical analysis conducted on geographies consisting of 468,122,766 people shows a weak positive correlation between the proportion of Immigrants from Africa and percentage of population with a disability between the ages 18 and 35 in the United States with a correlation coefficient (R) of 0.276 and weighted average of 6.6%. Similarly, the statistical analysis conducted on geographies consisting of 401,618,598 people shows a substantial positive correlation between the proportion of Immigrants from Southern Europe and percentage of population with a disability between the ages 18 and 35 in the United States with a correlation coefficient (R) of 0.541 and weighted average of 6.5%, a difference of 2.0%.
Disability Age 18 to 34 Correlation Summary
| Measurement | Immigrants from Africa | Immigrants from Southern Europe |
| Minimum | 1.7% | 2.6% |
| Maximum | 14.9% | 14.2% |
| Range | 13.2% | 11.6% |
| Mean | 6.8% | 7.3% |
| Median | 6.5% | 6.4% |
| Interquartile 25% (IQ1) | 5.9% | 5.7% |
| Interquartile 75% (IQ3) | 7.8% | 8.1% |
| Interquartile Range (IQR) | 1.9% | 2.4% |
| Standard Deviation (Sample) | 2.0% | 3.0% |
| Standard Deviation (Population) | 2.0% | 2.9% |
Demographics Similar to Immigrants from Africa and Immigrants from Southern Europe by Disability Age 18 to 34
In terms of disability age 18 to 34, the demographic groups most similar to Immigrants from Africa are Immigrants from Cambodia (6.6%, a difference of 0.040%), Syrian (6.6%, a difference of 0.11%), Nigerian (6.6%, a difference of 0.15%), Native Hawaiian (6.6%, a difference of 0.29%), and Immigrants from Mexico (6.6%, a difference of 0.57%). Similarly, the demographic groups most similar to Immigrants from Southern Europe are Arab (6.5%, a difference of 0.020%), South African (6.5%, a difference of 0.080%), Immigrants from Denmark (6.5%, a difference of 0.080%), Dominican (6.5%, a difference of 0.090%), and Immigrants from Nigeria (6.5%, a difference of 0.19%).
| Demographics | Rating | Rank | Disability Age 18 to 34 |
| Zimbabweans | 74.7 /100 | #158 | Good 6.5% |
| Dominicans | 73.6 /100 | #159 | Good 6.5% |
| Immigrants | Southern Europe | 72.5 /100 | #160 | Good 6.5% |
| Arabs | 72.3 /100 | #161 | Good 6.5% |
| South Africans | 71.7 /100 | #162 | Good 6.5% |
| Immigrants | Denmark | 71.7 /100 | #163 | Good 6.5% |
| Immigrants | Nigeria | 70.4 /100 | #164 | Good 6.5% |
| Immigrants | Hungary | 69.6 /100 | #165 | Good 6.5% |
| Eastern Europeans | 65.1 /100 | #166 | Good 6.5% |
| Immigrants | Northern Europe | 64.1 /100 | #167 | Good 6.5% |
| Immigrants | Moldova | 63.1 /100 | #168 | Good 6.5% |
| Russians | 60.2 /100 | #169 | Good 6.5% |
| Immigrants | Bahamas | 57.9 /100 | #170 | Average 6.6% |
| Bahamians | 55.5 /100 | #171 | Average 6.6% |
| Ghanaians | 54.7 /100 | #172 | Average 6.6% |
| Immigrants | Mexico | 54.1 /100 | #173 | Average 6.6% |
| Native Hawaiians | 50.0 /100 | #174 | Average 6.6% |
| Immigrants | Cambodia | 46.5 /100 | #175 | Average 6.6% |
| Immigrants | Africa | 45.9 /100 | #176 | Average 6.6% |
| Syrians | 44.3 /100 | #177 | Average 6.6% |
| Nigerians | 43.7 /100 | #178 | Average 6.6% |