Immigrants from Africa vs Immigrants from Kuwait Disability Age 18 to 34
COMPARE
Immigrants from Africa
Immigrants from Kuwait
Disability Age 18 to 34
Disability Age 18 to 34 Comparison
Immigrants from Africa
Immigrants from Kuwait
6.6%
DISABILITY AGE 18 TO 34
45.9/ 100
METRIC RATING
176th/ 347
METRIC RANK
6.2%
DISABILITY AGE 18 TO 34
98.0/ 100
METRIC RATING
86th/ 347
METRIC RANK
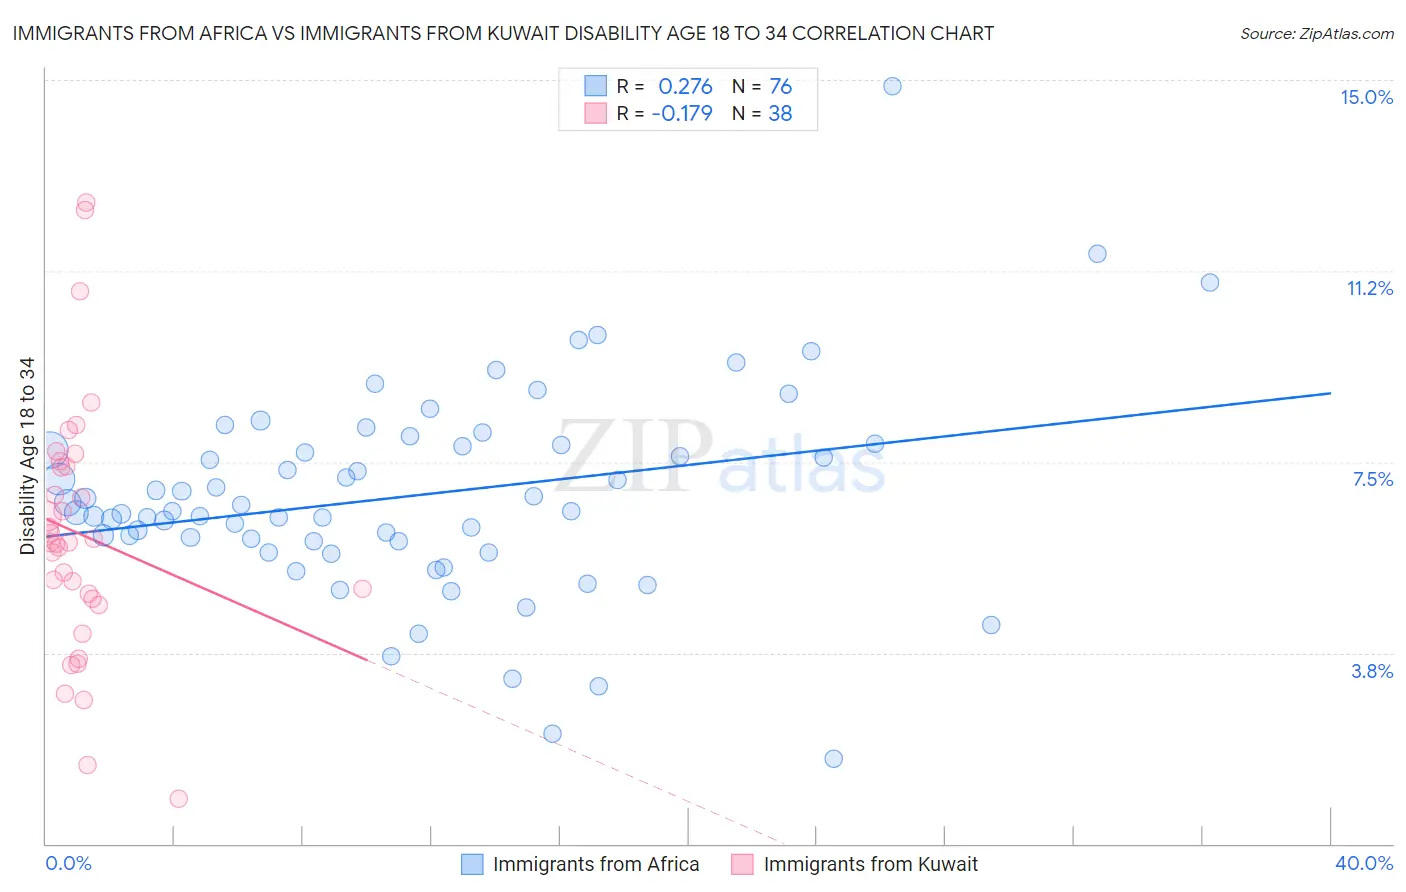
Immigrants from Africa vs Immigrants from Kuwait Disability Age 18 to 34 Correlation Chart
The statistical analysis conducted on geographies consisting of 468,122,766 people shows a weak positive correlation between the proportion of Immigrants from Africa and percentage of population with a disability between the ages 18 and 35 in the United States with a correlation coefficient (R) of 0.276 and weighted average of 6.6%. Similarly, the statistical analysis conducted on geographies consisting of 136,853,734 people shows a poor negative correlation between the proportion of Immigrants from Kuwait and percentage of population with a disability between the ages 18 and 35 in the United States with a correlation coefficient (R) of -0.179 and weighted average of 6.2%, a difference of 7.5%.
Disability Age 18 to 34 Correlation Summary
| Measurement | Immigrants from Africa | Immigrants from Kuwait |
| Minimum | 1.7% | 0.88% |
| Maximum | 14.9% | 12.6% |
| Range | 13.2% | 11.7% |
| Mean | 6.8% | 6.1% |
| Median | 6.5% | 5.9% |
| Interquartile 25% (IQ1) | 5.9% | 4.8% |
| Interquartile 75% (IQ3) | 7.8% | 7.4% |
| Interquartile Range (IQR) | 1.9% | 2.6% |
| Standard Deviation (Sample) | 2.0% | 2.5% |
| Standard Deviation (Population) | 2.0% | 2.5% |
Similar Demographics by Disability Age 18 to 34
Demographics Similar to Immigrants from Africa by Disability Age 18 to 34
In terms of disability age 18 to 34, the demographic groups most similar to Immigrants from Africa are Immigrants from Cambodia (6.6%, a difference of 0.040%), Syrian (6.6%, a difference of 0.11%), Nigerian (6.6%, a difference of 0.15%), Immigrants from Ghana (6.6%, a difference of 0.26%), and Native Hawaiian (6.6%, a difference of 0.29%).
| Demographics | Rating | Rank | Disability Age 18 to 34 |
| Russians | 60.2 /100 | #169 | Good 6.5% |
| Immigrants | Bahamas | 57.9 /100 | #170 | Average 6.6% |
| Bahamians | 55.5 /100 | #171 | Average 6.6% |
| Ghanaians | 54.7 /100 | #172 | Average 6.6% |
| Immigrants | Mexico | 54.1 /100 | #173 | Average 6.6% |
| Native Hawaiians | 50.0 /100 | #174 | Average 6.6% |
| Immigrants | Cambodia | 46.5 /100 | #175 | Average 6.6% |
| Immigrants | Africa | 45.9 /100 | #176 | Average 6.6% |
| Syrians | 44.3 /100 | #177 | Average 6.6% |
| Nigerians | 43.7 /100 | #178 | Average 6.6% |
| Immigrants | Ghana | 42.1 /100 | #179 | Average 6.6% |
| Immigrants | Austria | 39.6 /100 | #180 | Fair 6.6% |
| Romanians | 39.5 /100 | #181 | Fair 6.6% |
| U.S. Virgin Islanders | 38.6 /100 | #182 | Fair 6.7% |
| Immigrants | Iraq | 37.4 /100 | #183 | Fair 6.7% |
Demographics Similar to Immigrants from Kuwait by Disability Age 18 to 34
In terms of disability age 18 to 34, the demographic groups most similar to Immigrants from Kuwait are Immigrants from Eastern Europe (6.2%, a difference of 0.080%), Cambodian (6.2%, a difference of 0.11%), Turkish (6.2%, a difference of 0.17%), Immigrants from Vietnam (6.2%, a difference of 0.21%), and Immigrants from Ireland (6.1%, a difference of 0.22%).
| Demographics | Rating | Rank | Disability Age 18 to 34 |
| Afghans | 98.7 /100 | #79 | Exceptional 6.1% |
| Immigrants | Chile | 98.5 /100 | #80 | Exceptional 6.1% |
| Immigrants | Australia | 98.5 /100 | #81 | Exceptional 6.1% |
| Immigrants | Northern Africa | 98.4 /100 | #82 | Exceptional 6.1% |
| Barbadians | 98.3 /100 | #83 | Exceptional 6.1% |
| Israelis | 98.3 /100 | #84 | Exceptional 6.1% |
| Immigrants | Ireland | 98.2 /100 | #85 | Exceptional 6.1% |
| Immigrants | Kuwait | 98.0 /100 | #86 | Exceptional 6.2% |
| Immigrants | Eastern Europe | 97.9 /100 | #87 | Exceptional 6.2% |
| Cambodians | 97.8 /100 | #88 | Exceptional 6.2% |
| Turks | 97.8 /100 | #89 | Exceptional 6.2% |
| Immigrants | Vietnam | 97.7 /100 | #90 | Exceptional 6.2% |
| Immigrants | Philippines | 97.6 /100 | #91 | Exceptional 6.2% |
| Jordanians | 97.6 /100 | #92 | Exceptional 6.2% |
| Immigrants | Immigrants | 97.6 /100 | #93 | Exceptional 6.2% |