Hopi vs Swedish Disability Age 18 to 34
COMPARE
Hopi
Swedish
Disability Age 18 to 34
Disability Age 18 to 34 Comparison
Hopi
Swedes
7.5%
DISABILITY AGE 18 TO 34
0.0/ 100
METRIC RATING
284th/ 347
METRIC RANK
7.5%
DISABILITY AGE 18 TO 34
0.0/ 100
METRIC RATING
285th/ 347
METRIC RANK
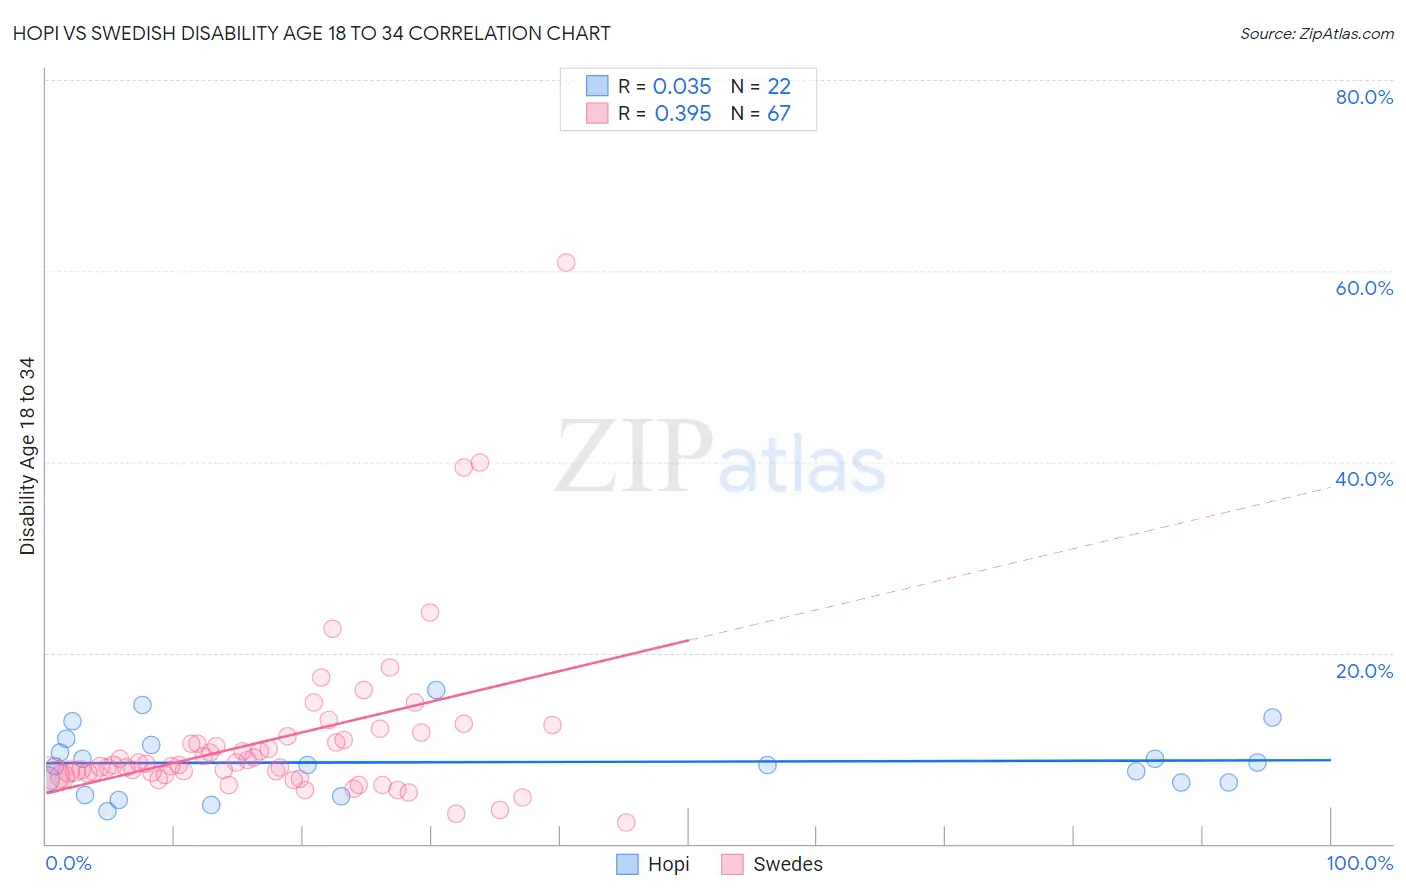
Hopi vs Swedish Disability Age 18 to 34 Correlation Chart
The statistical analysis conducted on geographies consisting of 74,687,859 people shows no correlation between the proportion of Hopi and percentage of population with a disability between the ages 18 and 35 in the United States with a correlation coefficient (R) of 0.035 and weighted average of 7.5%. Similarly, the statistical analysis conducted on geographies consisting of 534,828,262 people shows a mild positive correlation between the proportion of Swedes and percentage of population with a disability between the ages 18 and 35 in the United States with a correlation coefficient (R) of 0.395 and weighted average of 7.5%, a difference of 0.42%.
Disability Age 18 to 34 Correlation Summary
| Measurement | Hopi | Swedish |
| Minimum | 3.5% | 2.2% |
| Maximum | 16.1% | 60.9% |
| Range | 12.7% | 58.7% |
| Mean | 8.5% | 10.9% |
| Median | 8.2% | 8.2% |
| Interquartile 25% (IQ1) | 6.4% | 7.3% |
| Interquartile 75% (IQ3) | 10.4% | 10.8% |
| Interquartile Range (IQR) | 4.0% | 3.6% |
| Standard Deviation (Sample) | 3.4% | 9.0% |
| Standard Deviation (Population) | 3.3% | 8.9% |
Demographics Similar to Hopi and Swedes by Disability Age 18 to 34
In terms of disability age 18 to 34, the demographic groups most similar to Hopi are Danish (7.5%, a difference of 0.14%), Spanish (7.5%, a difference of 0.24%), Paiute (7.5%, a difference of 0.44%), Czechoslovakian (7.4%, a difference of 0.93%), and Yaqui (7.4%, a difference of 0.93%). Similarly, the demographic groups most similar to Swedes are Danish (7.5%, a difference of 0.56%), Spanish (7.5%, a difference of 0.66%), Paiute (7.5%, a difference of 0.86%), Celtic (7.6%, a difference of 0.90%), and Norwegian (7.6%, a difference of 1.2%).
| Demographics | Rating | Rank | Disability Age 18 to 34 |
| Africans | 0.1 /100 | #274 | Tragic 7.4% |
| Immigrants | Somalia | 0.1 /100 | #275 | Tragic 7.4% |
| Europeans | 0.1 /100 | #276 | Tragic 7.4% |
| Immigrants | Portugal | 0.1 /100 | #277 | Tragic 7.4% |
| Lumbee | 0.1 /100 | #278 | Tragic 7.4% |
| Czechoslovakians | 0.1 /100 | #279 | Tragic 7.4% |
| Yaqui | 0.1 /100 | #280 | Tragic 7.4% |
| Paiute | 0.0 /100 | #281 | Tragic 7.5% |
| Spanish | 0.0 /100 | #282 | Tragic 7.5% |
| Danes | 0.0 /100 | #283 | Tragic 7.5% |
| Hopi | 0.0 /100 | #284 | Tragic 7.5% |
| Swedes | 0.0 /100 | #285 | Tragic 7.5% |
| Celtics | 0.0 /100 | #286 | Tragic 7.6% |
| Norwegians | 0.0 /100 | #287 | Tragic 7.6% |
| Whites/Caucasians | 0.0 /100 | #288 | Tragic 7.6% |
| Immigrants | Nonimmigrants | 0.0 /100 | #289 | Tragic 7.6% |
| Slovaks | 0.0 /100 | #290 | Tragic 7.7% |
| Irish | 0.0 /100 | #291 | Tragic 7.7% |
| Blacks/African Americans | 0.0 /100 | #292 | Tragic 7.7% |
| Scandinavians | 0.0 /100 | #293 | Tragic 7.7% |
| Immigrants | Cabo Verde | 0.0 /100 | #294 | Tragic 7.7% |