Hopi vs Potawatomi Disability Age 35 to 64
COMPARE
Hopi
Potawatomi
Disability Age 35 to 64
Disability Age 35 to 64 Comparison
Hopi
Potawatomi
13.9%
DISABILITY AGE 35 TO 64
0.0/ 100
METRIC RATING
304th/ 347
METRIC RANK
14.8%
DISABILITY AGE 35 TO 64
0.0/ 100
METRIC RATING
322nd/ 347
METRIC RANK
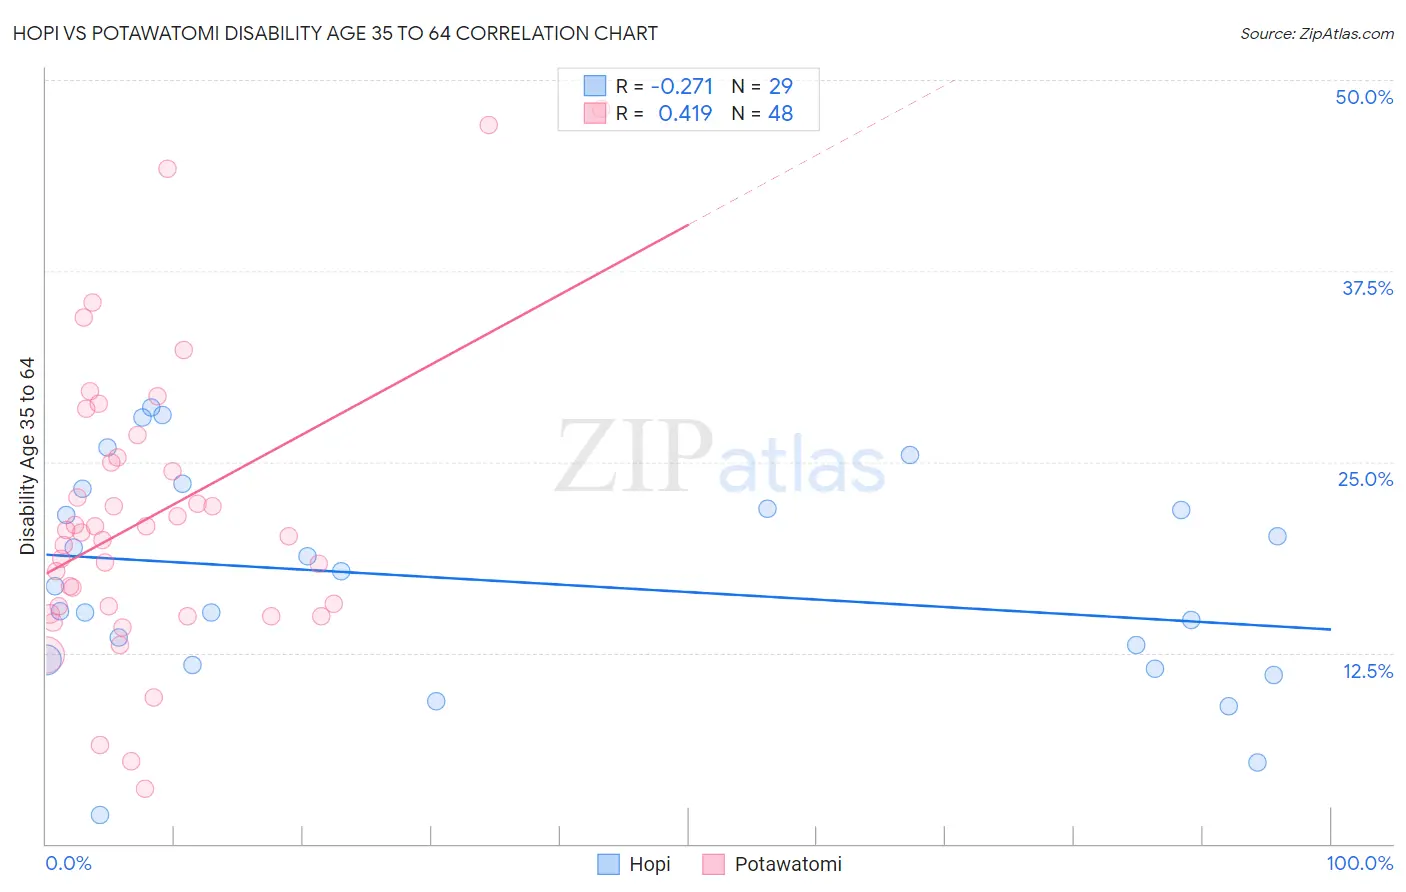
Hopi vs Potawatomi Disability Age 35 to 64 Correlation Chart
The statistical analysis conducted on geographies consisting of 74,731,125 people shows a weak negative correlation between the proportion of Hopi and percentage of population with a disability between the ages 34 and 64 in the United States with a correlation coefficient (R) of -0.271 and weighted average of 13.9%. Similarly, the statistical analysis conducted on geographies consisting of 117,756,244 people shows a moderate positive correlation between the proportion of Potawatomi and percentage of population with a disability between the ages 34 and 64 in the United States with a correlation coefficient (R) of 0.419 and weighted average of 14.8%, a difference of 6.5%.
Disability Age 35 to 64 Correlation Summary
| Measurement | Hopi | Potawatomi |
| Minimum | 1.8% | 3.6% |
| Maximum | 28.6% | 48.1% |
| Range | 26.7% | 44.6% |
| Mean | 17.2% | 21.4% |
| Median | 16.9% | 20.2% |
| Interquartile 25% (IQ1) | 11.8% | 15.3% |
| Interquartile 75% (IQ3) | 22.6% | 25.2% |
| Interquartile Range (IQR) | 10.8% | 9.9% |
| Standard Deviation (Sample) | 6.9% | 9.5% |
| Standard Deviation (Population) | 6.8% | 9.4% |
Demographics Similar to Hopi and Potawatomi by Disability Age 35 to 64
In terms of disability age 35 to 64, the demographic groups most similar to Hopi are Sioux (13.9%, a difference of 0.030%), American (13.9%, a difference of 0.38%), Immigrants from Yemen (14.0%, a difference of 1.3%), Blackfeet (14.1%, a difference of 1.4%), and Inupiat (14.1%, a difference of 1.5%). Similarly, the demographic groups most similar to Potawatomi are Comanche (14.7%, a difference of 0.040%), Black/African American (14.7%, a difference of 0.30%), Immigrants from Cabo Verde (14.7%, a difference of 0.45%), Ottawa (14.6%, a difference of 0.87%), and Crow (14.6%, a difference of 0.94%).
| Demographics | Rating | Rank | Disability Age 35 to 64 |
| Sioux | 0.0 /100 | #303 | Tragic 13.9% |
| Hopi | 0.0 /100 | #304 | Tragic 13.9% |
| Americans | 0.0 /100 | #305 | Tragic 13.9% |
| Immigrants | Yemen | 0.0 /100 | #306 | Tragic 14.0% |
| Blackfeet | 0.0 /100 | #307 | Tragic 14.1% |
| Inupiat | 0.0 /100 | #308 | Tragic 14.1% |
| Cree | 0.0 /100 | #309 | Tragic 14.1% |
| Cape Verdeans | 0.0 /100 | #310 | Tragic 14.1% |
| Immigrants | Azores | 0.0 /100 | #311 | Tragic 14.3% |
| Paiute | 0.0 /100 | #312 | Tragic 14.3% |
| Iroquois | 0.0 /100 | #313 | Tragic 14.4% |
| Shoshone | 0.0 /100 | #314 | Tragic 14.5% |
| Alaska Natives | 0.0 /100 | #315 | Tragic 14.5% |
| Osage | 0.0 /100 | #316 | Tragic 14.5% |
| Crow | 0.0 /100 | #317 | Tragic 14.6% |
| Ottawa | 0.0 /100 | #318 | Tragic 14.6% |
| Immigrants | Cabo Verde | 0.0 /100 | #319 | Tragic 14.7% |
| Blacks/African Americans | 0.0 /100 | #320 | Tragic 14.7% |
| Comanche | 0.0 /100 | #321 | Tragic 14.7% |
| Potawatomi | 0.0 /100 | #322 | Tragic 14.8% |
| Apache | 0.0 /100 | #323 | Tragic 14.9% |