Hopi vs Eastern European Disability Age 35 to 64
COMPARE
Hopi
Eastern European
Disability Age 35 to 64
Disability Age 35 to 64 Comparison
Hopi
Eastern Europeans
13.9%
DISABILITY AGE 35 TO 64
0.0/ 100
METRIC RATING
304th/ 347
METRIC RANK
10.0%
DISABILITY AGE 35 TO 64
99.7/ 100
METRIC RATING
62nd/ 347
METRIC RANK
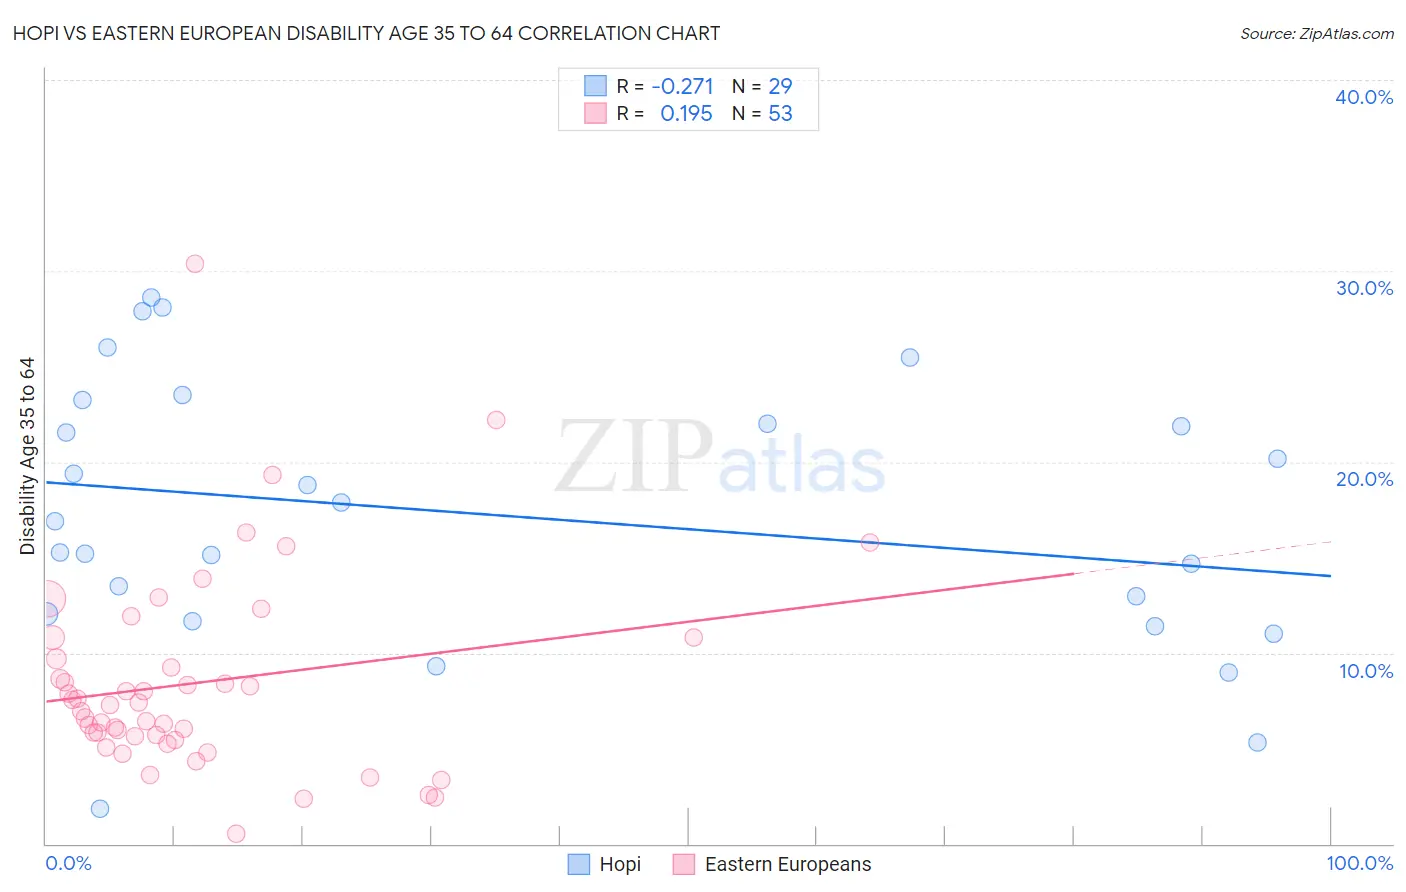
Hopi vs Eastern European Disability Age 35 to 64 Correlation Chart
The statistical analysis conducted on geographies consisting of 74,731,125 people shows a weak negative correlation between the proportion of Hopi and percentage of population with a disability between the ages 34 and 64 in the United States with a correlation coefficient (R) of -0.271 and weighted average of 13.9%. Similarly, the statistical analysis conducted on geographies consisting of 460,814,379 people shows a poor positive correlation between the proportion of Eastern Europeans and percentage of population with a disability between the ages 34 and 64 in the United States with a correlation coefficient (R) of 0.195 and weighted average of 10.0%, a difference of 39.2%.
Disability Age 35 to 64 Correlation Summary
| Measurement | Hopi | Eastern European |
| Minimum | 1.8% | 0.52% |
| Maximum | 28.6% | 30.4% |
| Range | 26.7% | 29.8% |
| Mean | 17.2% | 8.4% |
| Median | 16.9% | 7.3% |
| Interquartile 25% (IQ1) | 11.8% | 5.5% |
| Interquartile 75% (IQ3) | 22.6% | 10.2% |
| Interquartile Range (IQR) | 10.8% | 4.7% |
| Standard Deviation (Sample) | 6.9% | 5.3% |
| Standard Deviation (Population) | 6.8% | 5.2% |
Similar Demographics by Disability Age 35 to 64
Demographics Similar to Hopi by Disability Age 35 to 64
In terms of disability age 35 to 64, the demographic groups most similar to Hopi are Sioux (13.9%, a difference of 0.030%), Aleut (13.8%, a difference of 0.21%), American (13.9%, a difference of 0.38%), French American Indian (13.7%, a difference of 1.1%), and Immigrants from Yemen (14.0%, a difference of 1.3%).
| Demographics | Rating | Rank | Disability Age 35 to 64 |
| Bangladeshis | 0.0 /100 | #297 | Tragic 13.6% |
| Cheyenne | 0.0 /100 | #298 | Tragic 13.6% |
| Spanish Americans | 0.0 /100 | #299 | Tragic 13.7% |
| Delaware | 0.0 /100 | #300 | Tragic 13.7% |
| French American Indians | 0.0 /100 | #301 | Tragic 13.7% |
| Aleuts | 0.0 /100 | #302 | Tragic 13.8% |
| Sioux | 0.0 /100 | #303 | Tragic 13.9% |
| Hopi | 0.0 /100 | #304 | Tragic 13.9% |
| Americans | 0.0 /100 | #305 | Tragic 13.9% |
| Immigrants | Yemen | 0.0 /100 | #306 | Tragic 14.0% |
| Blackfeet | 0.0 /100 | #307 | Tragic 14.1% |
| Inupiat | 0.0 /100 | #308 | Tragic 14.1% |
| Cree | 0.0 /100 | #309 | Tragic 14.1% |
| Cape Verdeans | 0.0 /100 | #310 | Tragic 14.1% |
| Immigrants | Azores | 0.0 /100 | #311 | Tragic 14.3% |
Demographics Similar to Eastern Europeans by Disability Age 35 to 64
In terms of disability age 35 to 64, the demographic groups most similar to Eastern Europeans are Immigrants from Spain (10.0%, a difference of 0.10%), Immigrants from Czechoslovakia (10.0%, a difference of 0.12%), Immigrants from South America (9.9%, a difference of 0.22%), Immigrants from Romania (10.0%, a difference of 0.31%), and Immigrants from Poland (10.0%, a difference of 0.39%).
| Demographics | Rating | Rank | Disability Age 35 to 64 |
| Peruvians | 99.8 /100 | #55 | Exceptional 9.9% |
| South Americans | 99.8 /100 | #56 | Exceptional 9.9% |
| Colombians | 99.8 /100 | #57 | Exceptional 9.9% |
| Armenians | 99.8 /100 | #58 | Exceptional 9.9% |
| Immigrants | Sweden | 99.7 /100 | #59 | Exceptional 9.9% |
| Immigrants | South America | 99.7 /100 | #60 | Exceptional 9.9% |
| Immigrants | Spain | 99.7 /100 | #61 | Exceptional 10.0% |
| Eastern Europeans | 99.7 /100 | #62 | Exceptional 10.0% |
| Immigrants | Czechoslovakia | 99.7 /100 | #63 | Exceptional 10.0% |
| Immigrants | Romania | 99.7 /100 | #64 | Exceptional 10.0% |
| Immigrants | Poland | 99.6 /100 | #65 | Exceptional 10.0% |
| Cubans | 99.6 /100 | #66 | Exceptional 10.0% |
| Immigrants | Uzbekistan | 99.5 /100 | #67 | Exceptional 10.1% |
| Immigrants | Switzerland | 99.5 /100 | #68 | Exceptional 10.1% |
| Immigrants | Eastern Europe | 99.5 /100 | #69 | Exceptional 10.1% |