English vs Central American Indian Disability Age Over 75
COMPARE
English
Central American Indian
Disability Age Over 75
Disability Age Over 75 Comparison
English
Central American Indians
46.8%
DISABILITY AGE OVER 75
89.4/ 100
METRIC RATING
133rd/ 347
METRIC RANK
50.5%
DISABILITY AGE OVER 75
0.0/ 100
METRIC RATING
305th/ 347
METRIC RANK
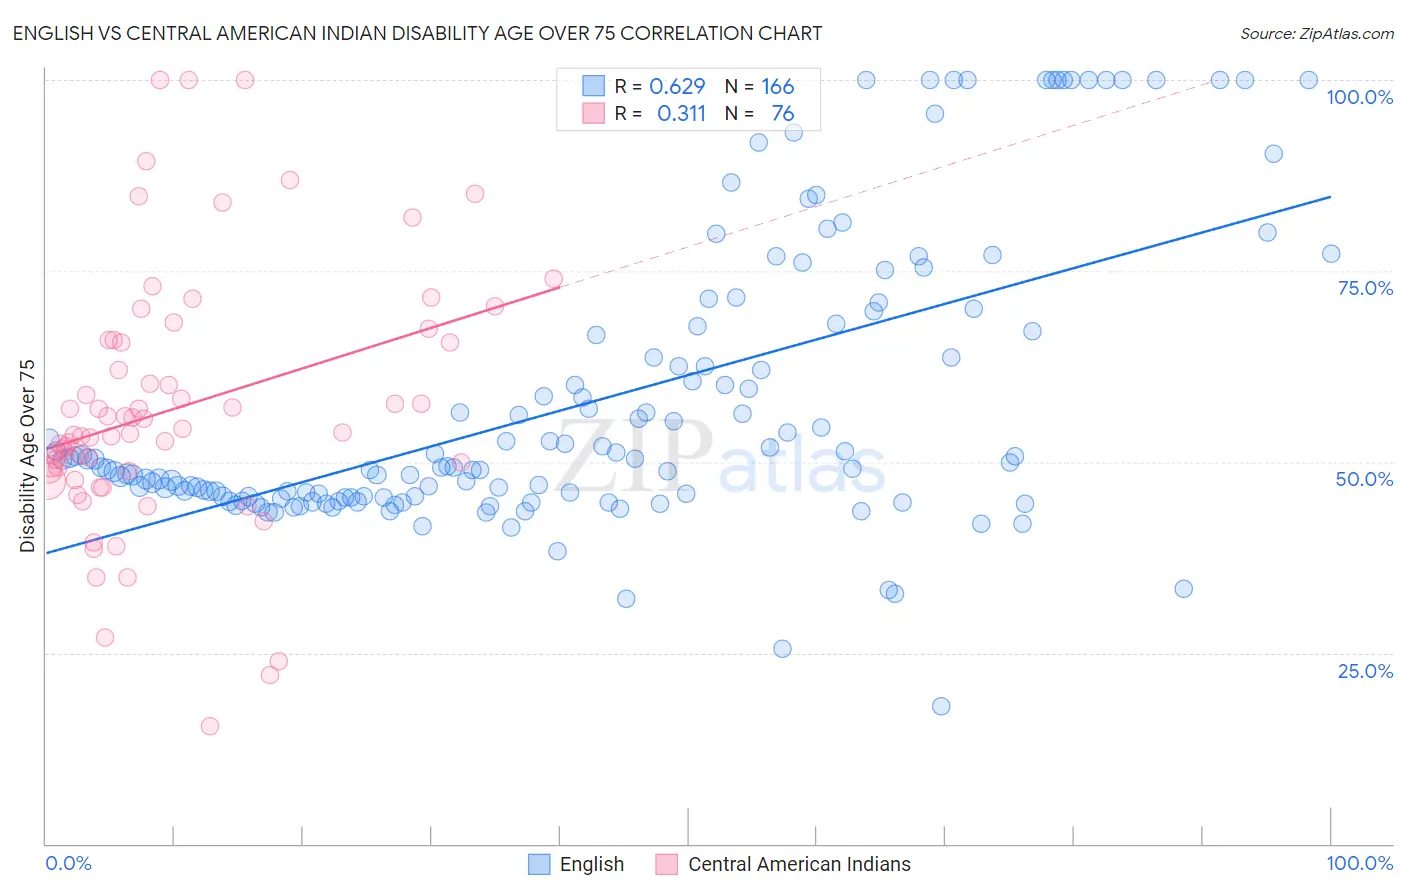
English vs Central American Indian Disability Age Over 75 Correlation Chart
The statistical analysis conducted on geographies consisting of 577,173,865 people shows a significant positive correlation between the proportion of English and percentage of population with a disability over the age of 75 in the United States with a correlation coefficient (R) of 0.629 and weighted average of 46.8%. Similarly, the statistical analysis conducted on geographies consisting of 325,706,865 people shows a mild positive correlation between the proportion of Central American Indians and percentage of population with a disability over the age of 75 in the United States with a correlation coefficient (R) of 0.311 and weighted average of 50.5%, a difference of 8.0%.
Disability Age Over 75 Correlation Summary
| Measurement | English | Central American Indian |
| Minimum | 17.9% | 15.4% |
| Maximum | 100.0% | 100.0% |
| Range | 82.1% | 84.6% |
| Mean | 57.8% | 57.0% |
| Median | 49.4% | 53.8% |
| Interquartile 25% (IQ1) | 45.4% | 48.9% |
| Interquartile 75% (IQ3) | 67.1% | 65.8% |
| Interquartile Range (IQR) | 21.8% | 16.9% |
| Standard Deviation (Sample) | 18.9% | 16.8% |
| Standard Deviation (Population) | 18.9% | 16.7% |
Similar Demographics by Disability Age Over 75
Demographics Similar to English by Disability Age Over 75
In terms of disability age over 75, the demographic groups most similar to English are Immigrants from Ethiopia (46.8%, a difference of 0.020%), Ethiopian (46.8%, a difference of 0.030%), South American (46.8%, a difference of 0.040%), Immigrants from Venezuela (46.8%, a difference of 0.040%), and Immigrants from Uganda (46.8%, a difference of 0.050%).
| Demographics | Rating | Rank | Disability Age Over 75 |
| Europeans | 91.2 /100 | #126 | Exceptional 46.7% |
| Syrians | 91.1 /100 | #127 | Exceptional 46.7% |
| Icelanders | 90.9 /100 | #128 | Exceptional 46.7% |
| Immigrants | Germany | 90.8 /100 | #129 | Exceptional 46.7% |
| Immigrants | Northern Africa | 90.7 /100 | #130 | Exceptional 46.7% |
| Scottish | 90.5 /100 | #131 | Exceptional 46.7% |
| South Americans | 90.0 /100 | #132 | Excellent 46.8% |
| English | 89.4 /100 | #133 | Excellent 46.8% |
| Immigrants | Ethiopia | 89.1 /100 | #134 | Excellent 46.8% |
| Ethiopians | 88.9 /100 | #135 | Excellent 46.8% |
| Immigrants | Venezuela | 88.6 /100 | #136 | Excellent 46.8% |
| Immigrants | Uganda | 88.5 /100 | #137 | Excellent 46.8% |
| Immigrants | Bosnia and Herzegovina | 88.5 /100 | #138 | Excellent 46.8% |
| Yugoslavians | 88.5 /100 | #139 | Excellent 46.8% |
| Immigrants | Costa Rica | 87.4 /100 | #140 | Excellent 46.8% |
Demographics Similar to Central American Indians by Disability Age Over 75
In terms of disability age over 75, the demographic groups most similar to Central American Indians are Immigrants from Central America (50.5%, a difference of 0.090%), Immigrants from Fiji (50.6%, a difference of 0.15%), Hispanic or Latino (50.6%, a difference of 0.17%), Aleut (50.6%, a difference of 0.17%), and Tlingit-Haida (50.6%, a difference of 0.21%).
| Demographics | Rating | Rank | Disability Age Over 75 |
| Marshallese | 0.0 /100 | #298 | Tragic 50.1% |
| Immigrants | Micronesia | 0.0 /100 | #299 | Tragic 50.1% |
| Cape Verdeans | 0.0 /100 | #300 | Tragic 50.1% |
| Dominicans | 0.0 /100 | #301 | Tragic 50.2% |
| Cherokee | 0.0 /100 | #302 | Tragic 50.2% |
| Japanese | 0.0 /100 | #303 | Tragic 50.2% |
| Immigrants | Dominican Republic | 0.0 /100 | #304 | Tragic 50.3% |
| Central American Indians | 0.0 /100 | #305 | Tragic 50.5% |
| Immigrants | Central America | 0.0 /100 | #306 | Tragic 50.5% |
| Immigrants | Fiji | 0.0 /100 | #307 | Tragic 50.6% |
| Hispanics or Latinos | 0.0 /100 | #308 | Tragic 50.6% |
| Aleuts | 0.0 /100 | #309 | Tragic 50.6% |
| Tlingit-Haida | 0.0 /100 | #310 | Tragic 50.6% |
| Cajuns | 0.0 /100 | #311 | Tragic 50.7% |
| Cheyenne | 0.0 /100 | #312 | Tragic 50.9% |