Dutch West Indian vs Immigrants from Bosnia and Herzegovina Cognitive Disability
COMPARE
Dutch West Indian
Immigrants from Bosnia and Herzegovina
Cognitive Disability
Cognitive Disability Comparison
Dutch West Indians
Immigrants from Bosnia and Herzegovina
18.1%
COGNITIVE DISABILITY
0.1/ 100
METRIC RATING
287th/ 347
METRIC RANK
17.4%
COGNITIVE DISABILITY
22.0/ 100
METRIC RATING
194th/ 347
METRIC RANK
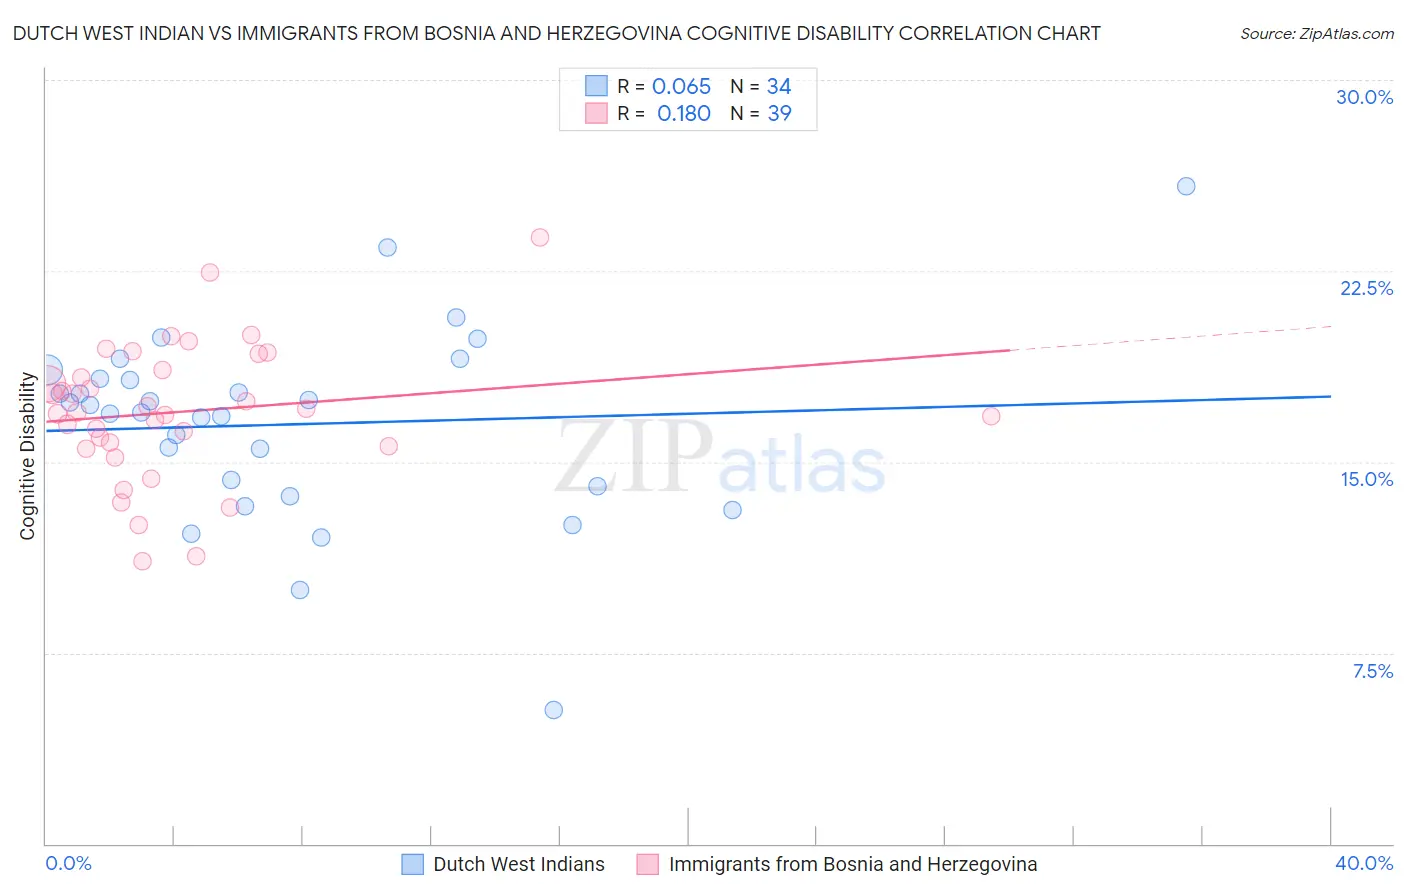
Dutch West Indian vs Immigrants from Bosnia and Herzegovina Cognitive Disability Correlation Chart
The statistical analysis conducted on geographies consisting of 85,769,565 people shows a slight positive correlation between the proportion of Dutch West Indians and percentage of population with cognitive disability in the United States with a correlation coefficient (R) of 0.065 and weighted average of 18.1%. Similarly, the statistical analysis conducted on geographies consisting of 156,819,513 people shows a poor positive correlation between the proportion of Immigrants from Bosnia and Herzegovina and percentage of population with cognitive disability in the United States with a correlation coefficient (R) of 0.180 and weighted average of 17.4%, a difference of 4.0%.
Cognitive Disability Correlation Summary
| Measurement | Dutch West Indian | Immigrants from Bosnia and Herzegovina |
| Minimum | 5.3% | 11.1% |
| Maximum | 25.8% | 23.8% |
| Range | 20.5% | 12.7% |
| Mean | 16.5% | 17.0% |
| Median | 17.1% | 17.0% |
| Interquartile 25% (IQ1) | 14.0% | 15.6% |
| Interquartile 75% (IQ3) | 18.3% | 18.6% |
| Interquartile Range (IQR) | 4.2% | 3.0% |
| Standard Deviation (Sample) | 3.8% | 2.7% |
| Standard Deviation (Population) | 3.7% | 2.6% |
Similar Demographics by Cognitive Disability
Demographics Similar to Dutch West Indians by Cognitive Disability
In terms of cognitive disability, the demographic groups most similar to Dutch West Indians are Immigrants from West Indies (18.1%, a difference of 0.010%), Native/Alaskan (18.1%, a difference of 0.020%), Kenyan (18.1%, a difference of 0.040%), Immigrants from Africa (18.1%, a difference of 0.050%), and Bermudan (18.1%, a difference of 0.080%).
| Demographics | Rating | Rank | Cognitive Disability |
| West Indians | 0.1 /100 | #280 | Tragic 18.1% |
| Yakama | 0.1 /100 | #281 | Tragic 18.1% |
| Immigrants | Cambodia | 0.1 /100 | #282 | Tragic 18.1% |
| Nigerians | 0.1 /100 | #283 | Tragic 18.1% |
| Immigrants | Uganda | 0.1 /100 | #284 | Tragic 18.1% |
| Bermudans | 0.1 /100 | #285 | Tragic 18.1% |
| Kenyans | 0.1 /100 | #286 | Tragic 18.1% |
| Dutch West Indians | 0.1 /100 | #287 | Tragic 18.1% |
| Immigrants | West Indies | 0.1 /100 | #288 | Tragic 18.1% |
| Natives/Alaskans | 0.1 /100 | #289 | Tragic 18.1% |
| Immigrants | Africa | 0.1 /100 | #290 | Tragic 18.1% |
| Ottawa | 0.1 /100 | #291 | Tragic 18.2% |
| Iroquois | 0.1 /100 | #292 | Tragic 18.2% |
| Central American Indians | 0.1 /100 | #293 | Tragic 18.2% |
| British West Indians | 0.1 /100 | #294 | Tragic 18.2% |
Demographics Similar to Immigrants from Bosnia and Herzegovina by Cognitive Disability
In terms of cognitive disability, the demographic groups most similar to Immigrants from Bosnia and Herzegovina are New Zealander (17.4%, a difference of 0.040%), Delaware (17.4%, a difference of 0.14%), Immigrants from Haiti (17.4%, a difference of 0.19%), Nonimmigrants (17.4%, a difference of 0.20%), and Guyanese (17.5%, a difference of 0.20%).
| Demographics | Rating | Rank | Cognitive Disability |
| Immigrants | Fiji | 33.7 /100 | #187 | Fair 17.4% |
| Immigrants | France | 29.8 /100 | #188 | Fair 17.4% |
| Immigrants | Western Asia | 29.5 /100 | #189 | Fair 17.4% |
| Immigrants | Spain | 27.7 /100 | #190 | Fair 17.4% |
| Immigrants | Nonimmigrants | 27.4 /100 | #191 | Fair 17.4% |
| Immigrants | Haiti | 27.1 /100 | #192 | Fair 17.4% |
| Delaware | 25.6 /100 | #193 | Fair 17.4% |
| Immigrants | Bosnia and Herzegovina | 22.0 /100 | #194 | Fair 17.4% |
| New Zealanders | 21.1 /100 | #195 | Fair 17.4% |
| Guyanese | 17.5 /100 | #196 | Poor 17.5% |
| Immigrants | Afghanistan | 16.7 /100 | #197 | Poor 17.5% |
| Immigrants | Panama | 14.8 /100 | #198 | Poor 17.5% |
| Immigrants | Singapore | 14.3 /100 | #199 | Poor 17.5% |
| Haitians | 14.1 /100 | #200 | Poor 17.5% |
| South American Indians | 13.0 /100 | #201 | Poor 17.5% |