Canadian vs Norwegian Disability Age 35 to 64
COMPARE
Canadian
Norwegian
Disability Age 35 to 64
Disability Age 35 to 64 Comparison
Canadians
Norwegians
11.7%
DISABILITY AGE 35 TO 64
13.0/ 100
METRIC RATING
211th/ 347
METRIC RANK
11.5%
DISABILITY AGE 35 TO 64
29.7/ 100
METRIC RATING
192nd/ 347
METRIC RANK
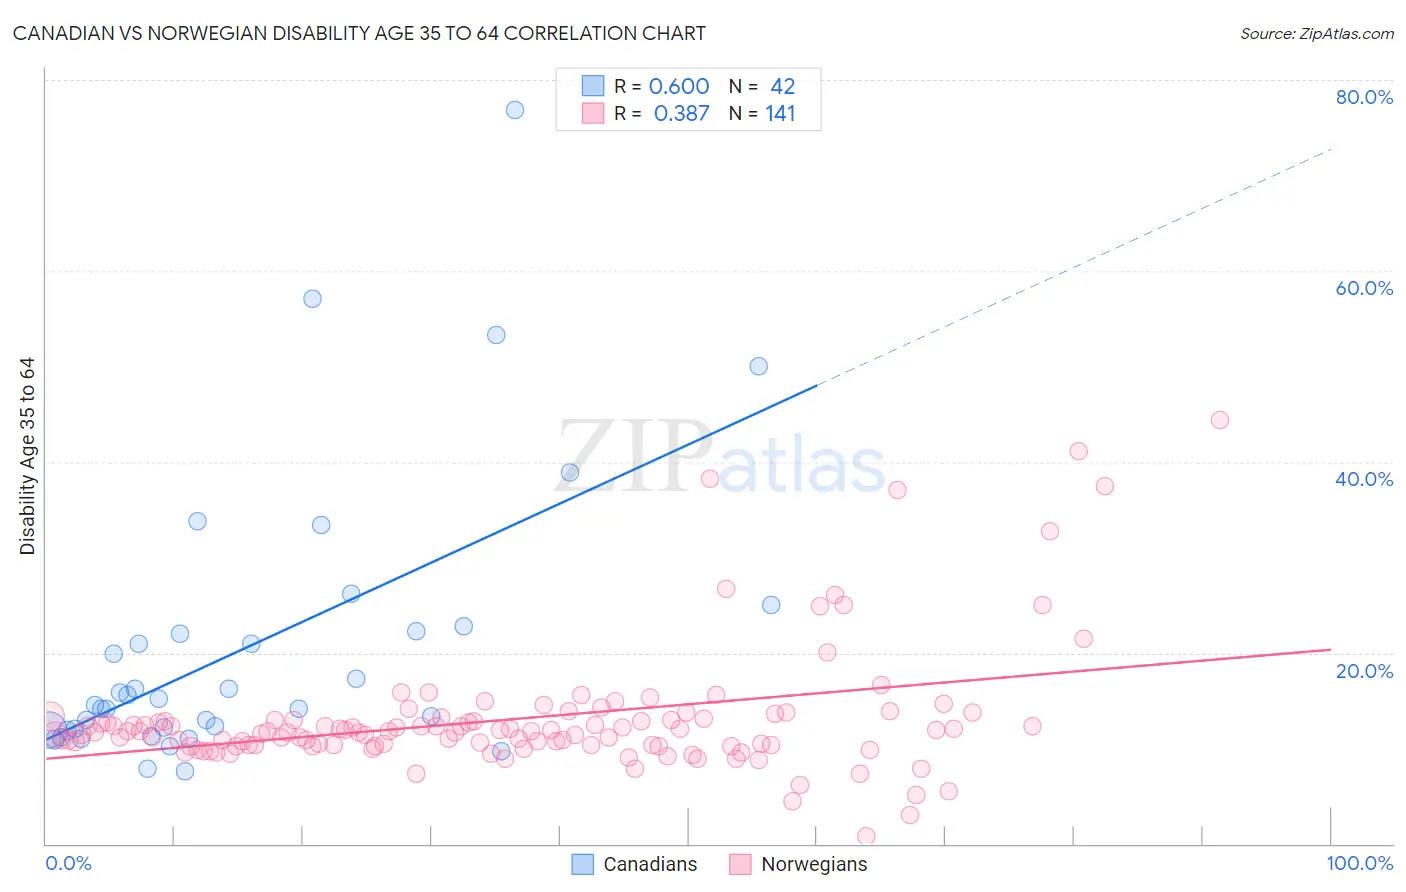
Canadian vs Norwegian Disability Age 35 to 64 Correlation Chart
The statistical analysis conducted on geographies consisting of 437,173,623 people shows a significant positive correlation between the proportion of Canadians and percentage of population with a disability between the ages 34 and 64 in the United States with a correlation coefficient (R) of 0.600 and weighted average of 11.7%. Similarly, the statistical analysis conducted on geographies consisting of 532,616,065 people shows a mild positive correlation between the proportion of Norwegians and percentage of population with a disability between the ages 34 and 64 in the United States with a correlation coefficient (R) of 0.387 and weighted average of 11.5%, a difference of 2.1%.
Disability Age 35 to 64 Correlation Summary
| Measurement | Canadian | Norwegian |
| Minimum | 7.6% | 0.85% |
| Maximum | 76.9% | 44.4% |
| Range | 69.3% | 43.6% |
| Mean | 20.6% | 13.1% |
| Median | 14.8% | 11.8% |
| Interquartile 25% (IQ1) | 11.9% | 10.3% |
| Interquartile 75% (IQ3) | 22.3% | 13.0% |
| Interquartile Range (IQR) | 10.4% | 2.7% |
| Standard Deviation (Sample) | 14.8% | 6.6% |
| Standard Deviation (Population) | 14.6% | 6.5% |
Demographics Similar to Canadians and Norwegians by Disability Age 35 to 64
In terms of disability age 35 to 64, the demographic groups most similar to Canadians are Belgian (11.7%, a difference of 0.010%), European (11.7%, a difference of 0.080%), Guatemalan (11.7%, a difference of 0.27%), Native Hawaiian (11.7%, a difference of 0.30%), and Ghanaian (11.7%, a difference of 0.30%). Similarly, the demographic groups most similar to Norwegians are Immigrants from Africa (11.5%, a difference of 0.060%), Swedish (11.4%, a difference of 0.15%), Immigrants from Latin America (11.5%, a difference of 0.21%), Carpatho Rusyn (11.5%, a difference of 0.43%), and Iraqi (11.5%, a difference of 0.55%).
| Demographics | Rating | Rank | Disability Age 35 to 64 |
| Swedes | 31.3 /100 | #191 | Fair 11.4% |
| Norwegians | 29.7 /100 | #192 | Fair 11.5% |
| Immigrants | Africa | 29.0 /100 | #193 | Fair 11.5% |
| Immigrants | Latin America | 27.5 /100 | #194 | Fair 11.5% |
| Carpatho Rusyns | 25.3 /100 | #195 | Fair 11.5% |
| Iraqis | 24.2 /100 | #196 | Fair 11.5% |
| Immigrants | Iraq | 21.0 /100 | #197 | Fair 11.6% |
| Immigrants | Panama | 20.4 /100 | #198 | Fair 11.6% |
| Basques | 19.5 /100 | #199 | Poor 11.6% |
| Swiss | 18.7 /100 | #200 | Poor 11.6% |
| Immigrants | Kenya | 17.7 /100 | #201 | Poor 11.6% |
| Immigrants | Guatemala | 17.5 /100 | #202 | Poor 11.6% |
| British | 17.0 /100 | #203 | Poor 11.6% |
| Nigerians | 16.3 /100 | #204 | Poor 11.6% |
| Slavs | 15.5 /100 | #205 | Poor 11.7% |
| Native Hawaiians | 14.8 /100 | #206 | Poor 11.7% |
| Ghanaians | 14.8 /100 | #207 | Poor 11.7% |
| Guatemalans | 14.6 /100 | #208 | Poor 11.7% |
| Europeans | 13.5 /100 | #209 | Poor 11.7% |
| Belgians | 13.1 /100 | #210 | Poor 11.7% |
| Canadians | 13.0 /100 | #211 | Poor 11.7% |