Canadian vs Immigrants from the Azores Disability Age 35 to 64
COMPARE
Canadian
Immigrants from the Azores
Disability Age 35 to 64
Disability Age 35 to 64 Comparison
Canadians
Immigrants from the Azores
11.7%
DISABILITY AGE 35 TO 64
13.0/ 100
METRIC RATING
211th/ 347
METRIC RANK
14.3%
DISABILITY AGE 35 TO 64
0.0/ 100
METRIC RATING
311th/ 347
METRIC RANK
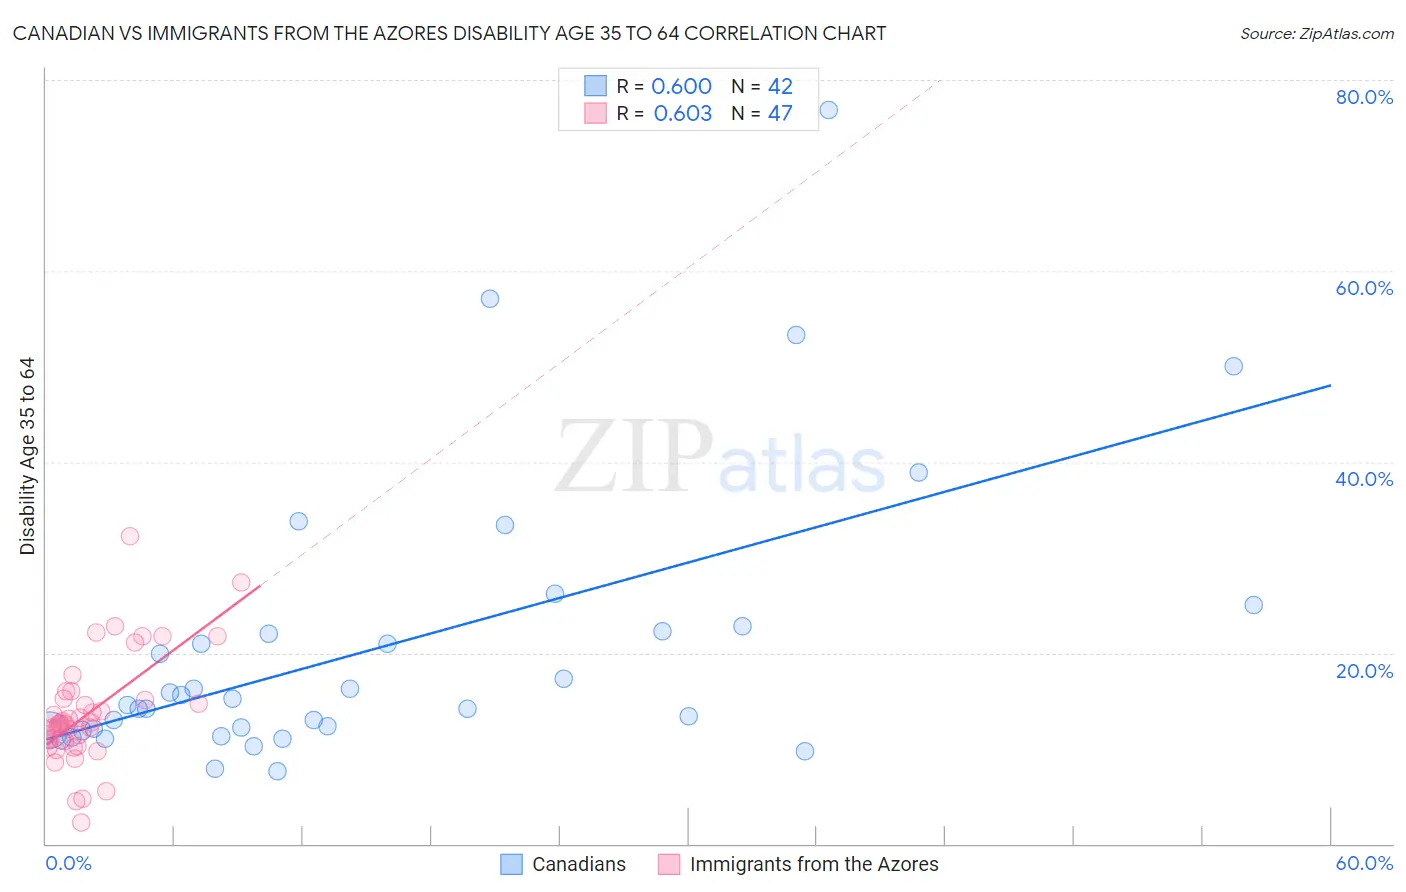
Canadian vs Immigrants from the Azores Disability Age 35 to 64 Correlation Chart
The statistical analysis conducted on geographies consisting of 437,173,623 people shows a significant positive correlation between the proportion of Canadians and percentage of population with a disability between the ages 34 and 64 in the United States with a correlation coefficient (R) of 0.600 and weighted average of 11.7%. Similarly, the statistical analysis conducted on geographies consisting of 46,256,915 people shows a significant positive correlation between the proportion of Immigrants from the Azores and percentage of population with a disability between the ages 34 and 64 in the United States with a correlation coefficient (R) of 0.603 and weighted average of 14.3%, a difference of 21.9%.
Disability Age 35 to 64 Correlation Summary
| Measurement | Canadian | Immigrants from the Azores |
| Minimum | 7.6% | 2.2% |
| Maximum | 76.9% | 32.2% |
| Range | 69.3% | 30.0% |
| Mean | 20.6% | 13.7% |
| Median | 14.8% | 12.6% |
| Interquartile 25% (IQ1) | 11.9% | 10.7% |
| Interquartile 75% (IQ3) | 22.3% | 15.2% |
| Interquartile Range (IQR) | 10.4% | 4.5% |
| Standard Deviation (Sample) | 14.8% | 5.7% |
| Standard Deviation (Population) | 14.6% | 5.7% |
Similar Demographics by Disability Age 35 to 64
Demographics Similar to Canadians by Disability Age 35 to 64
In terms of disability age 35 to 64, the demographic groups most similar to Canadians are Belgian (11.7%, a difference of 0.010%), European (11.7%, a difference of 0.080%), Immigrants from Jamaica (11.7%, a difference of 0.22%), Yugoslavian (11.7%, a difference of 0.25%), and Guatemalan (11.7%, a difference of 0.27%).
| Demographics | Rating | Rank | Disability Age 35 to 64 |
| Nigerians | 16.3 /100 | #204 | Poor 11.6% |
| Slavs | 15.5 /100 | #205 | Poor 11.7% |
| Native Hawaiians | 14.8 /100 | #206 | Poor 11.7% |
| Ghanaians | 14.8 /100 | #207 | Poor 11.7% |
| Guatemalans | 14.6 /100 | #208 | Poor 11.7% |
| Europeans | 13.5 /100 | #209 | Poor 11.7% |
| Belgians | 13.1 /100 | #210 | Poor 11.7% |
| Canadians | 13.0 /100 | #211 | Poor 11.7% |
| Immigrants | Jamaica | 11.8 /100 | #212 | Poor 11.7% |
| Yugoslavians | 11.6 /100 | #213 | Poor 11.7% |
| Immigrants | Sudan | 11.4 /100 | #214 | Poor 11.7% |
| Spanish American Indians | 11.1 /100 | #215 | Poor 11.7% |
| Bahamians | 10.7 /100 | #216 | Poor 11.8% |
| Barbadians | 9.5 /100 | #217 | Tragic 11.8% |
| Immigrants | Bahamas | 9.2 /100 | #218 | Tragic 11.8% |
Demographics Similar to Immigrants from the Azores by Disability Age 35 to 64
In terms of disability age 35 to 64, the demographic groups most similar to Immigrants from the Azores are Paiute (14.3%, a difference of 0.15%), Iroquois (14.4%, a difference of 0.58%), Cape Verdean (14.1%, a difference of 0.92%), Shoshone (14.5%, a difference of 1.3%), and Alaska Native (14.5%, a difference of 1.4%).
| Demographics | Rating | Rank | Disability Age 35 to 64 |
| Hopi | 0.0 /100 | #304 | Tragic 13.9% |
| Americans | 0.0 /100 | #305 | Tragic 13.9% |
| Immigrants | Yemen | 0.0 /100 | #306 | Tragic 14.0% |
| Blackfeet | 0.0 /100 | #307 | Tragic 14.1% |
| Inupiat | 0.0 /100 | #308 | Tragic 14.1% |
| Cree | 0.0 /100 | #309 | Tragic 14.1% |
| Cape Verdeans | 0.0 /100 | #310 | Tragic 14.1% |
| Immigrants | Azores | 0.0 /100 | #311 | Tragic 14.3% |
| Paiute | 0.0 /100 | #312 | Tragic 14.3% |
| Iroquois | 0.0 /100 | #313 | Tragic 14.4% |
| Shoshone | 0.0 /100 | #314 | Tragic 14.5% |
| Alaska Natives | 0.0 /100 | #315 | Tragic 14.5% |
| Osage | 0.0 /100 | #316 | Tragic 14.5% |
| Crow | 0.0 /100 | #317 | Tragic 14.6% |
| Ottawa | 0.0 /100 | #318 | Tragic 14.6% |