Bolivian vs Hopi Disability Age 18 to 34
COMPARE
Bolivian
Hopi
Disability Age 18 to 34
Disability Age 18 to 34 Comparison
Bolivians
Hopi
5.8%
DISABILITY AGE 18 TO 34
99.9/ 100
METRIC RATING
40th/ 347
METRIC RANK
7.5%
DISABILITY AGE 18 TO 34
0.0/ 100
METRIC RATING
284th/ 347
METRIC RANK
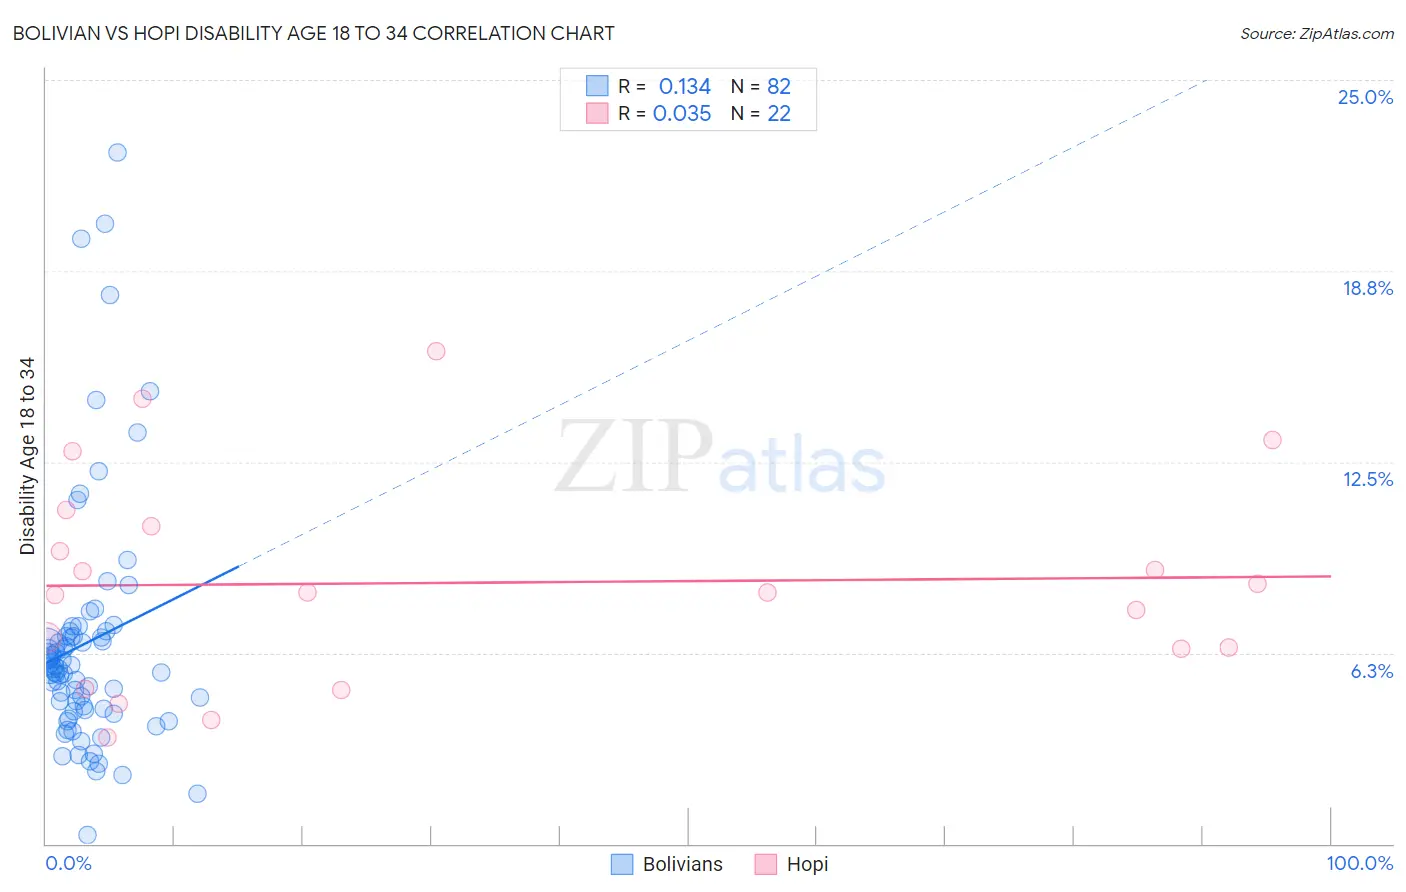
Bolivian vs Hopi Disability Age 18 to 34 Correlation Chart
The statistical analysis conducted on geographies consisting of 184,550,296 people shows a poor positive correlation between the proportion of Bolivians and percentage of population with a disability between the ages 18 and 35 in the United States with a correlation coefficient (R) of 0.134 and weighted average of 5.8%. Similarly, the statistical analysis conducted on geographies consisting of 74,687,859 people shows no correlation between the proportion of Hopi and percentage of population with a disability between the ages 18 and 35 in the United States with a correlation coefficient (R) of 0.035 and weighted average of 7.5%, a difference of 28.7%.
Disability Age 18 to 34 Correlation Summary
| Measurement | Bolivian | Hopi |
| Minimum | 0.28% | 3.5% |
| Maximum | 22.6% | 16.1% |
| Range | 22.4% | 12.7% |
| Mean | 6.6% | 8.5% |
| Median | 5.7% | 8.2% |
| Interquartile 25% (IQ1) | 4.4% | 6.4% |
| Interquartile 75% (IQ3) | 6.8% | 10.4% |
| Interquartile Range (IQR) | 2.4% | 4.0% |
| Standard Deviation (Sample) | 4.1% | 3.4% |
| Standard Deviation (Population) | 4.0% | 3.3% |
Similar Demographics by Disability Age 18 to 34
Demographics Similar to Bolivians by Disability Age 18 to 34
In terms of disability age 18 to 34, the demographic groups most similar to Bolivians are Asian (5.8%, a difference of 0.080%), Nicaraguan (5.8%, a difference of 0.18%), Immigrants from South America (5.8%, a difference of 0.38%), Colombian (5.9%, a difference of 0.40%), and Armenian (5.8%, a difference of 0.41%).
| Demographics | Rating | Rank | Disability Age 18 to 34 |
| Argentineans | 99.9 /100 | #33 | Exceptional 5.8% |
| Venezuelans | 99.9 /100 | #34 | Exceptional 5.8% |
| Immigrants | Lithuania | 99.9 /100 | #35 | Exceptional 5.8% |
| Ecuadorians | 99.9 /100 | #36 | Exceptional 5.8% |
| Armenians | 99.9 /100 | #37 | Exceptional 5.8% |
| Immigrants | South America | 99.9 /100 | #38 | Exceptional 5.8% |
| Asians | 99.9 /100 | #39 | Exceptional 5.8% |
| Bolivians | 99.9 /100 | #40 | Exceptional 5.8% |
| Nicaraguans | 99.9 /100 | #41 | Exceptional 5.8% |
| Colombians | 99.8 /100 | #42 | Exceptional 5.9% |
| South Americans | 99.8 /100 | #43 | Exceptional 5.9% |
| Immigrants | Asia | 99.8 /100 | #44 | Exceptional 5.9% |
| Immigrants | Peru | 99.8 /100 | #45 | Exceptional 5.9% |
| Immigrants | Korea | 99.8 /100 | #46 | Exceptional 5.9% |
| Immigrants | Egypt | 99.8 /100 | #47 | Exceptional 5.9% |
Demographics Similar to Hopi by Disability Age 18 to 34
In terms of disability age 18 to 34, the demographic groups most similar to Hopi are Danish (7.5%, a difference of 0.14%), Spanish (7.5%, a difference of 0.24%), Swedish (7.5%, a difference of 0.42%), Paiute (7.5%, a difference of 0.44%), and Czechoslovakian (7.4%, a difference of 0.93%).
| Demographics | Rating | Rank | Disability Age 18 to 34 |
| Immigrants | Portugal | 0.1 /100 | #277 | Tragic 7.4% |
| Lumbee | 0.1 /100 | #278 | Tragic 7.4% |
| Czechoslovakians | 0.1 /100 | #279 | Tragic 7.4% |
| Yaqui | 0.1 /100 | #280 | Tragic 7.4% |
| Paiute | 0.0 /100 | #281 | Tragic 7.5% |
| Spanish | 0.0 /100 | #282 | Tragic 7.5% |
| Danes | 0.0 /100 | #283 | Tragic 7.5% |
| Hopi | 0.0 /100 | #284 | Tragic 7.5% |
| Swedes | 0.0 /100 | #285 | Tragic 7.5% |
| Celtics | 0.0 /100 | #286 | Tragic 7.6% |
| Norwegians | 0.0 /100 | #287 | Tragic 7.6% |
| Whites/Caucasians | 0.0 /100 | #288 | Tragic 7.6% |
| Immigrants | Nonimmigrants | 0.0 /100 | #289 | Tragic 7.6% |
| Slovaks | 0.0 /100 | #290 | Tragic 7.7% |
| Irish | 0.0 /100 | #291 | Tragic 7.7% |