Belgian vs Nepalese Vision Disability
COMPARE
Belgian
Nepalese
Vision Disability
Vision Disability Comparison
Belgians
Nepalese
2.1%
VISION DISABILITY
75.9/ 100
METRIC RATING
150th/ 347
METRIC RANK
2.4%
VISION DISABILITY
0.0/ 100
METRIC RATING
279th/ 347
METRIC RANK
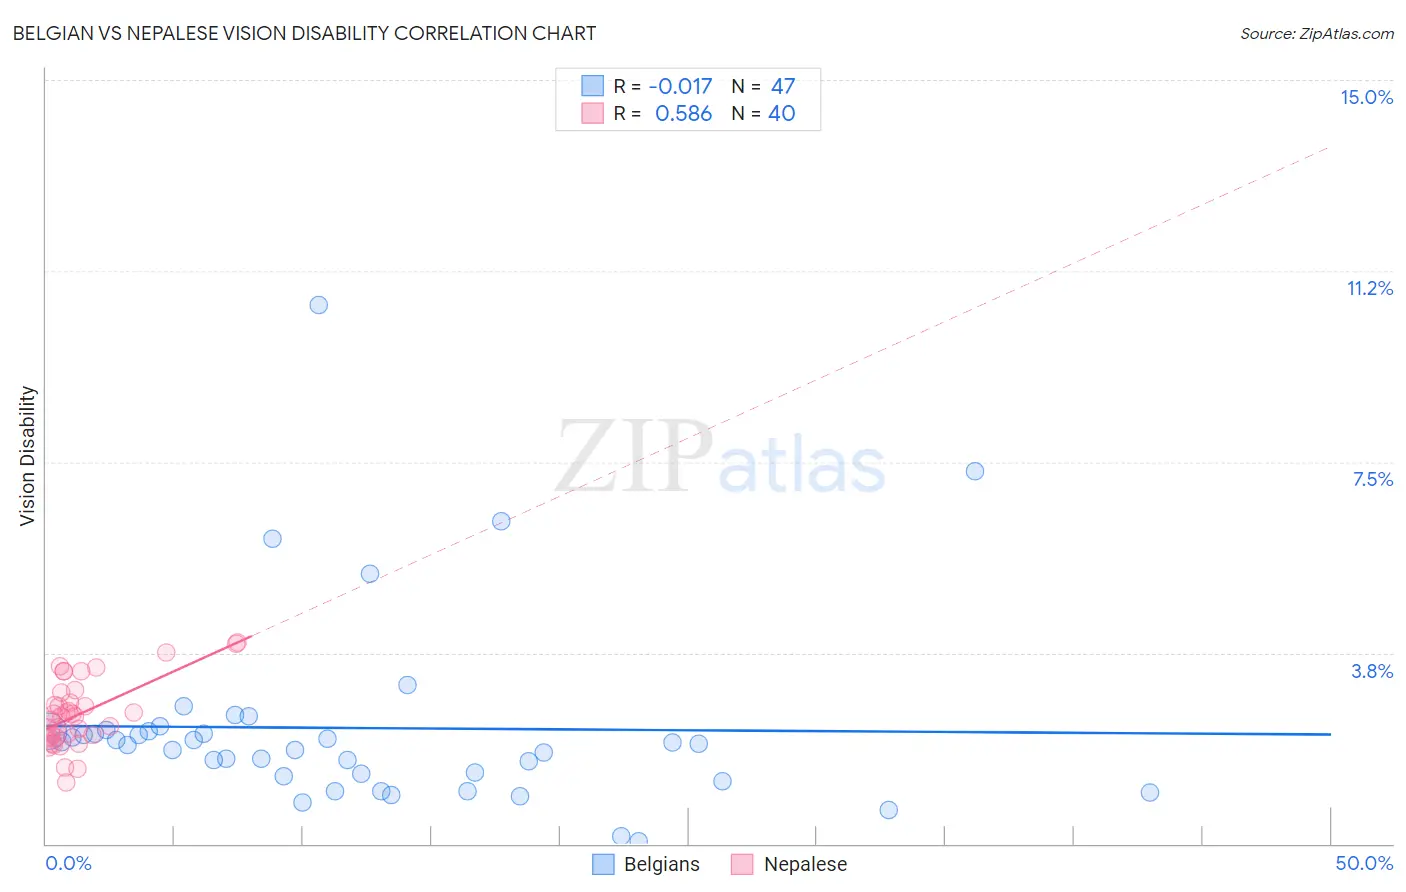
Belgian vs Nepalese Vision Disability Correlation Chart
The statistical analysis conducted on geographies consisting of 355,727,371 people shows no correlation between the proportion of Belgians and percentage of population with vision disability in the United States with a correlation coefficient (R) of -0.017 and weighted average of 2.1%. Similarly, the statistical analysis conducted on geographies consisting of 24,521,755 people shows a substantial positive correlation between the proportion of Nepalese and percentage of population with vision disability in the United States with a correlation coefficient (R) of 0.586 and weighted average of 2.4%, a difference of 14.9%.
Vision Disability Correlation Summary
| Measurement | Belgian | Nepalese |
| Minimum | 0.061% | 1.2% |
| Maximum | 10.6% | 3.9% |
| Range | 10.5% | 2.7% |
| Mean | 2.3% | 2.5% |
| Median | 2.0% | 2.5% |
| Interquartile 25% (IQ1) | 1.3% | 2.1% |
| Interquartile 75% (IQ3) | 2.2% | 2.9% |
| Interquartile Range (IQR) | 0.89% | 0.78% |
| Standard Deviation (Sample) | 1.9% | 0.66% |
| Standard Deviation (Population) | 1.9% | 0.65% |
Similar Demographics by Vision Disability
Demographics Similar to Belgians by Vision Disability
In terms of vision disability, the demographic groups most similar to Belgians are Colombian (2.1%, a difference of 0.030%), Immigrants from Norway (2.1%, a difference of 0.040%), Immigrants from Southern Europe (2.1%, a difference of 0.11%), Immigrants from South America (2.1%, a difference of 0.18%), and Slovene (2.1%, a difference of 0.19%).
| Demographics | Rating | Rank | Vision Disability |
| Immigrants | Sierra Leone | 82.8 /100 | #143 | Excellent 2.1% |
| Ukrainians | 81.9 /100 | #144 | Excellent 2.1% |
| Immigrants | Bosnia and Herzegovina | 81.5 /100 | #145 | Excellent 2.1% |
| Italians | 79.7 /100 | #146 | Good 2.1% |
| Immigrants | Sudan | 78.4 /100 | #147 | Good 2.1% |
| Finns | 78.3 /100 | #148 | Good 2.1% |
| Colombians | 76.2 /100 | #149 | Good 2.1% |
| Belgians | 75.9 /100 | #150 | Good 2.1% |
| Immigrants | Norway | 75.5 /100 | #151 | Good 2.1% |
| Immigrants | Southern Europe | 74.6 /100 | #152 | Good 2.1% |
| Immigrants | South America | 73.8 /100 | #153 | Good 2.1% |
| Slovenes | 73.6 /100 | #154 | Good 2.1% |
| Immigrants | Colombia | 72.1 /100 | #155 | Good 2.1% |
| Pakistanis | 71.6 /100 | #156 | Good 2.1% |
| Serbians | 70.2 /100 | #157 | Good 2.1% |
Demographics Similar to Nepalese by Vision Disability
In terms of vision disability, the demographic groups most similar to Nepalese are Spanish (2.4%, a difference of 0.010%), Cape Verdean (2.4%, a difference of 0.040%), Bahamian (2.4%, a difference of 0.17%), Scotch-Irish (2.4%, a difference of 0.21%), and U.S. Virgin Islander (2.5%, a difference of 0.27%).
| Demographics | Rating | Rank | Vision Disability |
| Spaniards | 0.1 /100 | #272 | Tragic 2.4% |
| Immigrants | Bahamas | 0.1 /100 | #273 | Tragic 2.4% |
| Immigrants | Latin America | 0.0 /100 | #274 | Tragic 2.4% |
| Chippewa | 0.0 /100 | #275 | Tragic 2.4% |
| Scotch-Irish | 0.0 /100 | #276 | Tragic 2.4% |
| Bahamians | 0.0 /100 | #277 | Tragic 2.4% |
| Spanish | 0.0 /100 | #278 | Tragic 2.4% |
| Nepalese | 0.0 /100 | #279 | Tragic 2.4% |
| Cape Verdeans | 0.0 /100 | #280 | Tragic 2.4% |
| U.S. Virgin Islanders | 0.0 /100 | #281 | Tragic 2.5% |
| Immigrants | Caribbean | 0.0 /100 | #282 | Tragic 2.5% |
| Puget Sound Salish | 0.0 /100 | #283 | Tragic 2.5% |
| Yakama | 0.0 /100 | #284 | Tragic 2.5% |
| Immigrants | Central America | 0.0 /100 | #285 | Tragic 2.5% |
| Sioux | 0.0 /100 | #286 | Tragic 2.5% |