Aleut vs Israeli Disability Age Under 5
COMPARE
Aleut
Israeli
Disability Age Under 5
Disability Age Under 5 Comparison
Aleuts
Israelis
1.2%
DISABILITY AGE UNDER 5
90.7/ 100
METRIC RATING
122nd/ 347
METRIC RANK
1.1%
DISABILITY AGE UNDER 5
98.7/ 100
METRIC RATING
69th/ 347
METRIC RANK
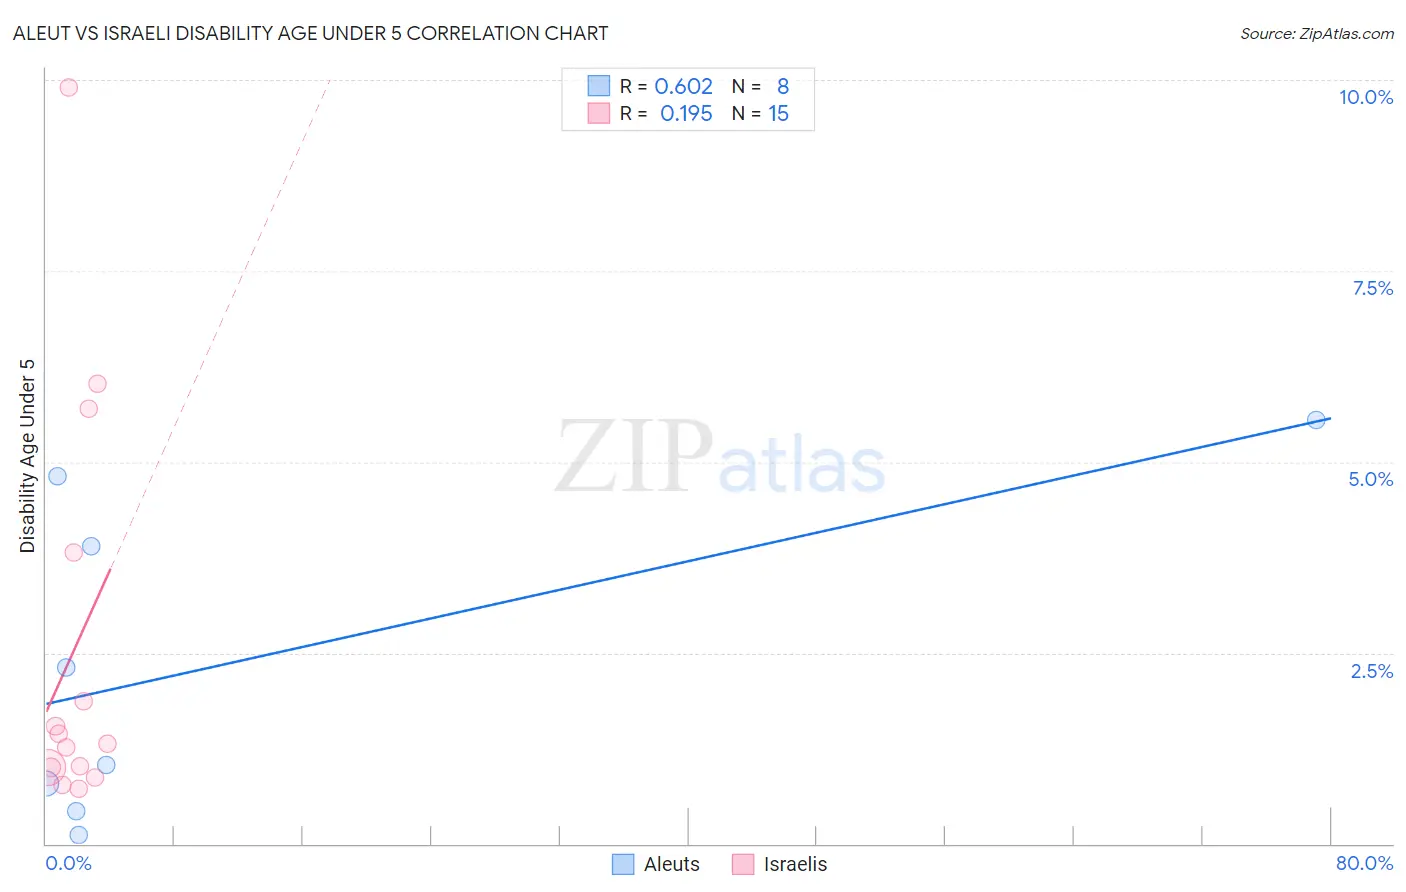
Aleut vs Israeli Disability Age Under 5 Correlation Chart
The statistical analysis conducted on geographies consisting of 51,541,789 people shows a significant positive correlation between the proportion of Aleuts and percentage of population with a disability under the age of 5 in the United States with a correlation coefficient (R) of 0.602 and weighted average of 1.2%. Similarly, the statistical analysis conducted on geographies consisting of 133,940,307 people shows a poor positive correlation between the proportion of Israelis and percentage of population with a disability under the age of 5 in the United States with a correlation coefficient (R) of 0.195 and weighted average of 1.1%, a difference of 5.1%.
Disability Age Under 5 Correlation Summary
| Measurement | Aleut | Israeli |
| Minimum | 0.11% | 0.72% |
| Maximum | 5.6% | 9.9% |
| Range | 5.4% | 9.2% |
| Mean | 2.4% | 2.5% |
| Median | 1.7% | 1.3% |
| Interquartile 25% (IQ1) | 0.61% | 1.00% |
| Interquartile 75% (IQ3) | 4.4% | 3.8% |
| Interquartile Range (IQR) | 3.7% | 2.8% |
| Standard Deviation (Sample) | 2.1% | 2.7% |
| Standard Deviation (Population) | 2.0% | 2.6% |
Similar Demographics by Disability Age Under 5
Demographics Similar to Aleuts by Disability Age Under 5
In terms of disability age under 5, the demographic groups most similar to Aleuts are Zimbabwean (1.2%, a difference of 0.050%), Immigrants from Cambodia (1.2%, a difference of 0.070%), Japanese (1.2%, a difference of 0.13%), Immigrants from Senegal (1.2%, a difference of 0.19%), and Central American (1.2%, a difference of 0.29%).
| Demographics | Rating | Rank | Disability Age Under 5 |
| Immigrants | Caribbean | 93.8 /100 | #115 | Exceptional 1.2% |
| Immigrants | Northern Africa | 93.8 /100 | #116 | Exceptional 1.2% |
| Immigrants | Philippines | 93.5 /100 | #117 | Exceptional 1.2% |
| Immigrants | Venezuela | 93.4 /100 | #118 | Exceptional 1.2% |
| Bhutanese | 92.5 /100 | #119 | Exceptional 1.2% |
| Immigrants | Eritrea | 92.3 /100 | #120 | Exceptional 1.2% |
| Immigrants | Senegal | 91.4 /100 | #121 | Exceptional 1.2% |
| Aleuts | 90.7 /100 | #122 | Exceptional 1.2% |
| Zimbabweans | 90.6 /100 | #123 | Exceptional 1.2% |
| Immigrants | Cambodia | 90.5 /100 | #124 | Exceptional 1.2% |
| Japanese | 90.3 /100 | #125 | Exceptional 1.2% |
| Central Americans | 89.7 /100 | #126 | Excellent 1.2% |
| Immigrants | Romania | 88.4 /100 | #127 | Excellent 1.2% |
| Immigrants | France | 88.4 /100 | #128 | Excellent 1.2% |
| Immigrants | Immigrants | 88.0 /100 | #129 | Excellent 1.2% |
Demographics Similar to Israelis by Disability Age Under 5
In terms of disability age under 5, the demographic groups most similar to Israelis are South African (1.1%, a difference of 0.030%), Immigrants from Belize (1.1%, a difference of 0.060%), Immigrants from Ecuador (1.1%, a difference of 0.090%), Immigrants from Indonesia (1.1%, a difference of 0.13%), and Trinidadian and Tobagonian (1.1%, a difference of 0.15%).
| Demographics | Rating | Rank | Disability Age Under 5 |
| Immigrants | Switzerland | 99.2 /100 | #62 | Exceptional 1.1% |
| Immigrants | Vietnam | 99.1 /100 | #63 | Exceptional 1.1% |
| Egyptians | 98.9 /100 | #64 | Exceptional 1.1% |
| Immigrants | Korea | 98.8 /100 | #65 | Exceptional 1.1% |
| Immigrants | Indonesia | 98.7 /100 | #66 | Exceptional 1.1% |
| Immigrants | Belize | 98.7 /100 | #67 | Exceptional 1.1% |
| South Africans | 98.7 /100 | #68 | Exceptional 1.1% |
| Israelis | 98.7 /100 | #69 | Exceptional 1.1% |
| Immigrants | Ecuador | 98.6 /100 | #70 | Exceptional 1.1% |
| Trinidadians and Tobagonians | 98.6 /100 | #71 | Exceptional 1.1% |
| Burmese | 98.5 /100 | #72 | Exceptional 1.1% |
| Immigrants | Sri Lanka | 98.5 /100 | #73 | Exceptional 1.1% |
| Jordanians | 98.5 /100 | #74 | Exceptional 1.1% |
| Immigrants | Pakistan | 98.4 /100 | #75 | Exceptional 1.1% |
| Immigrants | Burma/Myanmar | 98.2 /100 | #76 | Exceptional 1.1% |