African vs Burmese Disability Age Under 5
COMPARE
African
Burmese
Disability Age Under 5
Disability Age Under 5 Comparison
Africans
Burmese
1.4%
DISABILITY AGE UNDER 5
1.0/ 100
METRIC RATING
250th/ 347
METRIC RANK
1.1%
DISABILITY AGE UNDER 5
98.5/ 100
METRIC RATING
72nd/ 347
METRIC RANK
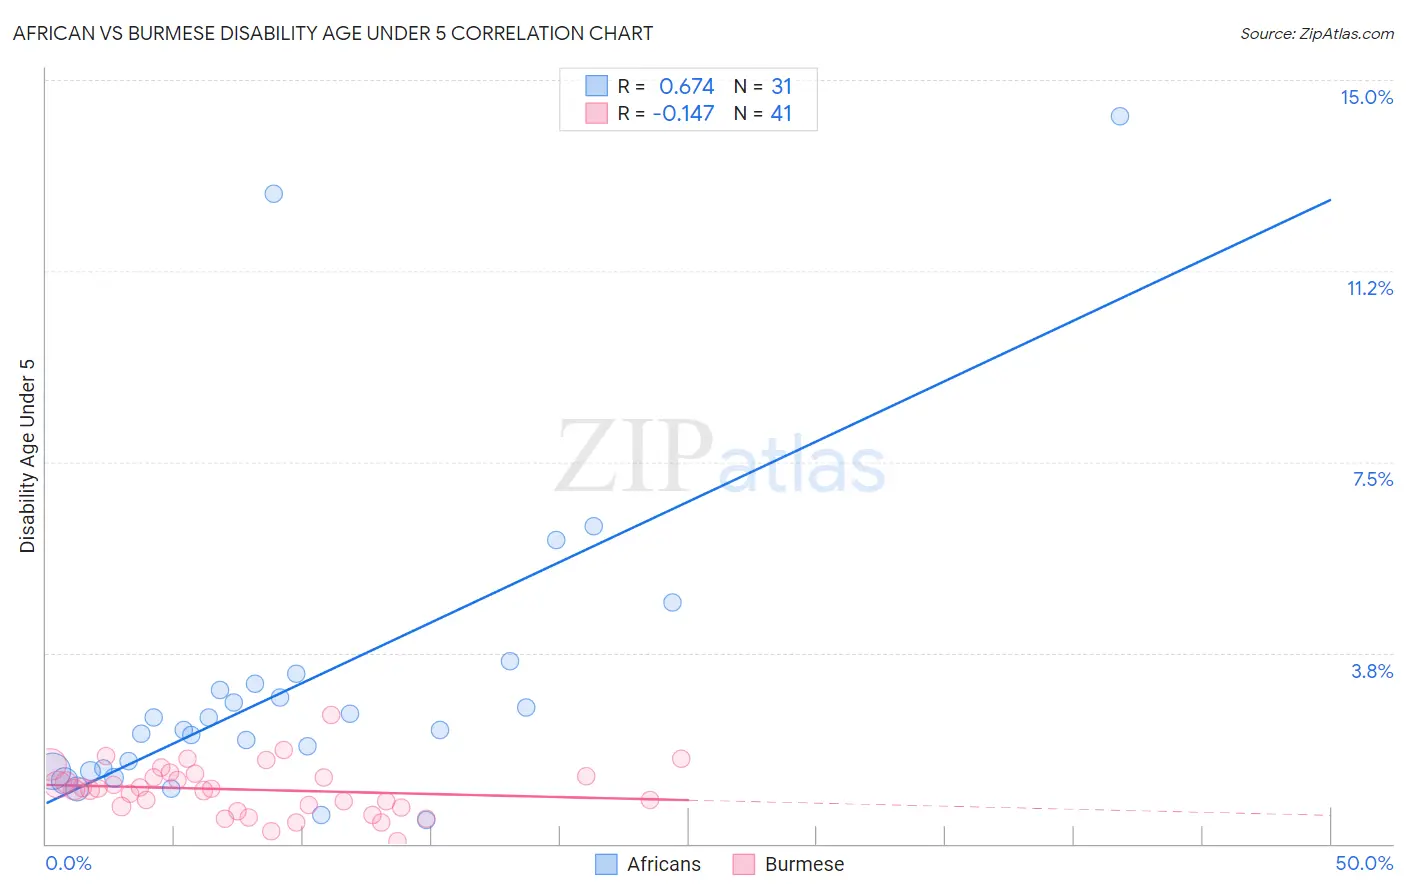
African vs Burmese Disability Age Under 5 Correlation Chart
The statistical analysis conducted on geographies consisting of 243,296,599 people shows a significant positive correlation between the proportion of Africans and percentage of population with a disability under the age of 5 in the United States with a correlation coefficient (R) of 0.674 and weighted average of 1.4%. Similarly, the statistical analysis conducted on geographies consisting of 238,564,185 people shows a poor negative correlation between the proportion of Burmese and percentage of population with a disability under the age of 5 in the United States with a correlation coefficient (R) of -0.147 and weighted average of 1.1%, a difference of 22.0%.
Disability Age Under 5 Correlation Summary
| Measurement | African | Burmese |
| Minimum | 0.47% | 0.058% |
| Maximum | 14.3% | 2.5% |
| Range | 13.8% | 2.5% |
| Mean | 3.1% | 1.1% |
| Median | 2.2% | 1.1% |
| Interquartile 25% (IQ1) | 1.4% | 0.72% |
| Interquartile 75% (IQ3) | 3.1% | 1.4% |
| Interquartile Range (IQR) | 1.7% | 0.63% |
| Standard Deviation (Sample) | 3.1% | 0.49% |
| Standard Deviation (Population) | 3.0% | 0.48% |
Similar Demographics by Disability Age Under 5
Demographics Similar to Africans by Disability Age Under 5
In terms of disability age under 5, the demographic groups most similar to Africans are Bermudan (1.4%, a difference of 0.010%), Immigrants from Hungary (1.4%, a difference of 0.030%), Immigrants from Scotland (1.4%, a difference of 0.070%), Eastern European (1.4%, a difference of 0.090%), and Immigrants from England (1.4%, a difference of 0.12%).
| Demographics | Rating | Rank | Disability Age Under 5 |
| Immigrants | Cameroon | 1.7 /100 | #243 | Tragic 1.4% |
| Spaniards | 1.4 /100 | #244 | Tragic 1.4% |
| Potawatomi | 1.1 /100 | #245 | Tragic 1.4% |
| Russians | 1.0 /100 | #246 | Tragic 1.4% |
| Immigrants | England | 1.0 /100 | #247 | Tragic 1.4% |
| Eastern Europeans | 1.0 /100 | #248 | Tragic 1.4% |
| Bermudans | 1.0 /100 | #249 | Tragic 1.4% |
| Africans | 1.0 /100 | #250 | Tragic 1.4% |
| Immigrants | Hungary | 1.0 /100 | #251 | Tragic 1.4% |
| Immigrants | Scotland | 0.9 /100 | #252 | Tragic 1.4% |
| Australians | 0.7 /100 | #253 | Tragic 1.4% |
| Immigrants | Brazil | 0.7 /100 | #254 | Tragic 1.4% |
| Immigrants | Liberia | 0.6 /100 | #255 | Tragic 1.4% |
| Immigrants | Western Europe | 0.5 /100 | #256 | Tragic 1.4% |
| Slovenes | 0.3 /100 | #257 | Tragic 1.4% |
Demographics Similar to Burmese by Disability Age Under 5
In terms of disability age under 5, the demographic groups most similar to Burmese are Immigrants from Sri Lanka (1.1%, a difference of 0.080%), Jordanian (1.1%, a difference of 0.090%), Trinidadian and Tobagonian (1.1%, a difference of 0.16%), Immigrants from Pakistan (1.1%, a difference of 0.17%), and Immigrants from Ecuador (1.1%, a difference of 0.22%).
| Demographics | Rating | Rank | Disability Age Under 5 |
| Immigrants | Korea | 98.8 /100 | #65 | Exceptional 1.1% |
| Immigrants | Indonesia | 98.7 /100 | #66 | Exceptional 1.1% |
| Immigrants | Belize | 98.7 /100 | #67 | Exceptional 1.1% |
| South Africans | 98.7 /100 | #68 | Exceptional 1.1% |
| Israelis | 98.7 /100 | #69 | Exceptional 1.1% |
| Immigrants | Ecuador | 98.6 /100 | #70 | Exceptional 1.1% |
| Trinidadians and Tobagonians | 98.6 /100 | #71 | Exceptional 1.1% |
| Burmese | 98.5 /100 | #72 | Exceptional 1.1% |
| Immigrants | Sri Lanka | 98.5 /100 | #73 | Exceptional 1.1% |
| Jordanians | 98.5 /100 | #74 | Exceptional 1.1% |
| Immigrants | Pakistan | 98.4 /100 | #75 | Exceptional 1.1% |
| Immigrants | Burma/Myanmar | 98.2 /100 | #76 | Exceptional 1.1% |
| Immigrants | Denmark | 98.1 /100 | #77 | Exceptional 1.1% |
| West Indians | 98.0 /100 | #78 | Exceptional 1.1% |
| Hmong | 98.0 /100 | #79 | Exceptional 1.1% |