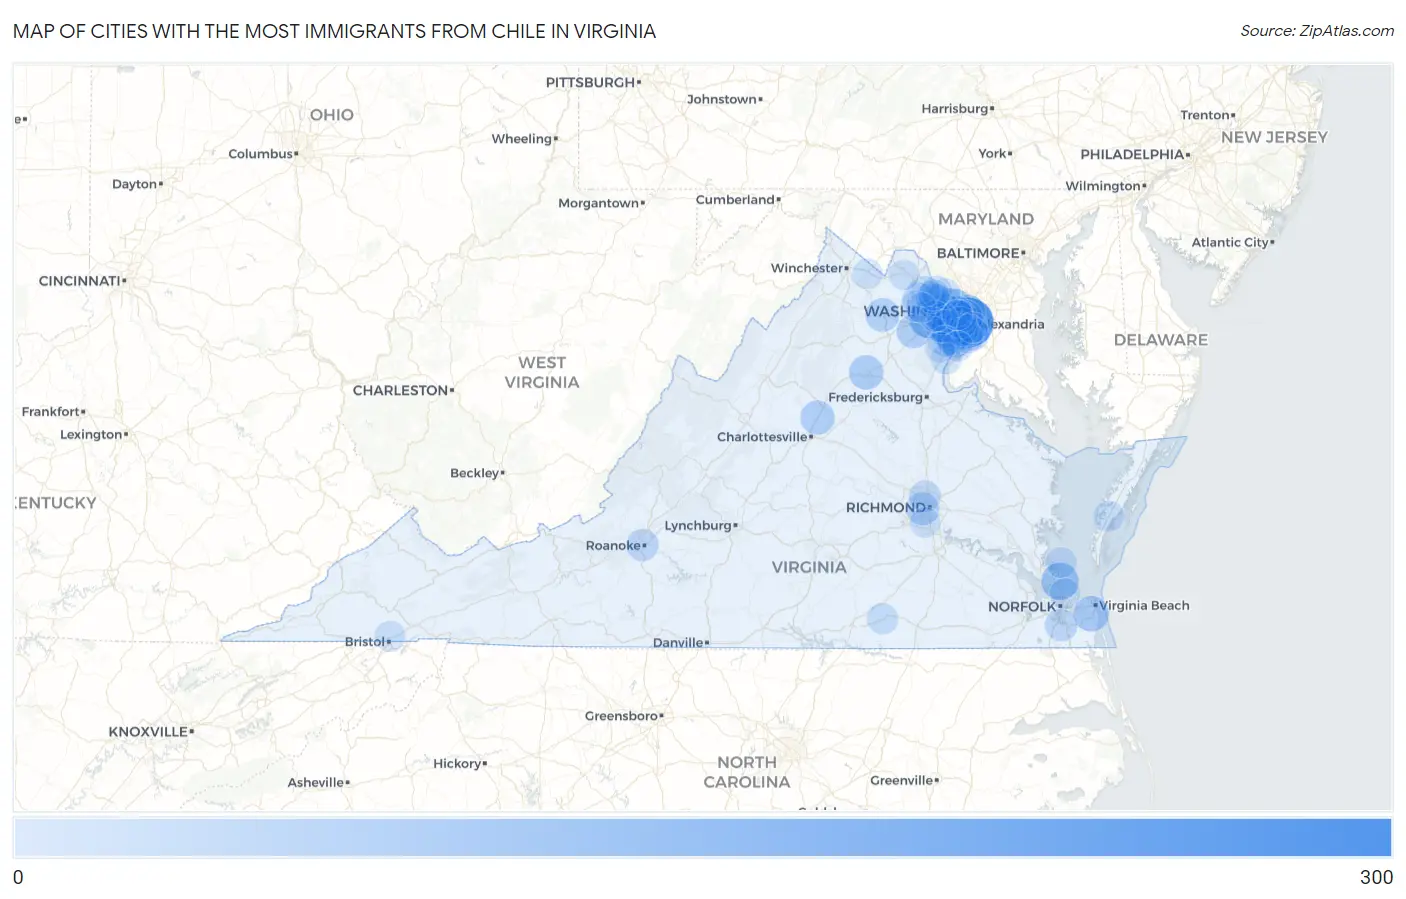
Cities with the Most Immigrants from Chile in Virginia
RELATED REPORTS & OPTIONS
Chile
Virginia
Compare Cities
Map of Cities with the Most Immigrants from Chile in Virginia
0
300
Cities with the Most Immigrants from Chile in Virginia
| City | Chile | vs State | vs National | |
| 1. | Alexandria | 276 | 3,529(7.82%)#1 | 106,565(0.26%)#43 |
| 2. | Leesylvania | 146 | 3,529(4.14%)#2 | 106,565(0.14%)#124 |
| 3. | Centreville | 119 | 3,529(3.37%)#3 | 106,565(0.11%)#161 |
| 4. | Tysons | 108 | 3,529(3.06%)#4 | 106,565(0.10%)#182 |
| 5. | Hampton | 100 | 3,529(2.83%)#5 | 106,565(0.09%)#200 |
| 6. | Kings Park West | 100 | 3,529(2.83%)#6 | 106,565(0.09%)#202 |
| 7. | Annandale | 84 | 3,529(2.38%)#7 | 106,565(0.08%)#245 |
| 8. | Arlington | 79 | 3,529(2.24%)#8 | 106,565(0.07%)#264 |
| 9. | Virginia Beach | 75 | 3,529(2.13%)#9 | 106,565(0.07%)#280 |
| 10. | Rose Hill Cdp Fairfax County | 75 | 3,529(2.13%)#10 | 106,565(0.07%)#284 |
| 11. | Bailey S Crossroads | 73 | 3,529(2.07%)#11 | 106,565(0.07%)#290 |
| 12. | Burke | 70 | 3,529(1.98%)#12 | 106,565(0.07%)#305 |
| 13. | Newington Forest | 68 | 3,529(1.93%)#13 | 106,565(0.06%)#318 |
| 14. | Lorton | 66 | 3,529(1.87%)#14 | 106,565(0.06%)#328 |
| 15. | Fairfax | 64 | 3,529(1.81%)#15 | 106,565(0.06%)#341 |
| 16. | Culpeper | 59 | 3,529(1.67%)#16 | 106,565(0.06%)#366 |
| 17. | Piney Mountain | 56 | 3,529(1.59%)#17 | 106,565(0.05%)#384 |
| 18. | Reston | 55 | 3,529(1.56%)#18 | 106,565(0.05%)#389 |
| 19. | Linton Hall | 53 | 3,529(1.50%)#19 | 106,565(0.05%)#402 |
| 20. | Franconia | 53 | 3,529(1.50%)#20 | 106,565(0.05%)#406 |
| 21. | Long Branch | 50 | 3,529(1.42%)#21 | 106,565(0.05%)#426 |
| 22. | Marshall | 49 | 3,529(1.39%)#22 | 106,565(0.05%)#438 |
| 23. | Richmond | 43 | 3,529(1.22%)#23 | 106,565(0.04%)#486 |
| 24. | Fort Hunt | 43 | 3,529(1.22%)#24 | 106,565(0.04%)#497 |
| 25. | Burke Centre | 41 | 3,529(1.16%)#25 | 106,565(0.04%)#527 |
| 26. | South Run | 41 | 3,529(1.16%)#26 | 106,565(0.04%)#531 |
| 27. | Chesapeake | 33 | 3,529(0.94%)#27 | 106,565(0.03%)#617 |
| 28. | Brambleton | 32 | 3,529(0.91%)#28 | 106,565(0.03%)#633 |
| 29. | Oakton | 31 | 3,529(0.88%)#29 | 106,565(0.03%)#646 |
| 30. | West Springfield | 30 | 3,529(0.85%)#30 | 106,565(0.03%)#663 |
| 31. | Roanoke | 29 | 3,529(0.82%)#31 | 106,565(0.03%)#669 |
| 32. | Laurel Hill | 28 | 3,529(0.79%)#32 | 106,565(0.03%)#700 |
| 33. | Fairfax Station | 27 | 3,529(0.77%)#33 | 106,565(0.03%)#709 |
| 34. | Herndon | 26 | 3,529(0.74%)#34 | 106,565(0.02%)#730 |
| 35. | Kingstowne | 26 | 3,529(0.74%)#35 | 106,565(0.02%)#733 |
| 36. | Fair Oaks | 24 | 3,529(0.68%)#36 | 106,565(0.02%)#761 |
| 37. | Newington | 23 | 3,529(0.65%)#37 | 106,565(0.02%)#792 |
| 38. | Lakeside | 23 | 3,529(0.65%)#38 | 106,565(0.02%)#793 |
| 39. | Stone Ridge | 18 | 3,529(0.51%)#39 | 106,565(0.02%)#914 |
| 40. | Wolf Trap | 17 | 3,529(0.48%)#40 | 106,565(0.02%)#950 |
| 41. | Mount Vernon | 17 | 3,529(0.48%)#41 | 106,565(0.02%)#951 |
| 42. | Lake Barcroft | 17 | 3,529(0.48%)#42 | 106,565(0.02%)#953 |
| 43. | Lincolnia | 15 | 3,529(0.43%)#43 | 106,565(0.01%)#1,012 |
| 44. | Idylwood | 15 | 3,529(0.43%)#44 | 106,565(0.01%)#1,015 |
| 45. | Groveton | 15 | 3,529(0.43%)#45 | 106,565(0.01%)#1,019 |
| 46. | George Mason | 15 | 3,529(0.43%)#46 | 106,565(0.01%)#1,024 |
| 47. | Lawrenceville | 15 | 3,529(0.43%)#47 | 106,565(0.01%)#1,035 |
| 48. | Cherry Hill | 14 | 3,529(0.40%)#48 | 106,565(0.01%)#1,051 |
| 49. | Great Falls | 14 | 3,529(0.40%)#49 | 106,565(0.01%)#1,055 |
| 50. | Oak Grove | 14 | 3,529(0.40%)#50 | 106,565(0.01%)#1,068 |
| 51. | Lake Ridge | 13 | 3,529(0.37%)#51 | 106,565(0.01%)#1,083 |
| 52. | Sugarland Run | 13 | 3,529(0.37%)#52 | 106,565(0.01%)#1,103 |
| 53. | Fair Lakes | 13 | 3,529(0.37%)#53 | 106,565(0.01%)#1,107 |
| 54. | Sterling | 12 | 3,529(0.34%)#54 | 106,565(0.01%)#1,134 |
| 55. | Ashburn | 10 | 3,529(0.28%)#55 | 106,565(0.01%)#1,216 |
| 56. | Bristol | 9 | 3,529(0.26%)#56 | 106,565(0.01%)#1,273 |
| 57. | Poquoson | 9 | 3,529(0.26%)#57 | 106,565(0.01%)#1,278 |
| 58. | Norfolk | 8 | 3,529(0.23%)#58 | 106,565(0.01%)#1,294 |
| 59. | Belle Haven | 8 | 3,529(0.23%)#59 | 106,565(0.01%)#1,330 |
| 60. | Mason Neck | 8 | 3,529(0.23%)#60 | 106,565(0.01%)#1,336 |
| 61. | Nassawadox | 8 | 3,529(0.23%)#61 | 106,565(0.01%)#1,339 |
| 62. | Hamilton | 7 | 3,529(0.20%)#62 | 106,565(0.01%)#1,383 |
| 63. | Dale City | 6 | 3,529(0.17%)#63 | 106,565(0.01%)#1,388 |
| 64. | South Riding | 4 | 3,529(0.11%)#64 | 106,565(0.00%)#1,458 |
| 65. | West Falls Church | 4 | 3,529(0.11%)#65 | 106,565(0.00%)#1,459 |
| 66. | Meadowbrook | 3 | 3,529(0.09%)#66 | 106,565(0.00%)#1,501 |
| 67. | Berryville | 3 | 3,529(0.09%)#67 | 106,565(0.00%)#1,507 |
Common Questions
What are the Top 10 Cities with the Most Immigrants from Chile in Virginia?
Top 10 Cities with the Most Immigrants from Chile in Virginia are:
#1
276
#2
119
#3
108
#4
100
#5
100
#6
84
#7
79
#8
75
#9
73
#10
70
What city has the Most Immigrants from Chile in Virginia?
Alexandria has the Most Immigrants from Chile in Virginia with 276.
What is the Total Immigrants from Chile in the State of Virginia?
Total Immigrants from Chile in Virginia is 3,529.
What is the Total Immigrants from Chile in the United States?
Total Immigrants from Chile in the United States is 106,565.