Cities with the Highest Percentage of Bolivian Population in Virginia
RELATED REPORTS & OPTIONS
Bolivian
Virginia
Compare Cities
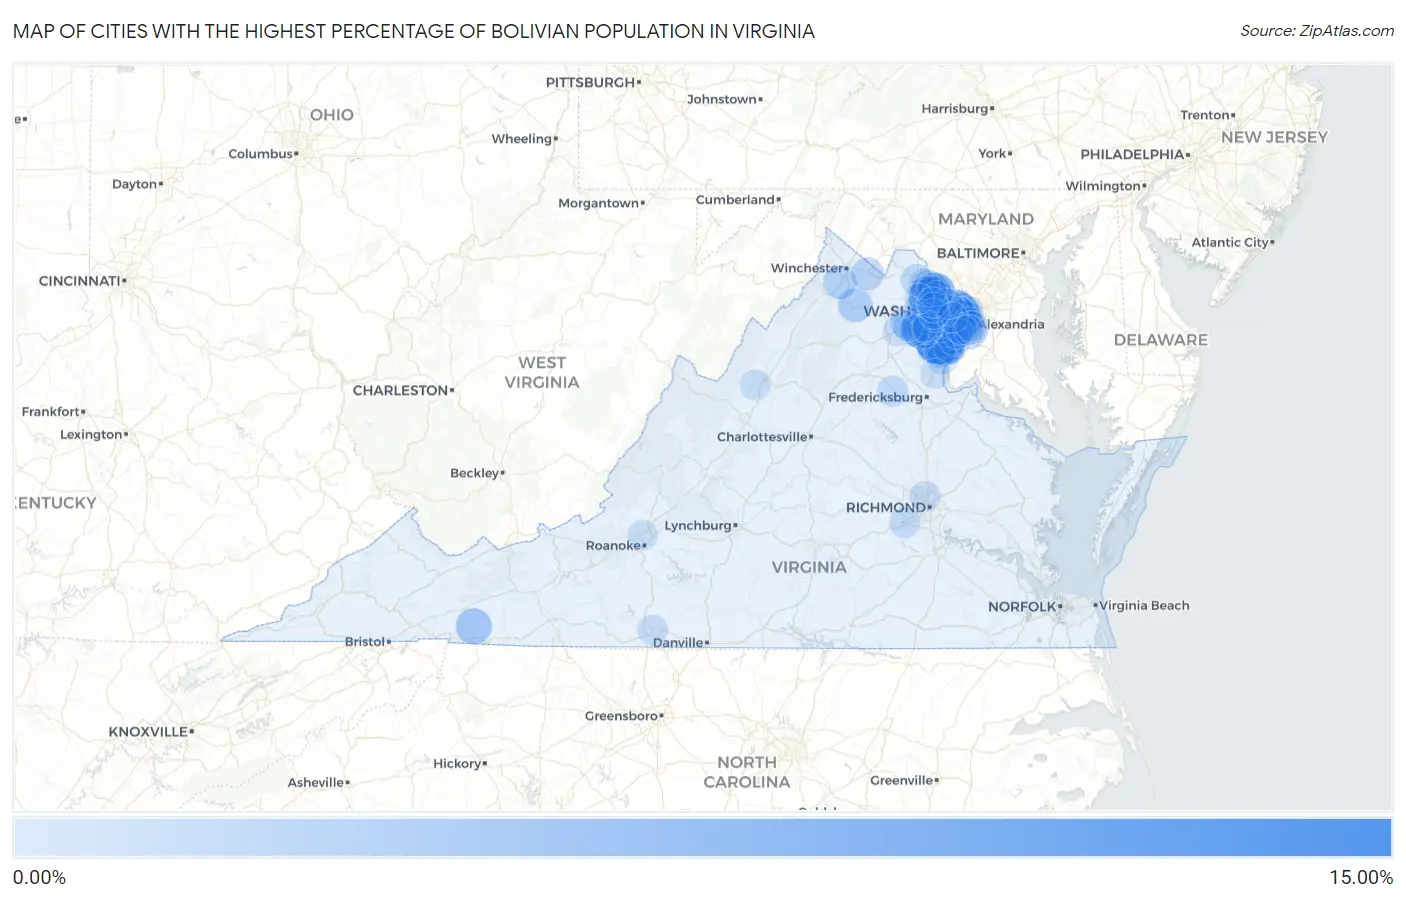
Map of Cities with the Highest Percentage of Bolivian Population in Virginia
0.00%
15.00%
Cities with the Highest Percentage of Bolivian Population in Virginia
| City | Bolivian | vs State | vs National | |
| 1. | County Center | 11.98% | 0.44%(+11.5)#1 | 0.039%(+11.9)#1 |
| 2. | West Falls Church | 9.54% | 0.44%(+9.10)#2 | 0.039%(+9.50)#2 |
| 3. | Loch Lomond | 8.96% | 0.44%(+8.52)#3 | 0.039%(+8.92)#3 |
| 4. | Oak Grove | 8.92% | 0.44%(+8.48)#4 | 0.039%(+8.88)#4 |
| 5. | Pimmit Hills | 5.22% | 0.44%(+4.78)#5 | 0.039%(+5.18)#11 |
| 6. | Potomac Mills | 5.21% | 0.44%(+4.77)#6 | 0.039%(+5.17)#12 |
| 7. | Sugarland Run | 4.52% | 0.44%(+4.08)#7 | 0.039%(+4.48)#17 |
| 8. | Annandale | 4.41% | 0.44%(+3.97)#8 | 0.039%(+4.37)#18 |
| 9. | Kings Park | 4.35% | 0.44%(+3.91)#9 | 0.039%(+4.31)#19 |
| 10. | Sterling | 4.06% | 0.44%(+3.62)#10 | 0.039%(+4.02)#22 |
| 11. | North Springfield | 3.89% | 0.44%(+3.45)#11 | 0.039%(+3.85)#23 |
| 12. | Troutdale | 3.78% | 0.44%(+3.34)#12 | 0.039%(+3.74)#25 |
| 13. | Lincolnia | 3.40% | 0.44%(+2.96)#13 | 0.039%(+3.36)#28 |
| 14. | Braddock | 3.38% | 0.44%(+2.94)#14 | 0.039%(+3.34)#29 |
| 15. | Bailey S Crossroads | 3.05% | 0.44%(+2.61)#15 | 0.039%(+3.01)#32 |
| 16. | Burke | 2.96% | 0.44%(+2.52)#16 | 0.039%(+2.92)#33 |
| 17. | Idylwood | 2.77% | 0.44%(+2.33)#17 | 0.039%(+2.73)#34 |
| 18. | Skyland Estates | 2.65% | 0.44%(+2.22)#18 | 0.039%(+2.62)#35 |
| 19. | Seven Corners | 2.64% | 0.44%(+2.20)#19 | 0.039%(+2.60)#37 |
| 20. | Mantua | 2.55% | 0.44%(+2.11)#20 | 0.039%(+2.51)#39 |
| 21. | Stephens City | 2.37% | 0.44%(+1.93)#21 | 0.039%(+2.33)#45 |
| 22. | Dale City | 2.26% | 0.44%(+1.82)#22 | 0.039%(+2.22)#50 |
| 23. | Fairfax | 2.16% | 0.44%(+1.72)#23 | 0.039%(+2.12)#52 |
| 24. | Lake Barcroft | 2.14% | 0.44%(+1.70)#24 | 0.039%(+2.10)#53 |
| 25. | Burke Centre | 2.13% | 0.44%(+1.69)#25 | 0.039%(+2.09)#55 |
| 26. | Long Branch | 2.00% | 0.44%(+1.56)#26 | 0.039%(+1.97)#57 |
| 27. | Bull Run | 1.96% | 0.44%(+1.52)#27 | 0.039%(+1.92)#58 |
| 28. | Springfield | 1.93% | 0.44%(+1.49)#28 | 0.039%(+1.90)#59 |
| 29. | Chantilly | 1.90% | 0.44%(+1.46)#29 | 0.039%(+1.86)#60 |
| 30. | Hybla Valley | 1.86% | 0.44%(+1.42)#30 | 0.039%(+1.82)#61 |
| 31. | West Springfield | 1.82% | 0.44%(+1.38)#31 | 0.039%(+1.78)#63 |
| 32. | Berryville | 1.81% | 0.44%(+1.37)#32 | 0.039%(+1.77)#66 |
| 33. | Centreville | 1.79% | 0.44%(+1.35)#33 | 0.039%(+1.76)#67 |
| 34. | Belle Haven | 1.71% | 0.44%(+1.27)#34 | 0.039%(+1.68)#70 |
| 35. | Lake Ridge | 1.68% | 0.44%(+1.24)#35 | 0.039%(+1.64)#72 |
| 36. | Haymarket | 1.65% | 0.44%(+1.21)#36 | 0.039%(+1.62)#73 |
| 37. | Navy | 1.62% | 0.44%(+1.18)#37 | 0.039%(+1.58)#75 |
| 38. | University Center | 1.59% | 0.44%(+1.15)#38 | 0.039%(+1.55)#78 |
| 39. | Arlington | 1.47% | 0.44%(+1.03)#39 | 0.039%(+1.43)#85 |
| 40. | Newington Forest | 1.46% | 0.44%(+1.02)#40 | 0.039%(+1.42)#87 |
| 41. | George Mason | 1.44% | 0.44%(+0.998)#41 | 0.039%(+1.40)#88 |
| 42. | Cascades | 1.40% | 0.44%(+0.956)#42 | 0.039%(+1.36)#94 |
| 43. | Independent Hill | 1.26% | 0.44%(+0.819)#43 | 0.039%(+1.22)#98 |
| 44. | South Riding | 1.21% | 0.44%(+0.775)#44 | 0.039%(+1.18)#102 |
| 45. | Leesburg | 1.20% | 0.44%(+0.758)#45 | 0.039%(+1.16)#103 |
| 46. | Moorefield | 1.15% | 0.44%(+0.708)#46 | 0.039%(+1.11)#105 |
| 47. | Kings Park West | 1.14% | 0.44%(+0.700)#47 | 0.039%(+1.10)#107 |
| 48. | Falls Church | 1.11% | 0.44%(+0.672)#48 | 0.039%(+1.07)#109 |
| 49. | Lorton | 1.07% | 0.44%(+0.636)#49 | 0.039%(+1.04)#114 |
| 50. | Floris | 1.05% | 0.44%(+0.612)#50 | 0.039%(+1.01)#118 |
| 51. | Dumfries | 1.04% | 0.44%(+0.596)#51 | 0.039%(+0.997)#120 |
| 52. | Herndon | 1.02% | 0.44%(+0.579)#52 | 0.039%(+0.979)#121 |
| 53. | Union Mill | 1.00% | 0.44%(+0.560)#53 | 0.039%(+0.961)#126 |
| 54. | Fair Oaks | 0.99% | 0.44%(+0.551)#54 | 0.039%(+0.952)#127 |
| 55. | Rose Hill Cdp Fairfax County | 0.99% | 0.44%(+0.551)#55 | 0.039%(+0.952)#128 |
| 56. | Manassas | 0.99% | 0.44%(+0.546)#56 | 0.039%(+0.947)#129 |
| 57. | South Run | 0.98% | 0.44%(+0.541)#57 | 0.039%(+0.941)#131 |
| 58. | Lake Of The Woods | 0.96% | 0.44%(+0.518)#58 | 0.039%(+0.919)#134 |
| 59. | Sudley | 0.93% | 0.44%(+0.494)#59 | 0.039%(+0.894)#139 |
| 60. | Brandermill | 0.93% | 0.44%(+0.492)#60 | 0.039%(+0.892)#141 |
| 61. | Fairfax Station | 0.92% | 0.44%(+0.481)#61 | 0.039%(+0.882)#143 |
| 62. | Oakton | 0.89% | 0.44%(+0.453)#62 | 0.039%(+0.854)#146 |
| 63. | Fair Lakes | 0.82% | 0.44%(+0.379)#63 | 0.039%(+0.780)#159 |
| 64. | Reston | 0.81% | 0.44%(+0.371)#64 | 0.039%(+0.771)#160 |
| 65. | Lakeside | 0.75% | 0.44%(+0.311)#65 | 0.039%(+0.712)#168 |
| 66. | Bridgewater | 0.75% | 0.44%(+0.306)#66 | 0.039%(+0.706)#170 |
| 67. | Laurel Hill | 0.72% | 0.44%(+0.283)#67 | 0.039%(+0.683)#177 |
| 68. | Hutchison | 0.72% | 0.44%(+0.281)#68 | 0.039%(+0.681)#178 |
| 69. | Martinsville | 0.69% | 0.44%(+0.255)#69 | 0.039%(+0.655)#187 |
| 70. | Woodbridge | 0.68% | 0.44%(+0.241)#70 | 0.039%(+0.642)#192 |
| 71. | Dunn Loring | 0.64% | 0.44%(+0.204)#71 | 0.039%(+0.604)#196 |
| 72. | Montclair | 0.64% | 0.44%(+0.199)#72 | 0.039%(+0.600)#197 |
| 73. | Alexandria | 0.63% | 0.44%(+0.192)#73 | 0.039%(+0.593)#199 |
| 74. | Lowes Island | 0.60% | 0.44%(+0.164)#74 | 0.039%(+0.565)#203 |
| 75. | Difficult Run | 0.59% | 0.44%(+0.155)#75 | 0.039%(+0.555)#208 |
| 76. | Hayfield | 0.57% | 0.44%(+0.130)#76 | 0.039%(+0.531)#213 |
| 77. | New Baltimore | 0.55% | 0.44%(+0.114)#77 | 0.039%(+0.515)#218 |
| 78. | Woodlawn Cdp Fairfax County | 0.55% | 0.44%(+0.114)#78 | 0.039%(+0.514)#219 |
| 79. | Ashburn | 0.55% | 0.44%(+0.113)#79 | 0.039%(+0.513)#220 |
| 80. | Franconia | 0.51% | 0.44%(+0.069)#80 | 0.039%(+0.469)#239 |
| 81. | Yorkshire | 0.50% | 0.44%(+0.063)#81 | 0.039%(+0.463)#243 |
| 82. | Leesylvania | 0.50% | 0.44%(+0.058)#82 | 0.039%(+0.459)#246 |
| 83. | Linton Hall | 0.49% | 0.44%(+0.048)#83 | 0.039%(+0.448)#250 |
| 84. | Newington | 0.47% | 0.44%(+0.033)#84 | 0.039%(+0.433)#258 |
| 85. | Countryside | 0.46% | 0.44%(+0.017)#85 | 0.039%(+0.417)#266 |
| 86. | Lansdowne | 0.43% | 0.44%(-0.011)#86 | 0.039%(+0.390)#275 |
| 87. | Gainesville | 0.41% | 0.44%(-0.033)#87 | 0.039%(+0.368)#287 |
| 88. | Dranesville | 0.40% | 0.44%(-0.036)#88 | 0.039%(+0.364)#289 |
| 89. | Wolf Trap | 0.39% | 0.44%(-0.045)#89 | 0.039%(+0.356)#294 |
| 90. | Manassas Park | 0.39% | 0.44%(-0.048)#90 | 0.039%(+0.352)#298 |
| 91. | Dulles Town Center | 0.37% | 0.44%(-0.065)#91 | 0.039%(+0.335)#305 |
| 92. | Huntington | 0.34% | 0.44%(-0.101)#92 | 0.039%(+0.299)#324 |
| 93. | Hollins | 0.34% | 0.44%(-0.104)#93 | 0.039%(+0.297)#327 |
| 94. | Greenbriar | 0.33% | 0.44%(-0.112)#94 | 0.039%(+0.288)#330 |
| 95. | Brambleton | 0.32% | 0.44%(-0.115)#95 | 0.039%(+0.286)#331 |
| 96. | Franklin Farm | 0.32% | 0.44%(-0.116)#96 | 0.039%(+0.284)#333 |
| 97. | Mcnair | 0.32% | 0.44%(-0.124)#97 | 0.039%(+0.277)#337 |
| 98. | Woodburn | 0.30% | 0.44%(-0.138)#98 | 0.039%(+0.262)#347 |
| 99. | Groveton | 0.30% | 0.44%(-0.138)#99 | 0.039%(+0.262)#348 |
| 100. | Aquia Harbour | 0.27% | 0.44%(-0.166)#100 | 0.039%(+0.235)#370 |
Common Questions
What are the Top 10 Cities with the Highest Percentage of Bolivian Population in Virginia?
Top 10 Cities with the Highest Percentage of Bolivian Population in Virginia are:
#1
11.98%
#2
9.54%
#3
8.96%
#4
8.92%
#5
5.22%
#6
5.21%
#7
4.52%
#8
4.41%
#9
4.35%
#10
4.06%
What city has the Highest Percentage of Bolivian Population in Virginia?
County Center has the Highest Percentage of Bolivian Population in Virginia with 11.98%.
What is the Percentage of Bolivian Population in the State of Virginia?
Percentage of Bolivian Population in Virginia is 0.44%.
What is the Percentage of Bolivian Population in the United States?
Percentage of Bolivian Population in the United States is 0.039%.