Hopewell, VA Map & Demographics
Hopewell Map
Hopewell Overview
$25,664
PER CAPITA INCOME
$58,850
AVG FAMILY INCOME
$50,661
AVG HOUSEHOLD INCOME
14.9%
WAGE / INCOME GAP [ % ]
85.1¢/ $1
WAGE / INCOME GAP [ $ ]
$10,942
FAMILY INCOME DEFICIT
0.44
INEQUALITY / GINI INDEX
23,046
TOTAL POPULATION
10,827
MALE POPULATION
12,219
FEMALE POPULATION
88.61
MALES / 100 FEMALES
112.86
FEMALES / 100 MALES
35.7
MEDIAN AGE
3.0
AVG FAMILY SIZE
2.4
AVG HOUSEHOLD SIZE
10,655
LABOR FORCE [ PEOPLE ]
60.2%
PERCENT IN LABOR FORCE
8.8%
UNEMPLOYMENT RATE
Hopewell Zip Codes
Hopewell Area Codes
Income in Hopewell
Income Overview in Hopewell
Per Capita Income in Hopewell is $25,664, while median incomes of families and households are $58,850 and $50,661 respectively.
| Characteristic | Number | Measure |
| Per Capita Income | 23,046 | $25,664 |
| Median Family Income | 5,946 | $58,850 |
| Mean Family Income | 5,946 | $71,729 |
| Median Household Income | 9,348 | $50,661 |
| Mean Household Income | 9,348 | $63,460 |
| Income Deficit | 5,946 | $10,942 |
| Wage / Income Gap (%) | 23,046 | 14.93% |
| Wage / Income Gap ($) | 23,046 | 85.07¢ per $1 |
| Gini / Inequality Index | 23,046 | 0.44 |
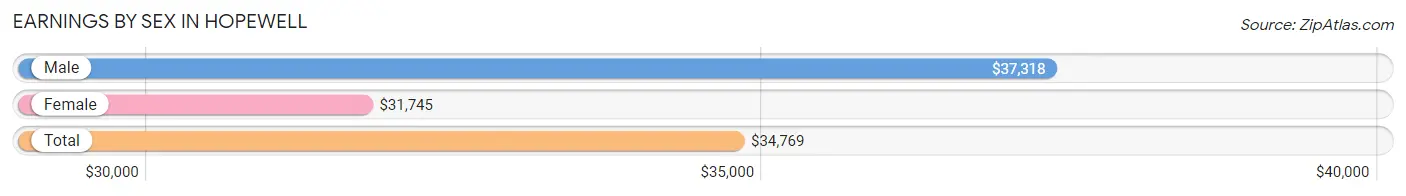
Earnings by Sex in Hopewell
Average Earnings in Hopewell are $34,769, $37,318 for men and $31,745 for women, a difference of 14.9%.
| Sex | Number | Average Earnings |
| Male | 5,516 (48.9%) | $37,318 |
| Female | 5,757 (51.1%) | $31,745 |
| Total | 11,273 (100.0%) | $34,769 |
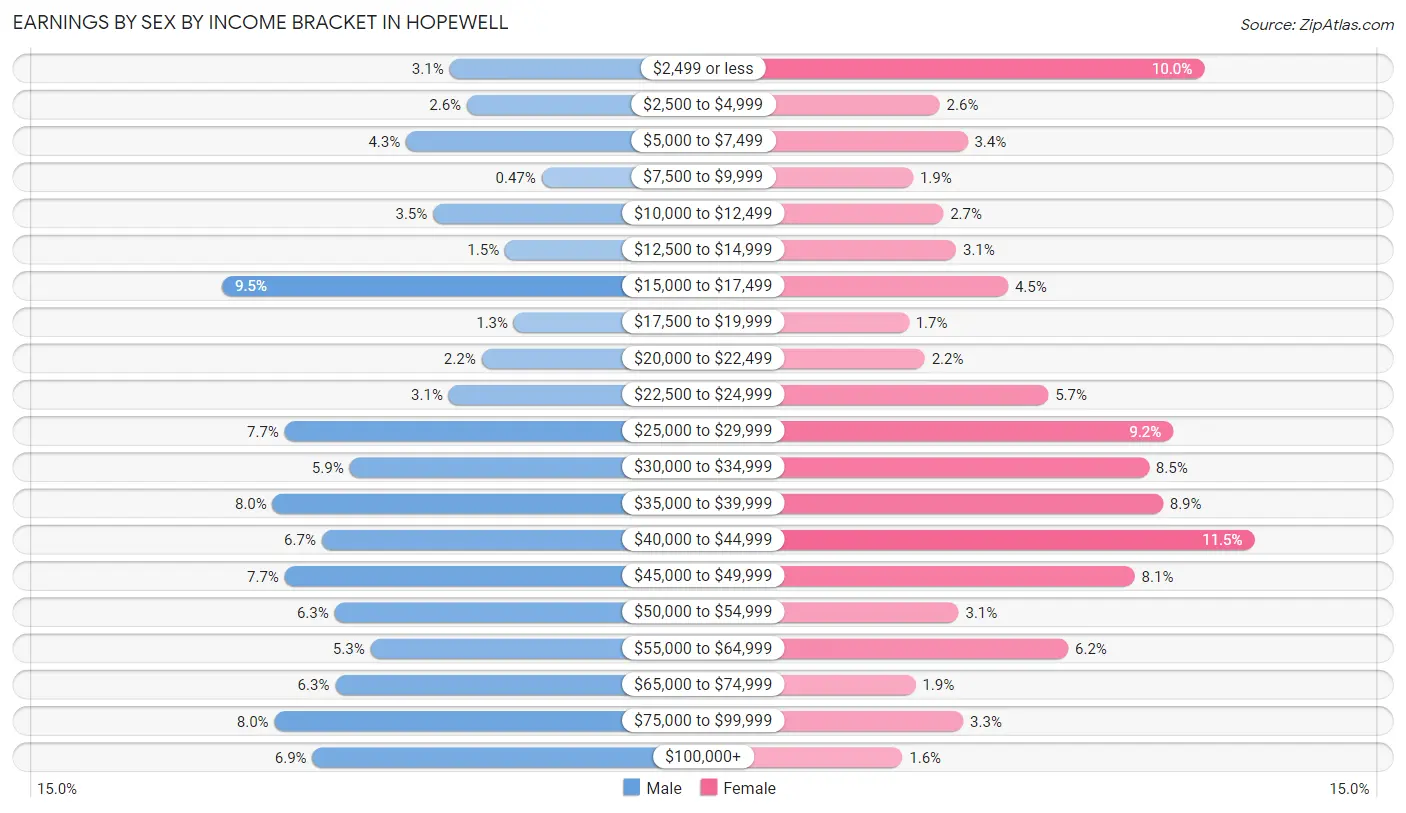
Earnings by Sex by Income Bracket in Hopewell
The most common earnings brackets in Hopewell are $15,000 to $17,499 for men (521 | 9.5%) and $40,000 to $44,999 for women (659 | 11.5%).
| Income | Male | Female |
| $2,499 or less | 169 (3.1%) | 578 (10.0%) |
| $2,500 to $4,999 | 142 (2.6%) | 150 (2.6%) |
| $5,000 to $7,499 | 236 (4.3%) | 195 (3.4%) |
| $7,500 to $9,999 | 26 (0.5%) | 107 (1.9%) |
| $10,000 to $12,499 | 194 (3.5%) | 156 (2.7%) |
| $12,500 to $14,999 | 83 (1.5%) | 177 (3.1%) |
| $15,000 to $17,499 | 521 (9.5%) | 261 (4.5%) |
| $17,500 to $19,999 | 69 (1.3%) | 100 (1.7%) |
| $20,000 to $22,499 | 119 (2.2%) | 126 (2.2%) |
| $22,500 to $24,999 | 170 (3.1%) | 326 (5.7%) |
| $25,000 to $29,999 | 424 (7.7%) | 528 (9.2%) |
| $30,000 to $34,999 | 324 (5.9%) | 489 (8.5%) |
| $35,000 to $39,999 | 443 (8.0%) | 511 (8.9%) |
| $40,000 to $44,999 | 367 (6.7%) | 659 (11.5%) |
| $45,000 to $49,999 | 424 (7.7%) | 466 (8.1%) |
| $50,000 to $54,999 | 347 (6.3%) | 181 (3.1%) |
| $55,000 to $64,999 | 291 (5.3%) | 358 (6.2%) |
| $65,000 to $74,999 | 346 (6.3%) | 111 (1.9%) |
| $75,000 to $99,999 | 440 (8.0%) | 188 (3.3%) |
| $100,000+ | 381 (6.9%) | 90 (1.6%) |
| Total | 5,516 (100.0%) | 5,757 (100.0%) |
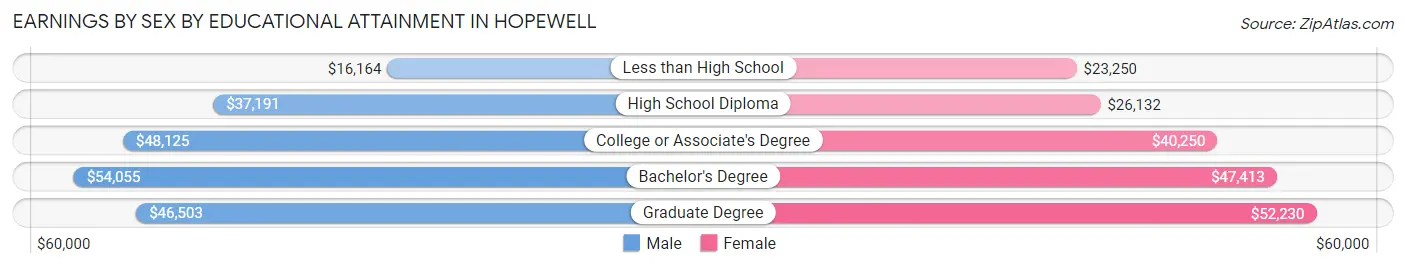
Earnings by Sex by Educational Attainment in Hopewell
Average earnings in Hopewell are $41,028 for men and $35,406 for women, a difference of 13.7%. Men with an educational attainment of bachelor's degree enjoy the highest average annual earnings of $54,055, while those with less than high school education earn the least with $16,164. Women with an educational attainment of graduate degree earn the most with the average annual earnings of $52,230, while those with less than high school education have the smallest earnings of $23,250.
| Educational Attainment | Male Income | Female Income |
| Less than High School | $16,164 | $23,250 |
| High School Diploma | $37,191 | $26,132 |
| College or Associate's Degree | $48,125 | $40,250 |
| Bachelor's Degree | $54,055 | $47,413 |
| Graduate Degree | $46,503 | $52,230 |
| Total | $41,028 | $35,406 |
Family Income in Hopewell
Family Income Brackets in Hopewell
According to the Hopewell family income data, there are 1,171 families falling into the $50,000 to $74,999 income range, which is the most common income bracket and makes up 19.7% of all families. Conversely, the $150,000 to $199,999 income bracket is the least frequent group with only 131 families (2.2%) belonging to this category.
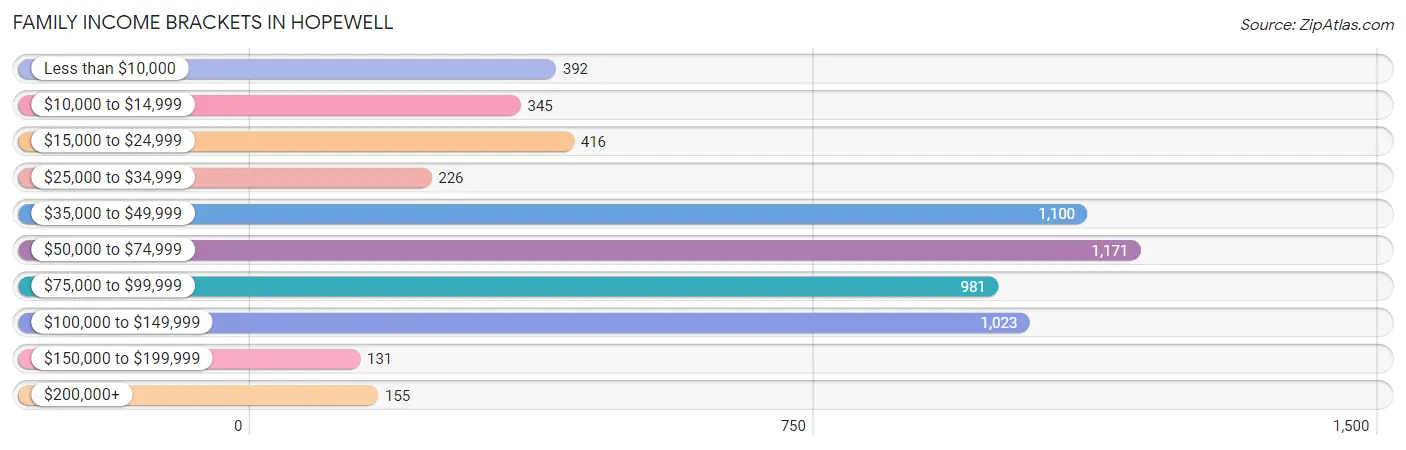
| Income Bracket | # Families | % Families |
| Less than $10,000 | 392 | 6.6% |
| $10,000 to $14,999 | 345 | 5.8% |
| $15,000 to $24,999 | 416 | 7.0% |
| $25,000 to $34,999 | 226 | 3.8% |
| $35,000 to $49,999 | 1,100 | 18.5% |
| $50,000 to $74,999 | 1,171 | 19.7% |
| $75,000 to $99,999 | 981 | 16.5% |
| $100,000 to $149,999 | 1,023 | 17.2% |
| $150,000 to $199,999 | 131 | 2.2% |
| $200,000+ | 155 | 2.6% |
Family Income by Famaliy Size in Hopewell
4-person families (900 | 15.1%) account for the highest median family income in Hopewell with $87,819 per family, while 2-person families (2,587 | 43.5%) have the highest median income of $31,016 per family member.
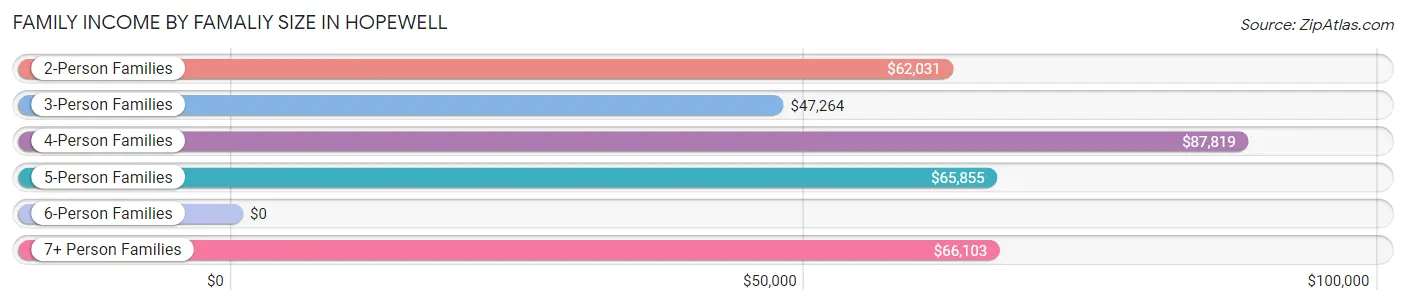
| Income Bracket | # Families | Median Income |
| 2-Person Families | 2,587 (43.5%) | $62,031 |
| 3-Person Families | 1,492 (25.1%) | $47,264 |
| 4-Person Families | 900 (15.1%) | $87,819 |
| 5-Person Families | 538 (9.0%) | $65,855 |
| 6-Person Families | 305 (5.1%) | $0 |
| 7+ Person Families | 124 (2.1%) | $66,103 |
| Total | 5,946 (100.0%) | $58,850 |
Family Income by Number of Earners in Hopewell
The median family income in Hopewell is $58,850, with families comprising 3+ earners (605) having the highest median family income of $99,419, while families with no earners (837) have the lowest median family income of $22,092, accounting for 10.2% and 14.1% of families, respectively.
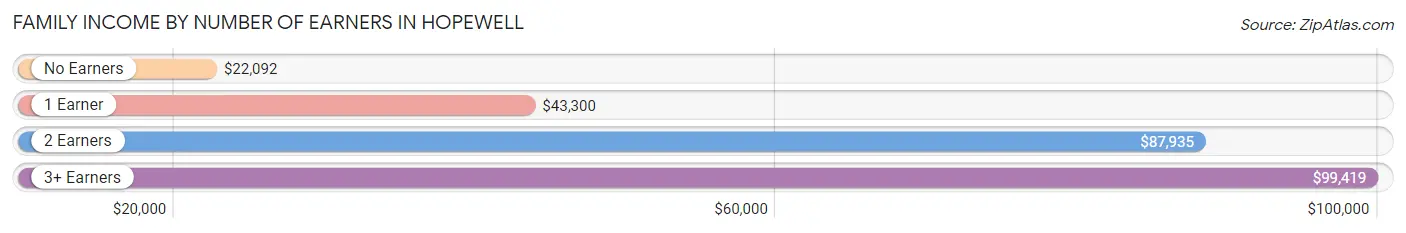
| Number of Earners | # Families | Median Income |
| No Earners | 837 (14.1%) | $22,092 |
| 1 Earner | 2,126 (35.8%) | $43,300 |
| 2 Earners | 2,378 (40.0%) | $87,935 |
| 3+ Earners | 605 (10.2%) | $99,419 |
| Total | 5,946 (100.0%) | $58,850 |
Household Income in Hopewell
Household Income Brackets in Hopewell
With 1,814 households falling in the category, the $50,000 to $74,999 income range is the most frequent in Hopewell, accounting for 19.4% of all households. In contrast, only 206 households (2.2%) fall into the $200,000+ income bracket, making it the least populous group.
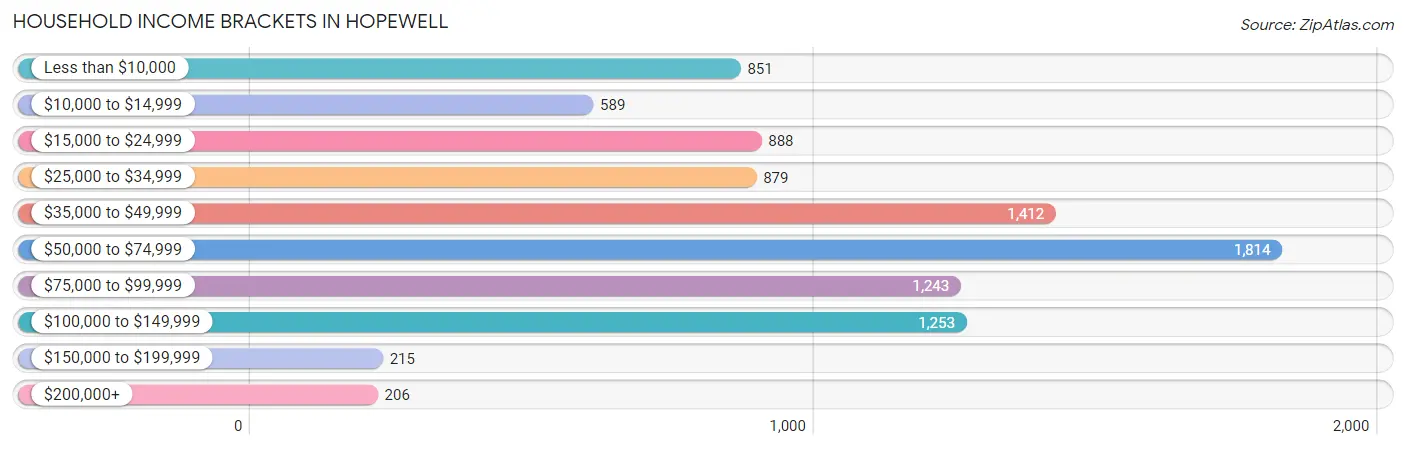
| Income Bracket | # Households | % Households |
| Less than $10,000 | 851 | 9.1% |
| $10,000 to $14,999 | 589 | 6.3% |
| $15,000 to $24,999 | 888 | 9.5% |
| $25,000 to $34,999 | 879 | 9.4% |
| $35,000 to $49,999 | 1,412 | 15.1% |
| $50,000 to $74,999 | 1,814 | 19.4% |
| $75,000 to $99,999 | 1,243 | 13.3% |
| $100,000 to $149,999 | 1,253 | 13.4% |
| $150,000 to $199,999 | 215 | 2.3% |
| $200,000+ | 206 | 2.2% |
Household Income by Householder Age in Hopewell
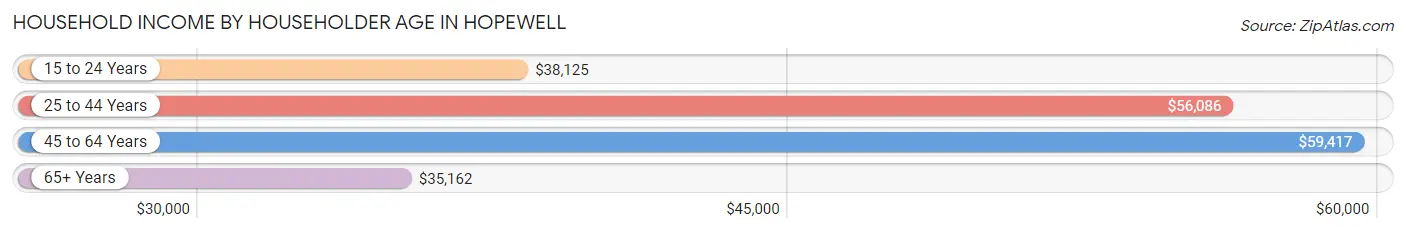
The median household income in Hopewell is $50,661, with the highest median household income of $59,417 found in the 45 to 64 years age bracket for the primary householder. A total of 3,387 households (36.2%) fall into this category. Meanwhile, the 65+ years age bracket for the primary householder has the lowest median household income of $35,162, with 2,349 households (25.1%) in this group.
| Income Bracket | # Households | Median Income |
| 15 to 24 Years | 587 (6.3%) | $38,125 |
| 25 to 44 Years | 3,025 (32.4%) | $56,086 |
| 45 to 64 Years | 3,387 (36.2%) | $59,417 |
| 65+ Years | 2,349 (25.1%) | $35,162 |
| Total | 9,348 (100.0%) | $50,661 |
Poverty in Hopewell
Income Below Poverty by Sex and Age in Hopewell
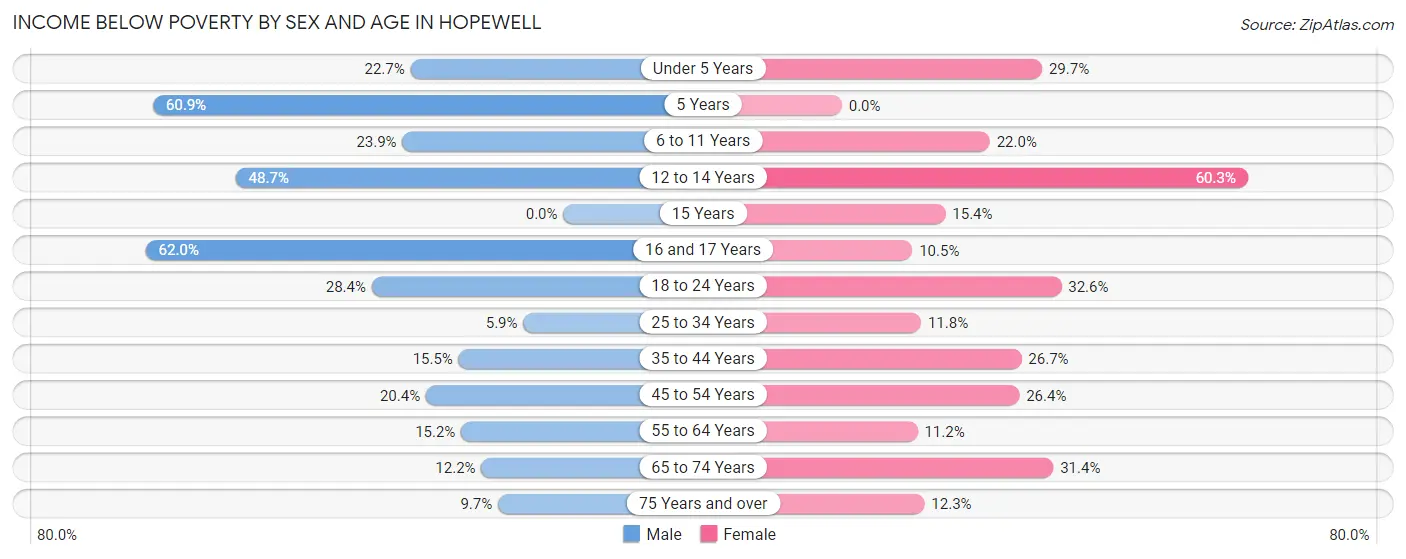
With 20.3% poverty level for males and 22.3% for females among the residents of Hopewell, 16 and 17 year old males and 12 to 14 year old females are the most vulnerable to poverty, with 245 males (62.0%) and 176 females (60.3%) in their respective age groups living below the poverty level.
| Age Bracket | Male | Female |
| Under 5 Years | 204 (22.7%) | 223 (29.7%) |
| 5 Years | 39 (60.9%) | 0 (0.0%) |
| 6 to 11 Years | 345 (23.9%) | 248 (22.0%) |
| 12 to 14 Years | 163 (48.7%) | 176 (60.3%) |
| 15 Years | 0 (0.0%) | 48 (15.4%) |
| 16 and 17 Years | 245 (62.0%) | 16 (10.5%) |
| 18 to 24 Years | 329 (28.4%) | 322 (32.6%) |
| 25 to 34 Years | 88 (5.9%) | 206 (11.8%) |
| 35 to 44 Years | 191 (15.5%) | 387 (26.7%) |
| 45 to 54 Years | 234 (20.4%) | 438 (26.4%) |
| 55 to 64 Years | 194 (15.2%) | 178 (11.2%) |
| 65 to 74 Years | 97 (12.2%) | 351 (31.4%) |
| 75 Years and over | 47 (9.7%) | 98 (12.3%) |
| Total | 2,176 (20.3%) | 2,691 (22.3%) |
Income Above Poverty by Sex and Age in Hopewell
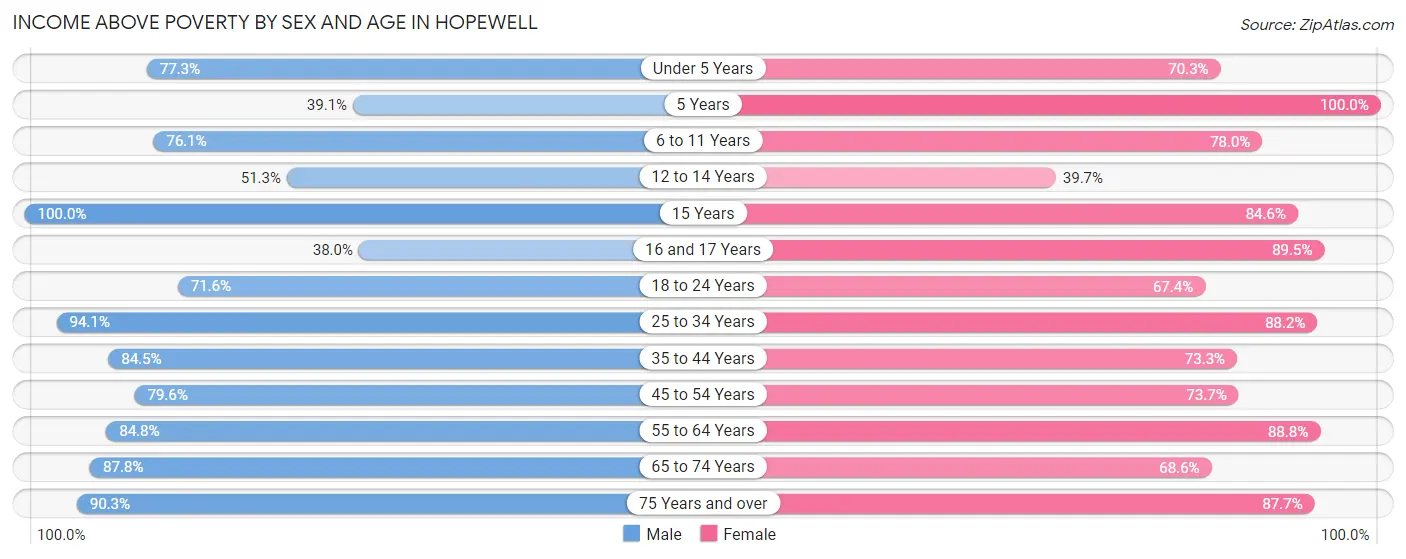
According to the poverty statistics in Hopewell, males aged 15 years and females aged 5 years are the age groups that are most secure financially, with 100.0% of males and 100.0% of females in these age groups living above the poverty line.
| Age Bracket | Male | Female |
| Under 5 Years | 695 (77.3%) | 527 (70.3%) |
| 5 Years | 25 (39.1%) | 105 (100.0%) |
| 6 to 11 Years | 1,099 (76.1%) | 881 (78.0%) |
| 12 to 14 Years | 172 (51.3%) | 116 (39.7%) |
| 15 Years | 17 (100.0%) | 264 (84.6%) |
| 16 and 17 Years | 150 (38.0%) | 137 (89.5%) |
| 18 to 24 Years | 828 (71.6%) | 666 (67.4%) |
| 25 to 34 Years | 1,394 (94.1%) | 1,545 (88.2%) |
| 35 to 44 Years | 1,038 (84.5%) | 1,064 (73.3%) |
| 45 to 54 Years | 913 (79.6%) | 1,224 (73.7%) |
| 55 to 64 Years | 1,085 (84.8%) | 1,406 (88.8%) |
| 65 to 74 Years | 700 (87.8%) | 767 (68.6%) |
| 75 Years and over | 438 (90.3%) | 701 (87.7%) |
| Total | 8,554 (79.7%) | 9,403 (77.7%) |
Income Below Poverty Among Married-Couple Families in Hopewell
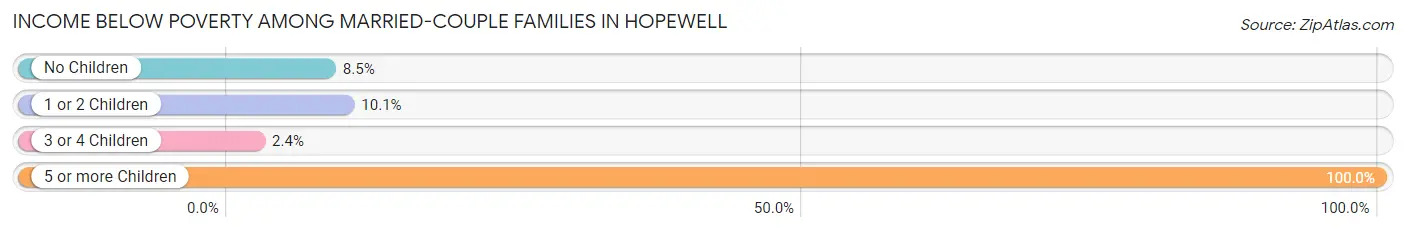
The poverty statistics for married-couple families in Hopewell show that 8.7% or 275 of the total 3,174 families live below the poverty line. Families with 5 or more children have the highest poverty rate of 100.0%, comprising of 18 families. On the other hand, families with 3 or 4 children have the lowest poverty rate of 2.4%, which includes 10 families.
| Children | Above Poverty | Below Poverty |
| No Children | 1,696 (91.5%) | 158 (8.5%) |
| 1 or 2 Children | 790 (89.9%) | 89 (10.1%) |
| 3 or 4 Children | 413 (97.6%) | 10 (2.4%) |
| 5 or more Children | 0 (0.0%) | 18 (100.0%) |
| Total | 2,899 (91.3%) | 275 (8.7%) |
Income Below Poverty Among Single-Parent Households in Hopewell
According to the poverty data in Hopewell, 27.9% or 122 single-father households and 30.5% or 711 single-mother households are living below the poverty line. Among single-father households, those with 1 or 2 children have the highest poverty rate, with 103 households (32.9%) experiencing poverty. Likewise, among single-mother households, those with 5 or more children have the highest poverty rate, with 37 households (100.0%) falling below the poverty line.
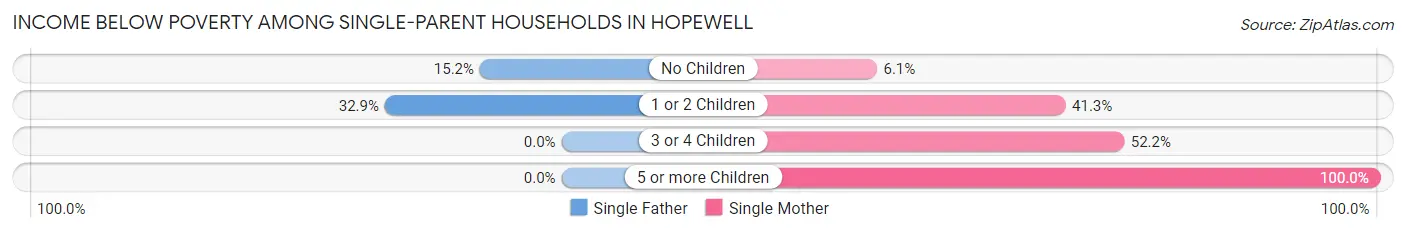
| Children | Single Father | Single Mother |
| No Children | 19 (15.2%) | 52 (6.1%) |
| 1 or 2 Children | 103 (32.9%) | 502 (41.2%) |
| 3 or 4 Children | 0 (0.0%) | 120 (52.2%) |
| 5 or more Children | 0 (0.0%) | 37 (100.0%) |
| Total | 122 (27.9%) | 711 (30.5%) |
Income Below Poverty Among Married-Couple vs Single-Parent Households in Hopewell
The poverty data for Hopewell shows that 275 of the married-couple family households (8.7%) and 833 of the single-parent households (30.0%) are living below the poverty level. Within the married-couple family households, those with 5 or more children have the highest poverty rate, with 18 households (100.0%) falling below the poverty line. Among the single-parent households, those with 5 or more children have the highest poverty rate, with 37 household (100.0%) living below poverty.
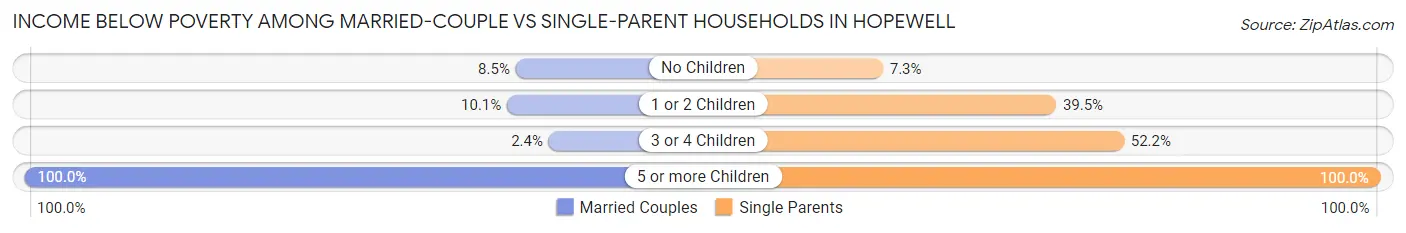
| Children | Married-Couple Families | Single-Parent Households |
| No Children | 158 (8.5%) | 71 (7.3%) |
| 1 or 2 Children | 89 (10.1%) | 605 (39.5%) |
| 3 or 4 Children | 10 (2.4%) | 120 (52.2%) |
| 5 or more Children | 18 (100.0%) | 37 (100.0%) |
| Total | 275 (8.7%) | 833 (30.0%) |
Race in Hopewell
The most populous races in Hopewell are White / Caucasian (10,612 | 46.1%), Black / African American (9,978 | 43.3%), and Hispanic or Latino (2,043 | 8.9%).
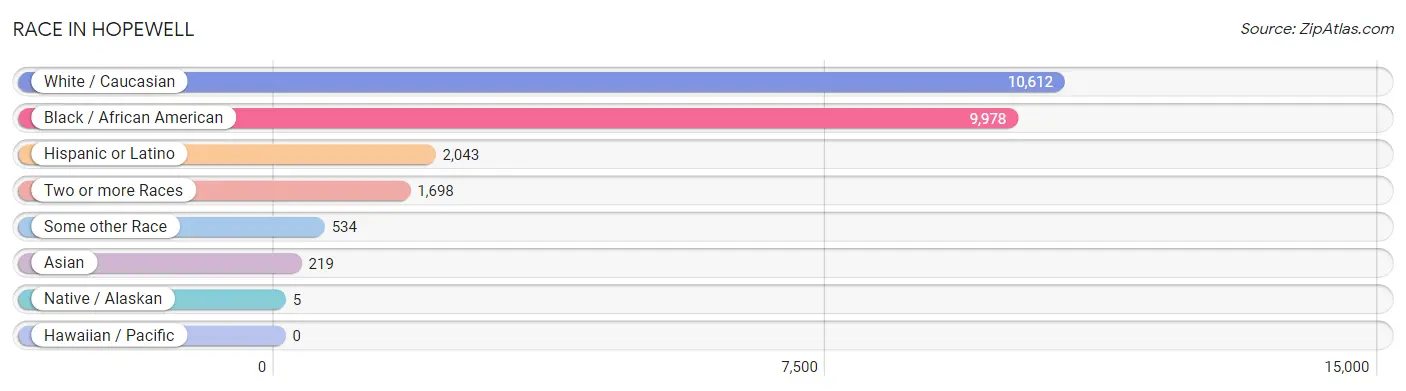
| Race | # Population | % Population |
| Asian | 219 | 0.9% |
| Black / African American | 9,978 | 43.3% |
| Hawaiian / Pacific | 0 | 0.0% |
| Hispanic or Latino | 2,043 | 8.9% |
| Native / Alaskan | 5 | 0.0% |
| White / Caucasian | 10,612 | 46.1% |
| Two or more Races | 1,698 | 7.4% |
| Some other Race | 534 | 2.3% |
| Total | 23,046 | 100.0% |
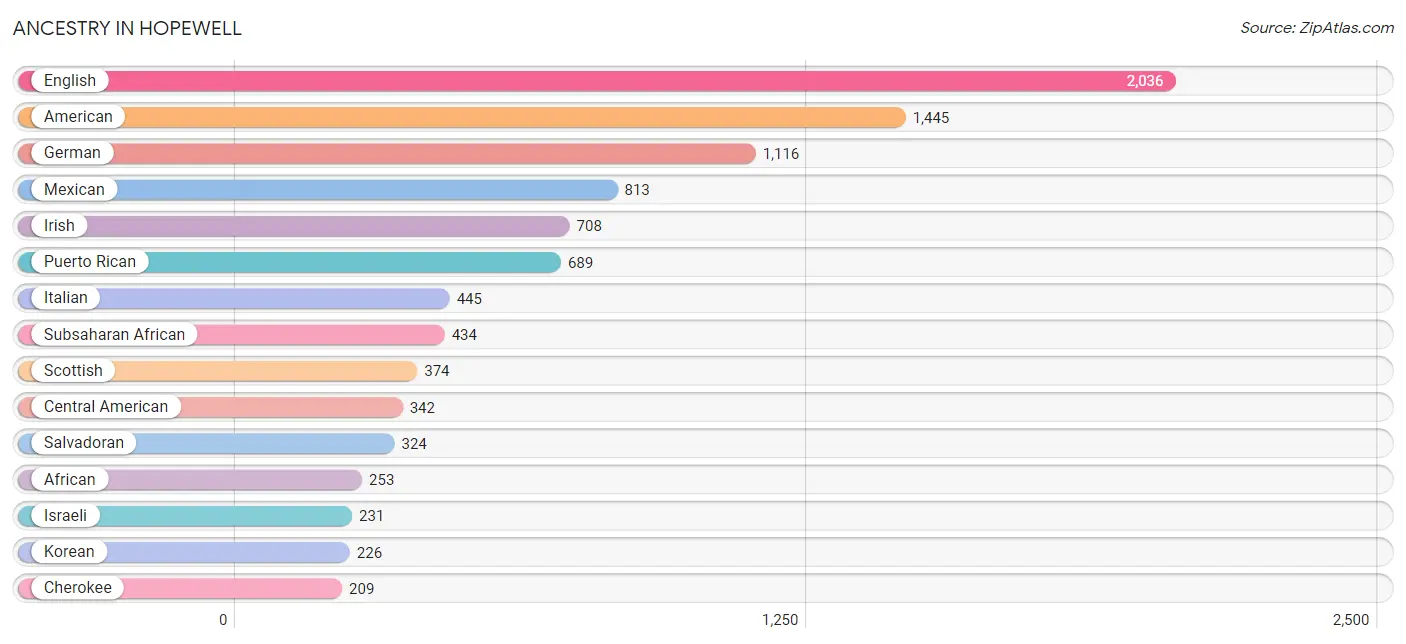
Ancestry in Hopewell
The most populous ancestries reported in Hopewell are English (2,036 | 8.8%), American (1,445 | 6.3%), German (1,116 | 4.8%), Mexican (813 | 3.5%), and Irish (708 | 3.1%), together accounting for 26.5% of all Hopewell residents.
| Ancestry | # Population | % Population |
| African | 253 | 1.1% |
| Aleut | 2 | 0.0% |
| American | 1,445 | 6.3% |
| Arab | 143 | 0.6% |
| Austrian | 22 | 0.1% |
| Bahamian | 31 | 0.1% |
| Barbadian | 41 | 0.2% |
| Bhutanese | 67 | 0.3% |
| British | 58 | 0.3% |
| Burmese | 2 | 0.0% |
| Canadian | 17 | 0.1% |
| Central American | 342 | 1.5% |
| Central American Indian | 25 | 0.1% |
| Cherokee | 209 | 0.9% |
| Costa Rican | 16 | 0.1% |
| Croatian | 14 | 0.1% |
| Cuban | 146 | 0.6% |
| Czech | 16 | 0.1% |
| Danish | 7 | 0.0% |
| Dominican | 25 | 0.1% |
| Dutch | 91 | 0.4% |
| Eastern European | 21 | 0.1% |
| Ecuadorian | 5 | 0.0% |
| Egyptian | 8 | 0.0% |
| English | 2,036 | 8.8% |
| European | 106 | 0.5% |
| Finnish | 11 | 0.1% |
| French | 95 | 0.4% |
| French Canadian | 24 | 0.1% |
| German | 1,116 | 4.8% |
| Greek | 40 | 0.2% |
| Honduran | 1 | 0.0% |
| Hungarian | 36 | 0.2% |
| Iranian | 24 | 0.1% |
| Irish | 708 | 3.1% |
| Israeli | 231 | 1.0% |
| Italian | 445 | 1.9% |
| Jamaican | 48 | 0.2% |
| Korean | 226 | 1.0% |
| Lithuanian | 14 | 0.1% |
| Mexican | 813 | 3.5% |
| Moroccan | 135 | 0.6% |
| Nigerian | 30 | 0.1% |
| Norwegian | 20 | 0.1% |
| Pakistani | 12 | 0.1% |
| Panamanian | 1 | 0.0% |
| Polish | 76 | 0.3% |
| Puerto Rican | 689 | 3.0% |
| Salvadoran | 324 | 1.4% |
| Scandinavian | 57 | 0.3% |
| Scotch-Irish | 168 | 0.7% |
| Scottish | 374 | 1.6% |
| Sierra Leonean | 89 | 0.4% |
| Slovak | 106 | 0.5% |
| South American | 5 | 0.0% |
| Sri Lankan | 26 | 0.1% |
| Subsaharan African | 434 | 1.9% |
| Swedish | 34 | 0.2% |
| Swiss | 5 | 0.0% |
| Thai | 48 | 0.2% |
| Trinidadian and Tobagonian | 48 | 0.2% |
| U.S. Virgin Islander | 9 | 0.0% |
| Welsh | 112 | 0.5% |
| West Indian | 9 | 0.0% |
| Yugoslavian | 25 | 0.1% | View All 65 Rows |
Immigrants in Hopewell
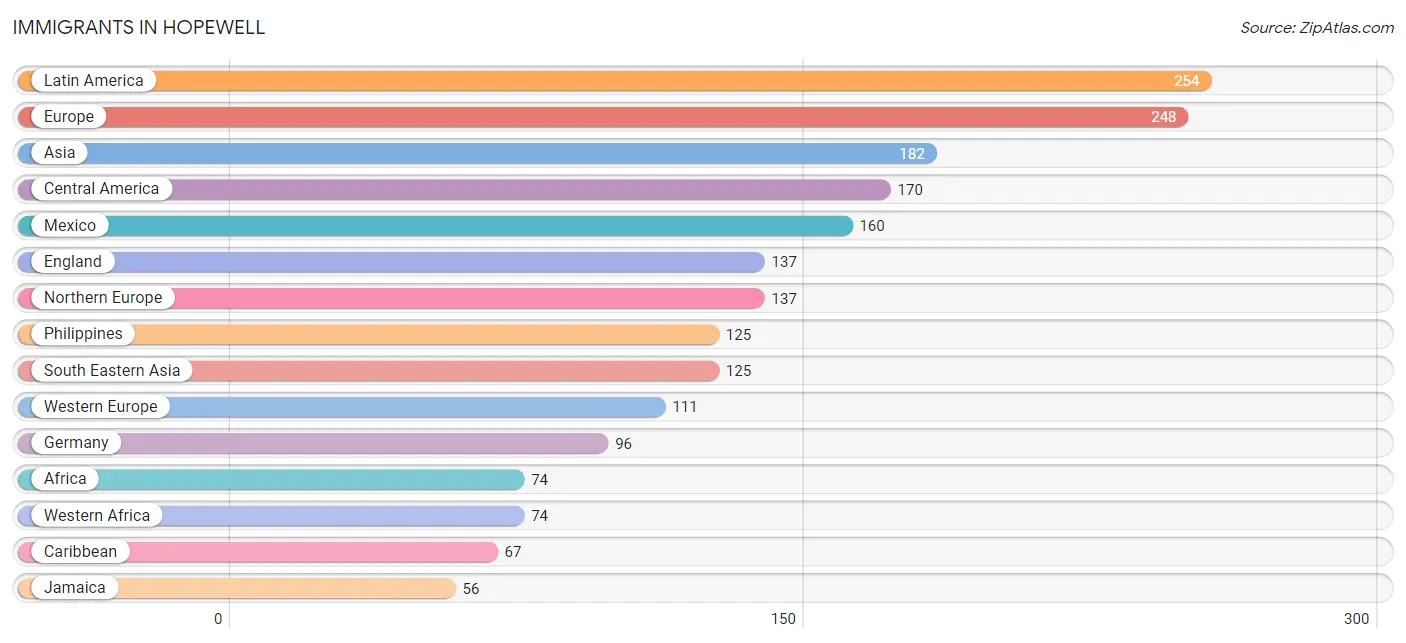
The most numerous immigrant groups reported in Hopewell came from Latin America (254 | 1.1%), Europe (248 | 1.1%), Asia (182 | 0.8%), Central America (170 | 0.7%), and Mexico (160 | 0.7%), together accounting for 4.4% of all Hopewell residents.
| Immigration Origin | # Population | % Population |
| Africa | 74 | 0.3% |
| Asia | 182 | 0.8% |
| Brazil | 12 | 0.1% |
| Caribbean | 67 | 0.3% |
| Central America | 170 | 0.7% |
| Dominica | 11 | 0.1% |
| Eastern Asia | 27 | 0.1% |
| Ecuador | 5 | 0.0% |
| England | 137 | 0.6% |
| Europe | 248 | 1.1% |
| France | 15 | 0.1% |
| Germany | 96 | 0.4% |
| Honduras | 1 | 0.0% |
| Iran | 24 | 0.1% |
| Jamaica | 56 | 0.2% |
| Japan | 25 | 0.1% |
| Korea | 2 | 0.0% |
| Latin America | 254 | 1.1% |
| Mexico | 160 | 0.7% |
| Nigeria | 11 | 0.1% |
| Northern Europe | 137 | 0.6% |
| Oceania | 9 | 0.0% |
| Panama | 9 | 0.0% |
| Philippines | 125 | 0.5% |
| Sierra Leone | 55 | 0.2% |
| South America | 17 | 0.1% |
| South Central Asia | 24 | 0.1% |
| South Eastern Asia | 125 | 0.5% |
| Western Africa | 74 | 0.3% |
| Western Asia | 6 | 0.0% |
| Western Europe | 111 | 0.5% | View All 31 Rows |
Sex and Age in Hopewell
Sex and Age in Hopewell
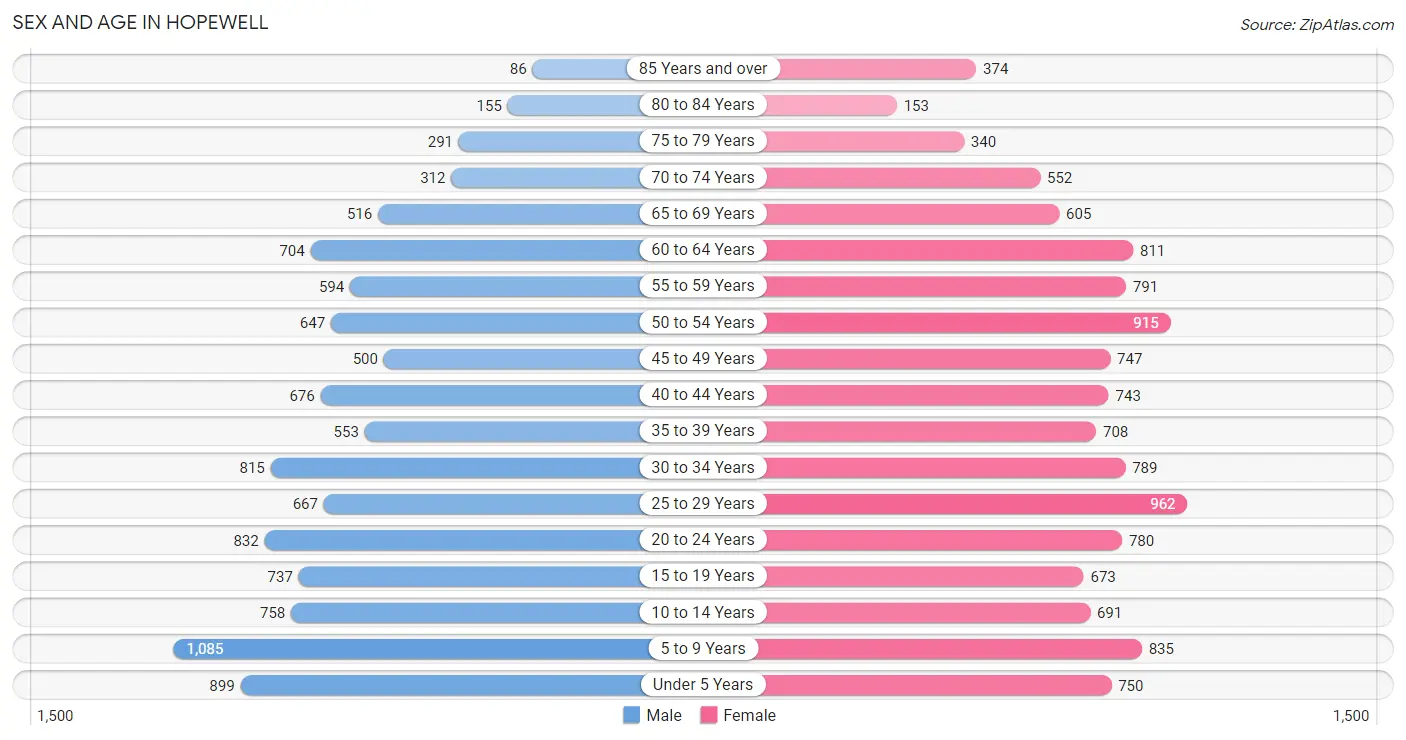
The most populous age groups in Hopewell are 5 to 9 Years (1,085 | 10.0%) for men and 25 to 29 Years (962 | 7.9%) for women.
| Age Bracket | Male | Female |
| Under 5 Years | 899 (8.3%) | 750 (6.1%) |
| 5 to 9 Years | 1,085 (10.0%) | 835 (6.8%) |
| 10 to 14 Years | 758 (7.0%) | 691 (5.7%) |
| 15 to 19 Years | 737 (6.8%) | 673 (5.5%) |
| 20 to 24 Years | 832 (7.7%) | 780 (6.4%) |
| 25 to 29 Years | 667 (6.2%) | 962 (7.9%) |
| 30 to 34 Years | 815 (7.5%) | 789 (6.5%) |
| 35 to 39 Years | 553 (5.1%) | 708 (5.8%) |
| 40 to 44 Years | 676 (6.2%) | 743 (6.1%) |
| 45 to 49 Years | 500 (4.6%) | 747 (6.1%) |
| 50 to 54 Years | 647 (6.0%) | 915 (7.5%) |
| 55 to 59 Years | 594 (5.5%) | 791 (6.5%) |
| 60 to 64 Years | 704 (6.5%) | 811 (6.6%) |
| 65 to 69 Years | 516 (4.8%) | 605 (5.0%) |
| 70 to 74 Years | 312 (2.9%) | 552 (4.5%) |
| 75 to 79 Years | 291 (2.7%) | 340 (2.8%) |
| 80 to 84 Years | 155 (1.4%) | 153 (1.3%) |
| 85 Years and over | 86 (0.8%) | 374 (3.1%) |
| Total | 10,827 (100.0%) | 12,219 (100.0%) |
Families and Households in Hopewell
Median Family Size in Hopewell
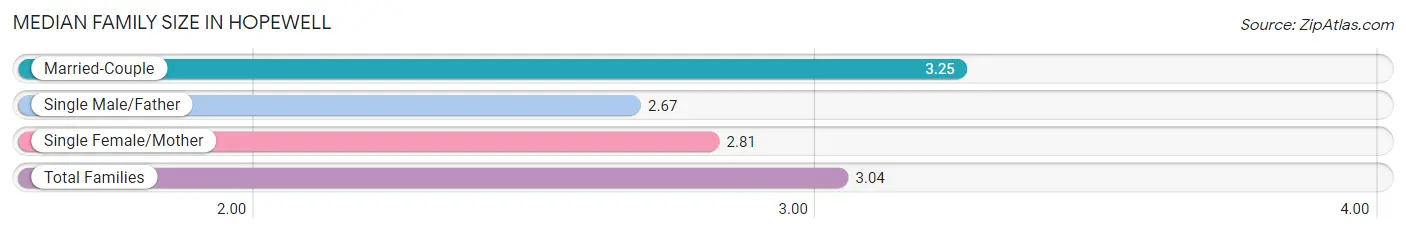
The median family size in Hopewell is 3.04 persons per family, with married-couple families (3,174 | 53.4%) accounting for the largest median family size of 3.25 persons per family. On the other hand, single male/father families (438 | 7.4%) represent the smallest median family size with 2.67 persons per family.
| Family Type | # Families | Family Size |
| Married-Couple | 3,174 (53.4%) | 3.25 |
| Single Male/Father | 438 (7.4%) | 2.67 |
| Single Female/Mother | 2,334 (39.3%) | 2.81 |
| Total Families | 5,946 (100.0%) | 3.04 |
Median Household Size in Hopewell
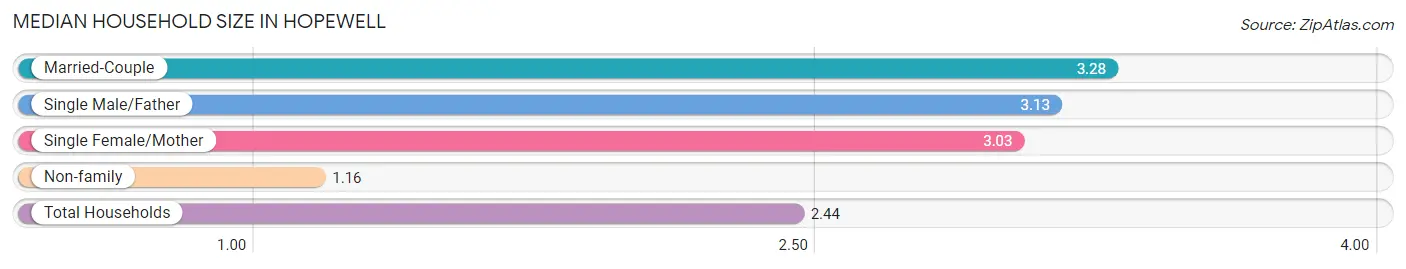
The median household size in Hopewell is 2.44 persons per household, with married-couple households (3,174 | 34.0%) accounting for the largest median household size of 3.28 persons per household. non-family households (3,402 | 36.4%) represent the smallest median household size with 1.16 persons per household.
| Household Type | # Households | Household Size |
| Married-Couple | 3,174 (34.0%) | 3.28 |
| Single Male/Father | 438 (4.7%) | 3.13 |
| Single Female/Mother | 2,334 (25.0%) | 3.03 |
| Non-family | 3,402 (36.4%) | 1.16 |
| Total Households | 9,348 (100.0%) | 2.44 |
Household Size by Marriage Status in Hopewell
Out of a total of 9,348 households in Hopewell, 5,946 (63.6%) are family households, while 3,402 (36.4%) are nonfamily households. The most numerous type of family households are 2-person households, comprising 2,218, and the most common type of nonfamily households are 1-person households, comprising 2,855.
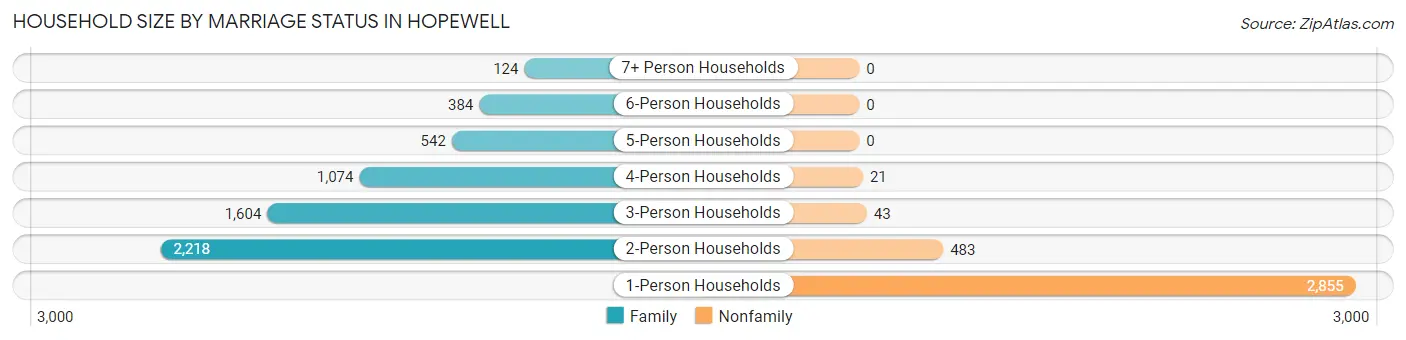
| Household Size | Family Households | Nonfamily Households |
| 1-Person Households | - | 2,855 (30.5%) |
| 2-Person Households | 2,218 (23.7%) | 483 (5.2%) |
| 3-Person Households | 1,604 (17.2%) | 43 (0.5%) |
| 4-Person Households | 1,074 (11.5%) | 21 (0.2%) |
| 5-Person Households | 542 (5.8%) | 0 (0.0%) |
| 6-Person Households | 384 (4.1%) | 0 (0.0%) |
| 7+ Person Households | 124 (1.3%) | 0 (0.0%) |
| Total | 5,946 (63.6%) | 3,402 (36.4%) |
Female Fertility in Hopewell
Fertility by Age in Hopewell
Average fertility rate in Hopewell is 59.0 births per 1,000 women. Women in the age bracket of 20 to 34 years have the highest fertility rate with 96.0 births per 1,000 women. Women in the age bracket of 20 to 34 years acount for 73.1% of all women with births.
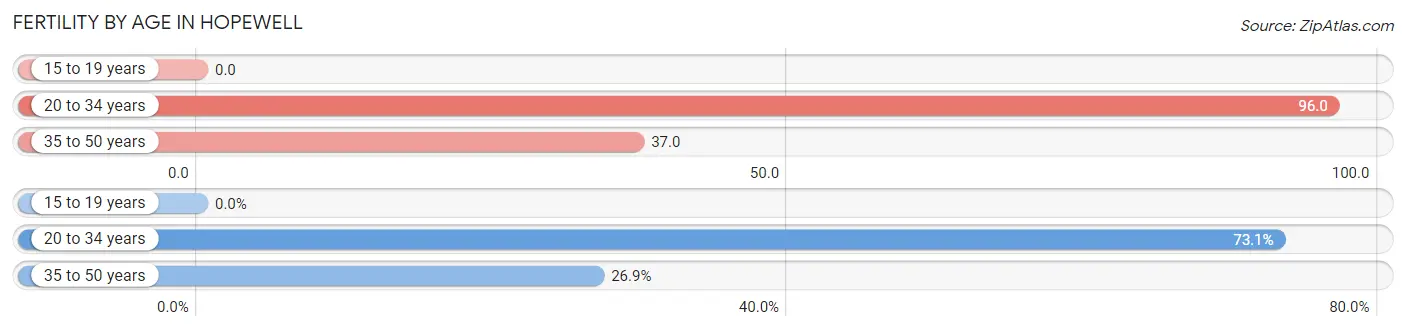
| Age Bracket | Women with Births | Births / 1,000 Women |
| 15 to 19 years | 0 (0.0%) | 0.0 |
| 20 to 34 years | 242 (73.1%) | 96.0 |
| 35 to 50 years | 89 (26.9%) | 37.0 |
| Total | 331 (100.0%) | 59.0 |
Fertility by Age by Marriage Status in Hopewell
27.5% of women with births (331) in Hopewell are married. The highest percentage of unmarried women with births falls into 20 to 34 years age bracket with 78.9% of them unmarried at the time of birth, while the lowest percentage of unmarried women with births belong to 35 to 50 years age bracket with 55.1% of them unmarried.
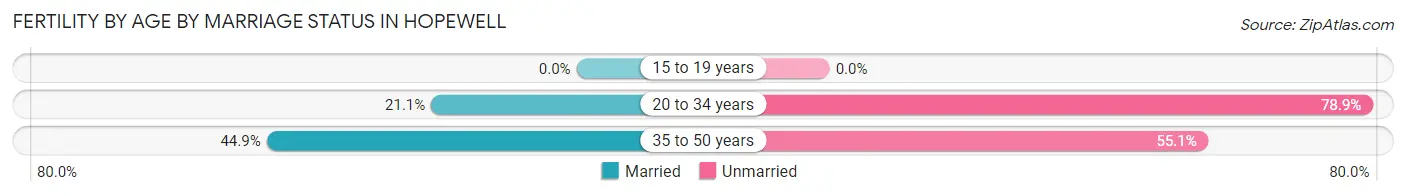
| Age Bracket | Married | Unmarried |
| 15 to 19 years | 0 (0.0%) | 0 (0.0%) |
| 20 to 34 years | 51 (21.1%) | 191 (78.9%) |
| 35 to 50 years | 40 (44.9%) | 49 (55.1%) |
| Total | 91 (27.5%) | 240 (72.5%) |
Fertility by Education in Hopewell
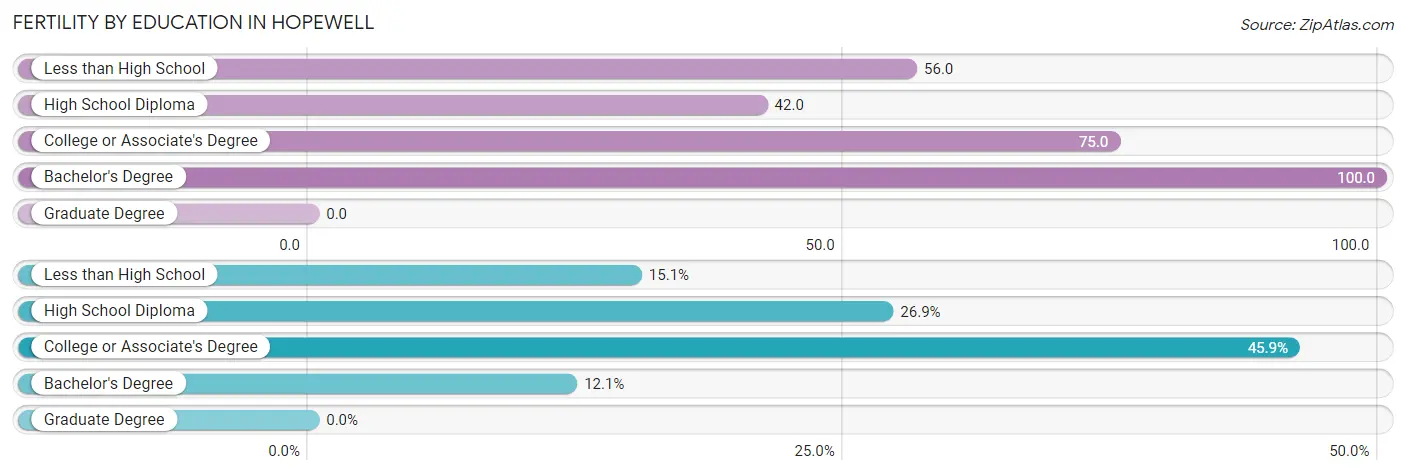
| Educational Attainment | Women with Births | Births / 1,000 Women |
| Less than High School | 50 (15.1%) | 56.0 |
| High School Diploma | 89 (26.9%) | 42.0 |
| College or Associate's Degree | 152 (45.9%) | 75.0 |
| Bachelor's Degree | 40 (12.1%) | 100.0 |
| Graduate Degree | 0 (0.0%) | 0.0 |
| Total | 331 (100.0%) | 59.0 |
Fertility by Education by Marriage Status in Hopewell
72.5% of women with births in Hopewell are unmarried. Women with the educational attainment of bachelor's degree are most likely to be married with 100.0% of them married at childbirth, while women with the educational attainment of less than high school are least likely to be married with 100.0% of them unmarried at childbirth.
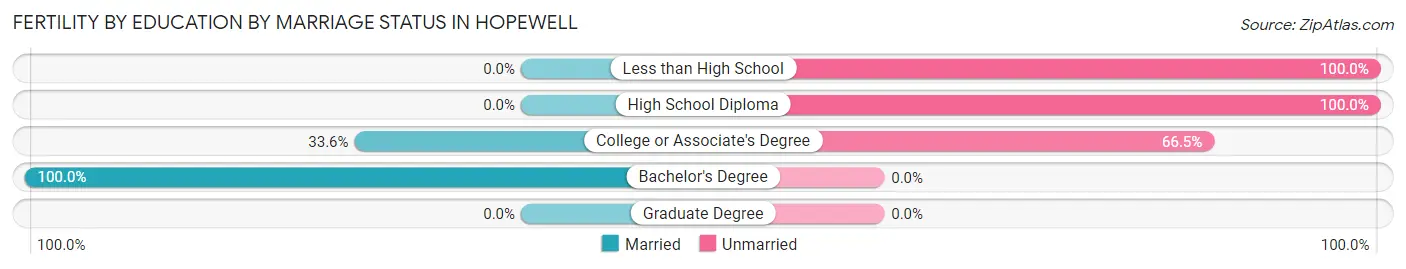
| Educational Attainment | Married | Unmarried |
| Less than High School | 0 (0.0%) | 50 (100.0%) |
| High School Diploma | 0 (0.0%) | 89 (100.0%) |
| College or Associate's Degree | 51 (33.6%) | 101 (66.4%) |
| Bachelor's Degree | 40 (100.0%) | 0 (0.0%) |
| Graduate Degree | 0 (0.0%) | 0 (0.0%) |
| Total | 91 (27.5%) | 240 (72.5%) |
Employment Characteristics in Hopewell
Employment by Class of Employer in Hopewell
Among the 9,431 employed individuals in Hopewell, private company employees (6,801 | 72.1%), federal government employees (698 | 7.4%), and local government employees (662 | 7.0%) make up the most common classes of employment.
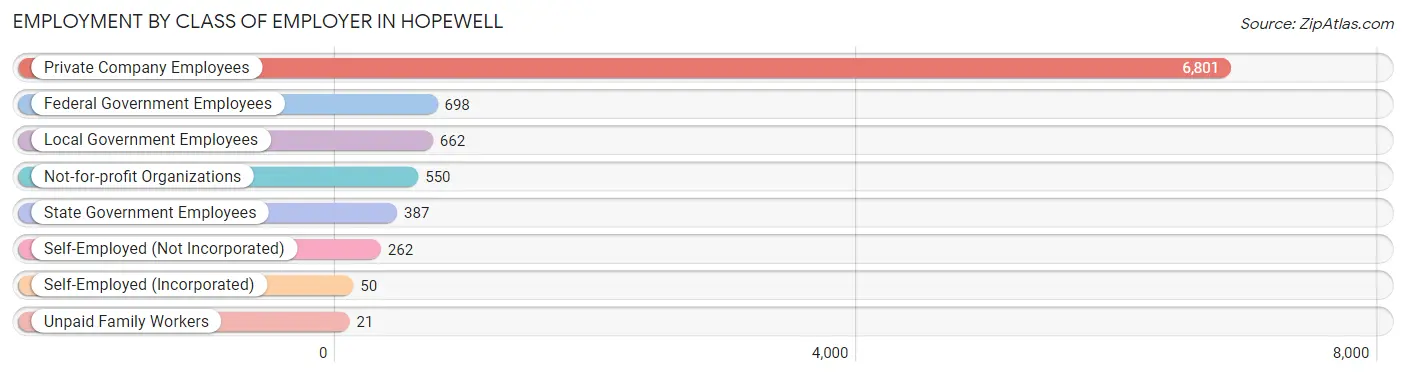
| Employer Class | # Employees | % Employees |
| Private Company Employees | 6,801 | 72.1% |
| Self-Employed (Incorporated) | 50 | 0.5% |
| Self-Employed (Not Incorporated) | 262 | 2.8% |
| Not-for-profit Organizations | 550 | 5.8% |
| Local Government Employees | 662 | 7.0% |
| State Government Employees | 387 | 4.1% |
| Federal Government Employees | 698 | 7.4% |
| Unpaid Family Workers | 21 | 0.2% |
| Total | 9,431 | 100.0% |
Employment Status by Age in Hopewell
According to the labor force statistics for Hopewell, out of the total population over 16 years of age (17,699), 60.2% or 10,655 individuals are in the labor force, with 8.8% or 938 of them unemployed. The age group with the highest labor force participation rate is 20 to 24 years, with 81.3% or 1,311 individuals in the labor force. Within the labor force, the 16 to 19 years age range has the highest percentage of unemployed individuals, with 27.7% or 87 of them being unemployed.
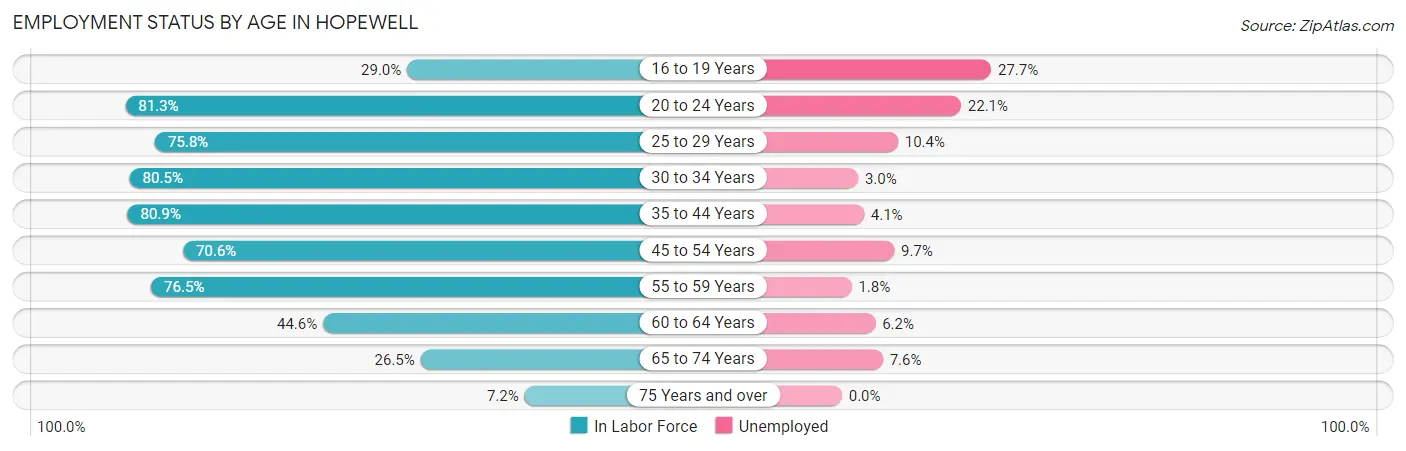
| Age Bracket | In Labor Force | Unemployed |
| 16 to 19 Years | 313 (29.0%) | 87 (27.7%) |
| 20 to 24 Years | 1,311 (81.3%) | 290 (22.1%) |
| 25 to 29 Years | 1,235 (75.8%) | 128 (10.4%) |
| 30 to 34 Years | 1,291 (80.5%) | 39 (3.0%) |
| 35 to 44 Years | 2,168 (80.9%) | 89 (4.1%) |
| 45 to 54 Years | 1,983 (70.6%) | 192 (9.7%) |
| 55 to 59 Years | 1,060 (76.5%) | 19 (1.8%) |
| 60 to 64 Years | 676 (44.6%) | 42 (6.2%) |
| 65 to 74 Years | 526 (26.5%) | 40 (7.6%) |
| 75 Years and over | 101 (7.2%) | 0 (0.0%) |
| Total | 10,655 (60.2%) | 938 (8.8%) |
Employment Status by Educational Attainment in Hopewell
According to labor force statistics for Hopewell, 72.4% of individuals (8,414) out of the total population between 25 and 64 years of age (11,622) are in the labor force, with 6.1% or 513 of them being unemployed. The group with the highest labor force participation rate are those with the educational attainment of college / associate degree, with 79.6% or 3,491 individuals in the labor force. Within the labor force, individuals with high school diploma education have the highest percentage of unemployment, with 9.6% or 304 of them being unemployed.
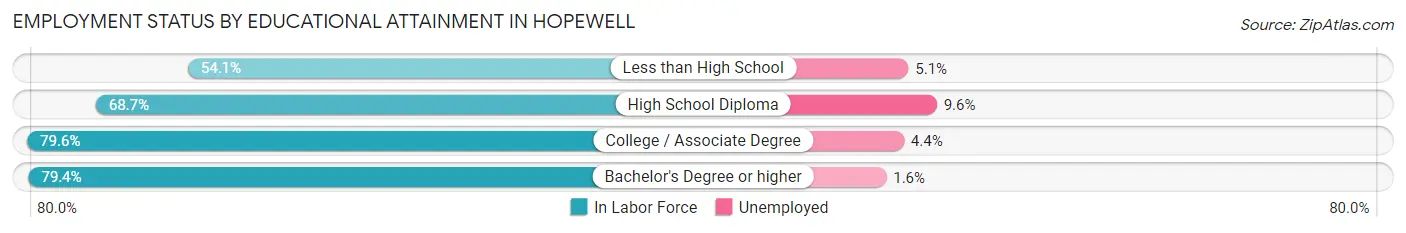
| Educational Attainment | In Labor Force | Unemployed |
| Less than High School | 707 (54.1%) | 67 (5.1%) |
| High School Diploma | 3,166 (68.7%) | 442 (9.6%) |
| College / Associate Degree | 3,491 (79.6%) | 193 (4.4%) |
| Bachelor's Degree or higher | 1,048 (79.4%) | 21 (1.6%) |
| Total | 8,414 (72.4%) | 709 (6.1%) |
Employment Occupations by Sex in Hopewell
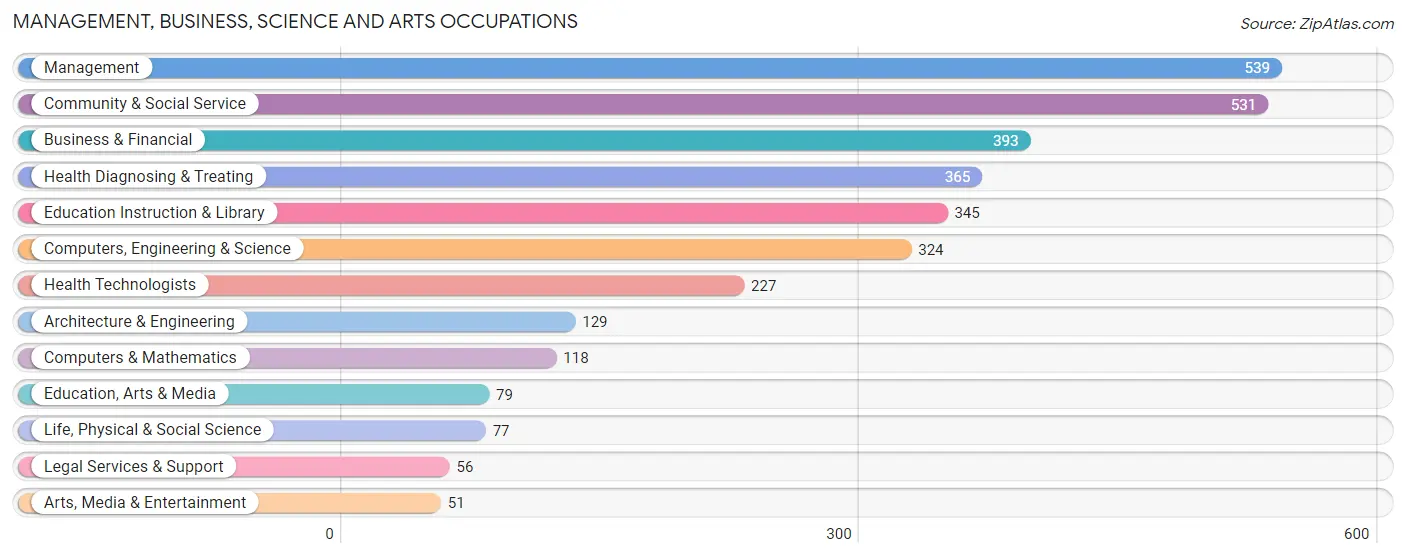
Management, Business, Science and Arts Occupations
The most common Management, Business, Science and Arts occupations in Hopewell are Management (539 | 5.6%), Community & Social Service (531 | 5.6%), Business & Financial (393 | 4.1%), Health Diagnosing & Treating (365 | 3.8%), and Education Instruction & Library (345 | 3.6%).
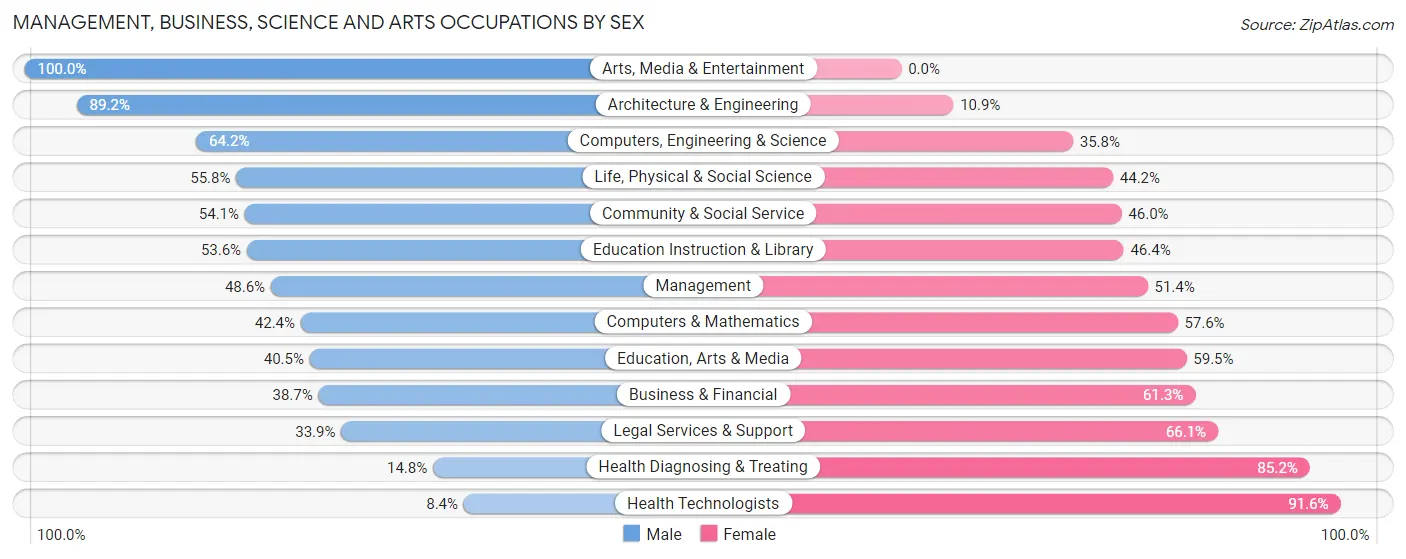
Management, Business, Science and Arts Occupations by Sex
Within the Management, Business, Science and Arts occupations in Hopewell, the most male-oriented occupations are Arts, Media & Entertainment (100.0%), Architecture & Engineering (89.1%), and Computers, Engineering & Science (64.2%), while the most female-oriented occupations are Health Technologists (91.6%), Health Diagnosing & Treating (85.2%), and Legal Services & Support (66.1%).
| Occupation | Male | Female |
| Management | 262 (48.6%) | 277 (51.4%) |
| Business & Financial | 152 (38.7%) | 241 (61.3%) |
| Computers, Engineering & Science | 208 (64.2%) | 116 (35.8%) |
| Computers & Mathematics | 50 (42.4%) | 68 (57.6%) |
| Architecture & Engineering | 115 (89.1%) | 14 (10.8%) |
| Life, Physical & Social Science | 43 (55.8%) | 34 (44.2%) |
| Community & Social Service | 287 (54.0%) | 244 (46.0%) |
| Education, Arts & Media | 32 (40.5%) | 47 (59.5%) |
| Legal Services & Support | 19 (33.9%) | 37 (66.1%) |
| Education Instruction & Library | 185 (53.6%) | 160 (46.4%) |
| Arts, Media & Entertainment | 51 (100.0%) | 0 (0.0%) |
| Health Diagnosing & Treating | 54 (14.8%) | 311 (85.2%) |
| Health Technologists | 19 (8.4%) | 208 (91.6%) |
| Total (Category) | 963 (44.8%) | 1,189 (55.2%) |
| Total (Overall) | 4,761 (49.8%) | 4,807 (50.2%) |
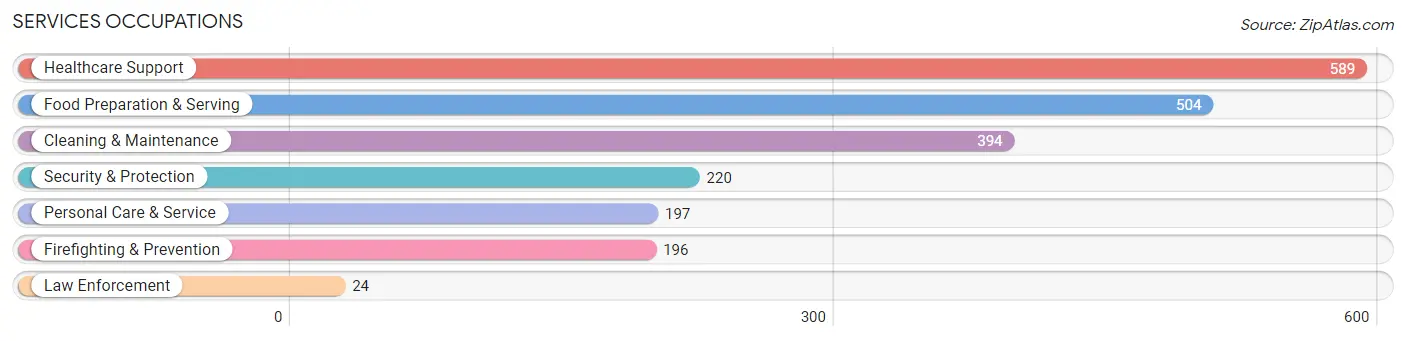
Services Occupations
The most common Services occupations in Hopewell are Healthcare Support (589 | 6.2%), Food Preparation & Serving (504 | 5.3%), Cleaning & Maintenance (394 | 4.1%), Security & Protection (220 | 2.3%), and Personal Care & Service (197 | 2.1%).
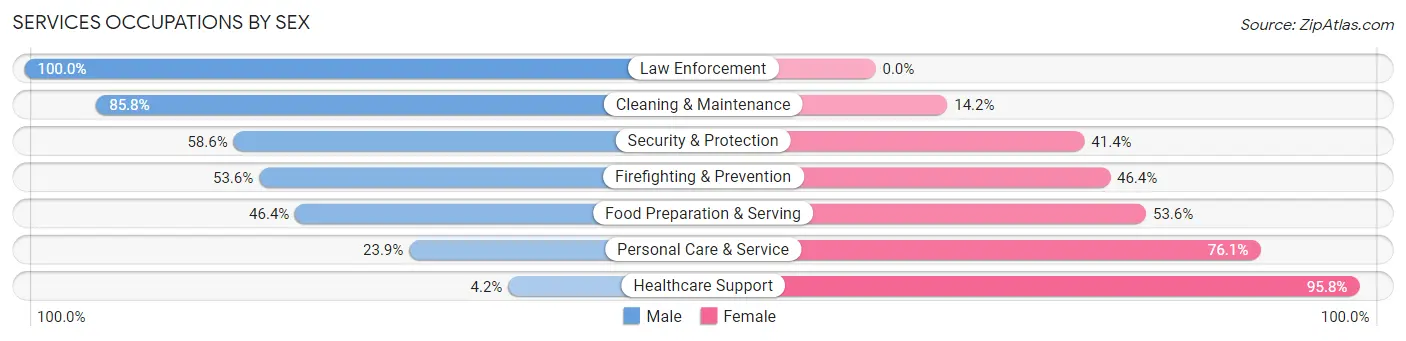
Services Occupations by Sex
Within the Services occupations in Hopewell, the most male-oriented occupations are Law Enforcement (100.0%), Cleaning & Maintenance (85.8%), and Security & Protection (58.6%), while the most female-oriented occupations are Healthcare Support (95.8%), Personal Care & Service (76.1%), and Food Preparation & Serving (53.6%).
| Occupation | Male | Female |
| Healthcare Support | 25 (4.2%) | 564 (95.8%) |
| Security & Protection | 129 (58.6%) | 91 (41.4%) |
| Firefighting & Prevention | 105 (53.6%) | 91 (46.4%) |
| Law Enforcement | 24 (100.0%) | 0 (0.0%) |
| Food Preparation & Serving | 234 (46.4%) | 270 (53.6%) |
| Cleaning & Maintenance | 338 (85.8%) | 56 (14.2%) |
| Personal Care & Service | 47 (23.9%) | 150 (76.1%) |
| Total (Category) | 773 (40.6%) | 1,131 (59.4%) |
| Total (Overall) | 4,761 (49.8%) | 4,807 (50.2%) |
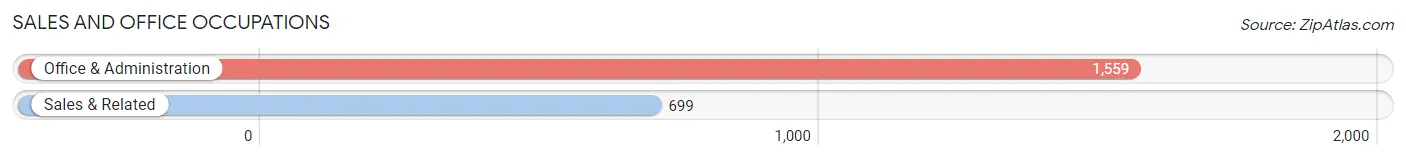
Sales and Office Occupations
The most common Sales and Office occupations in Hopewell are Office & Administration (1,559 | 16.3%), and Sales & Related (699 | 7.3%).
Sales and Office Occupations by Sex
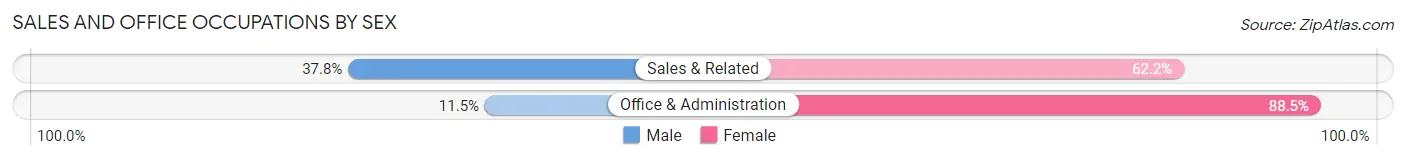
| Occupation | Male | Female |
| Sales & Related | 264 (37.8%) | 435 (62.2%) |
| Office & Administration | 179 (11.5%) | 1,380 (88.5%) |
| Total (Category) | 443 (19.6%) | 1,815 (80.4%) |
| Total (Overall) | 4,761 (49.8%) | 4,807 (50.2%) |
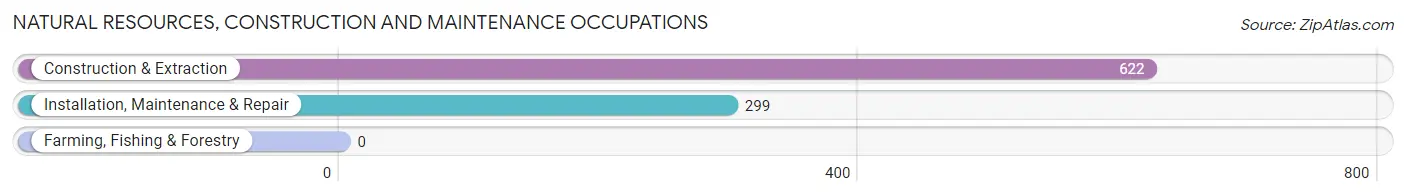
Natural Resources, Construction and Maintenance Occupations
The most common Natural Resources, Construction and Maintenance occupations in Hopewell are Construction & Extraction (622 | 6.5%), and Installation, Maintenance & Repair (299 | 3.1%).
Natural Resources, Construction and Maintenance Occupations by Sex
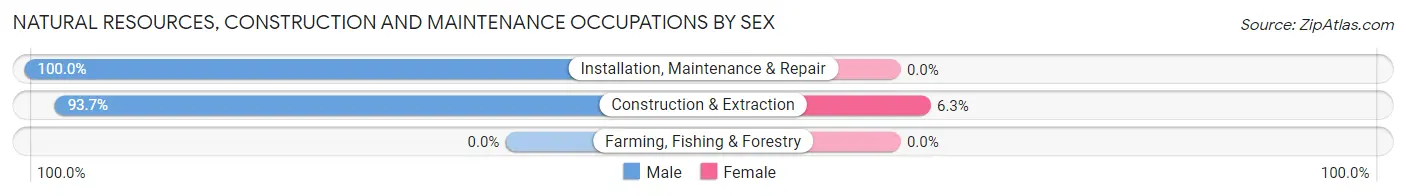
| Occupation | Male | Female |
| Farming, Fishing & Forestry | 0 (0.0%) | 0 (0.0%) |
| Construction & Extraction | 583 (93.7%) | 39 (6.3%) |
| Installation, Maintenance & Repair | 299 (100.0%) | 0 (0.0%) |
| Total (Category) | 882 (95.8%) | 39 (4.2%) |
| Total (Overall) | 4,761 (49.8%) | 4,807 (50.2%) |
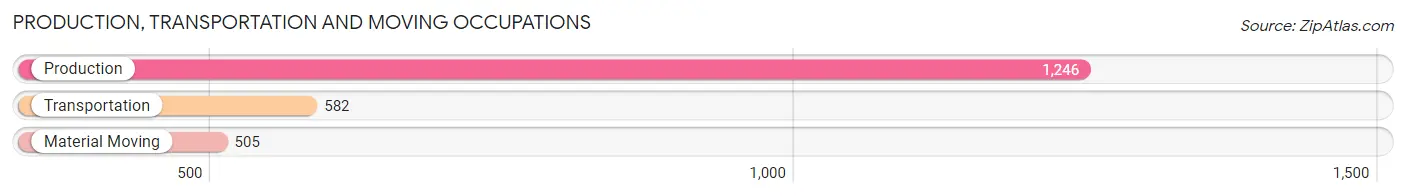
Production, Transportation and Moving Occupations
The most common Production, Transportation and Moving occupations in Hopewell are Production (1,246 | 13.0%), Transportation (582 | 6.1%), and Material Moving (505 | 5.3%).
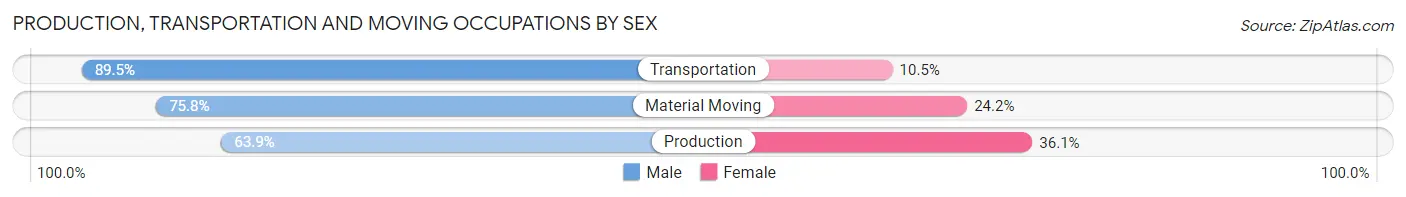
Production, Transportation and Moving Occupations by Sex
| Occupation | Male | Female |
| Production | 796 (63.9%) | 450 (36.1%) |
| Transportation | 521 (89.5%) | 61 (10.5%) |
| Material Moving | 383 (75.8%) | 122 (24.2%) |
| Total (Category) | 1,700 (72.9%) | 633 (27.1%) |
| Total (Overall) | 4,761 (49.8%) | 4,807 (50.2%) |
Employment Industries by Sex in Hopewell
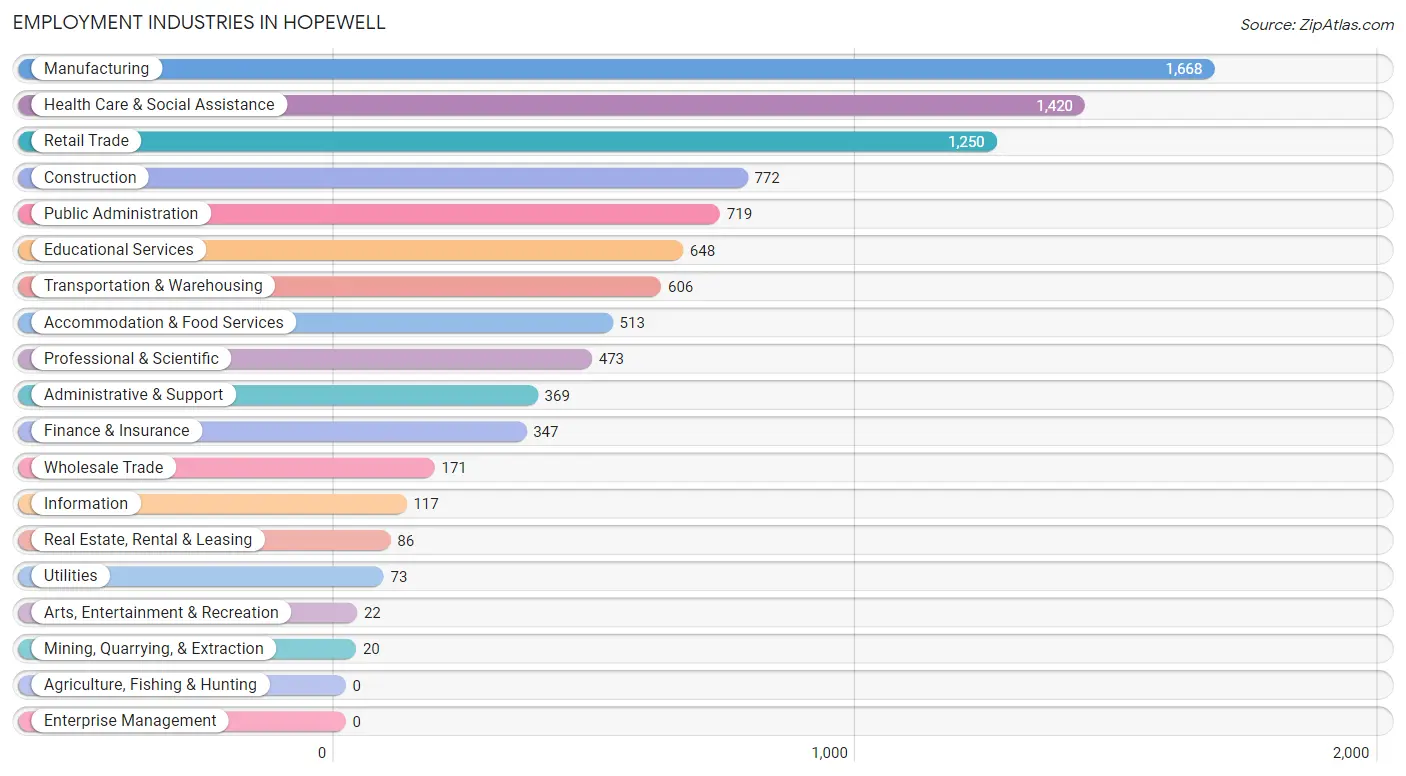
Employment Industries in Hopewell
The major employment industries in Hopewell include Manufacturing (1,668 | 17.4%), Health Care & Social Assistance (1,420 | 14.8%), Retail Trade (1,250 | 13.1%), Construction (772 | 8.1%), and Public Administration (719 | 7.5%).
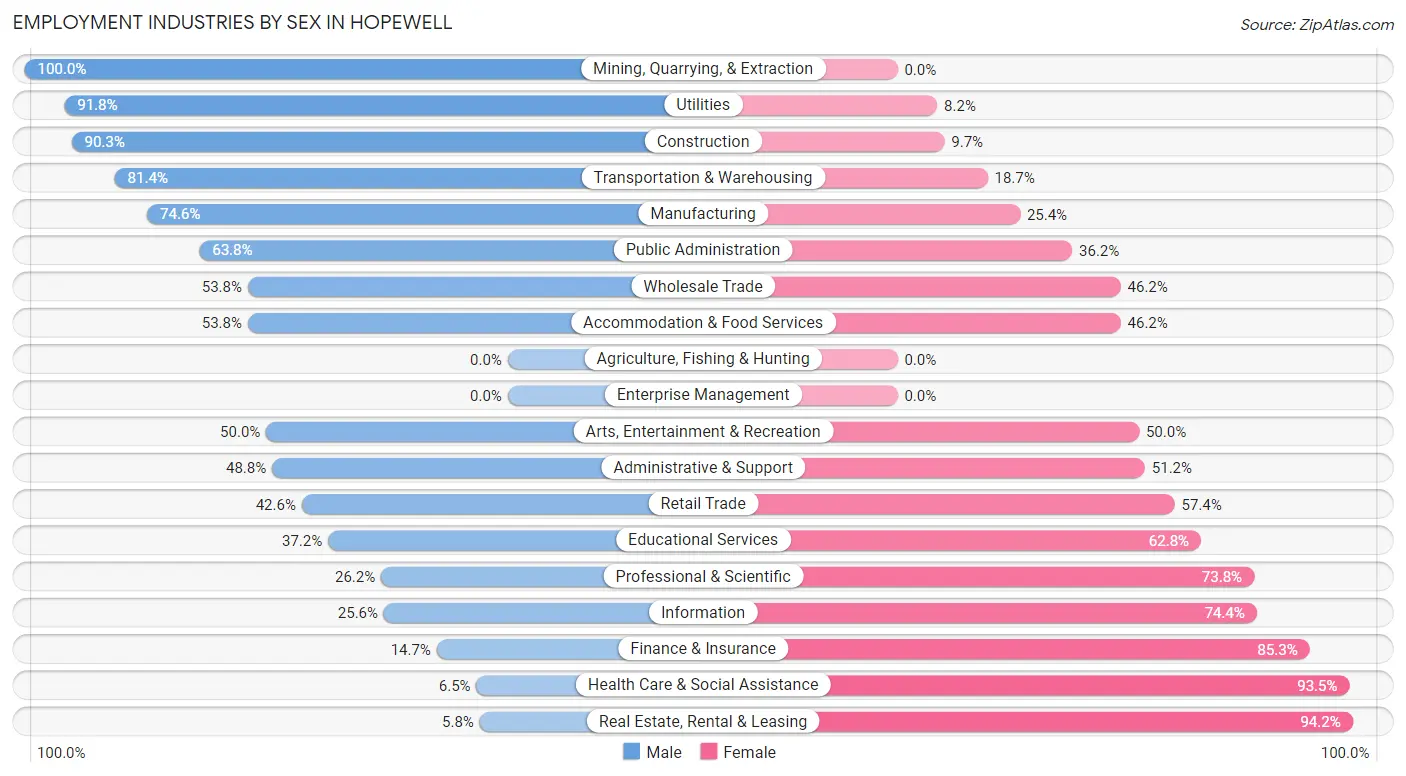
Employment Industries by Sex in Hopewell
The Hopewell industries that see more men than women are Mining, Quarrying, & Extraction (100.0%), Utilities (91.8%), and Construction (90.3%), whereas the industries that tend to have a higher number of women are Real Estate, Rental & Leasing (94.2%), Health Care & Social Assistance (93.5%), and Finance & Insurance (85.3%).
| Industry | Male | Female |
| Agriculture, Fishing & Hunting | 0 (0.0%) | 0 (0.0%) |
| Mining, Quarrying, & Extraction | 20 (100.0%) | 0 (0.0%) |
| Construction | 697 (90.3%) | 75 (9.7%) |
| Manufacturing | 1,245 (74.6%) | 423 (25.4%) |
| Wholesale Trade | 92 (53.8%) | 79 (46.2%) |
| Retail Trade | 533 (42.6%) | 717 (57.4%) |
| Transportation & Warehousing | 493 (81.4%) | 113 (18.6%) |
| Utilities | 67 (91.8%) | 6 (8.2%) |
| Information | 30 (25.6%) | 87 (74.4%) |
| Finance & Insurance | 51 (14.7%) | 296 (85.3%) |
| Real Estate, Rental & Leasing | 5 (5.8%) | 81 (94.2%) |
| Professional & Scientific | 124 (26.2%) | 349 (73.8%) |
| Enterprise Management | 0 (0.0%) | 0 (0.0%) |
| Administrative & Support | 180 (48.8%) | 189 (51.2%) |
| Educational Services | 241 (37.2%) | 407 (62.8%) |
| Health Care & Social Assistance | 92 (6.5%) | 1,328 (93.5%) |
| Arts, Entertainment & Recreation | 11 (50.0%) | 11 (50.0%) |
| Accommodation & Food Services | 276 (53.8%) | 237 (46.2%) |
| Public Administration | 459 (63.8%) | 260 (36.2%) |
| Total | 4,761 (49.8%) | 4,807 (50.2%) |
Education in Hopewell
School Enrollment in Hopewell
The most common levels of schooling among the 5,822 students in Hopewell are elementary school (1,846 | 31.7%), high school (1,252 | 21.5%), and middle school (1,181 | 20.3%).
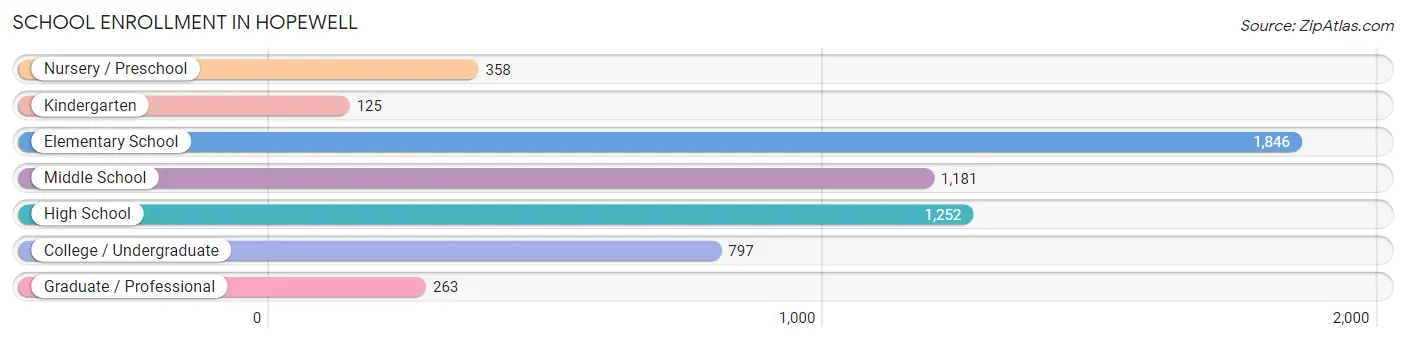
| School Level | # Students | % Students |
| Nursery / Preschool | 358 | 6.1% |
| Kindergarten | 125 | 2.1% |
| Elementary School | 1,846 | 31.7% |
| Middle School | 1,181 | 20.3% |
| High School | 1,252 | 21.5% |
| College / Undergraduate | 797 | 13.7% |
| Graduate / Professional | 263 | 4.5% |
| Total | 5,822 | 100.0% |
School Enrollment by Age by Funding Source in Hopewell
Out of a total of 5,822 students who are enrolled in schools in Hopewell, 512 (8.8%) attend a private institution, while the remaining 5,310 (91.2%) are enrolled in public schools. The age group of 20 to 24 year olds has the highest likelihood of being enrolled in private schools, with 184 (47.1% in the age bracket) enrolled. Conversely, the age group of 18 to 19 year olds has the lowest likelihood of being enrolled in a private school, with 287 (100.0% in the age bracket) attending a public institution.
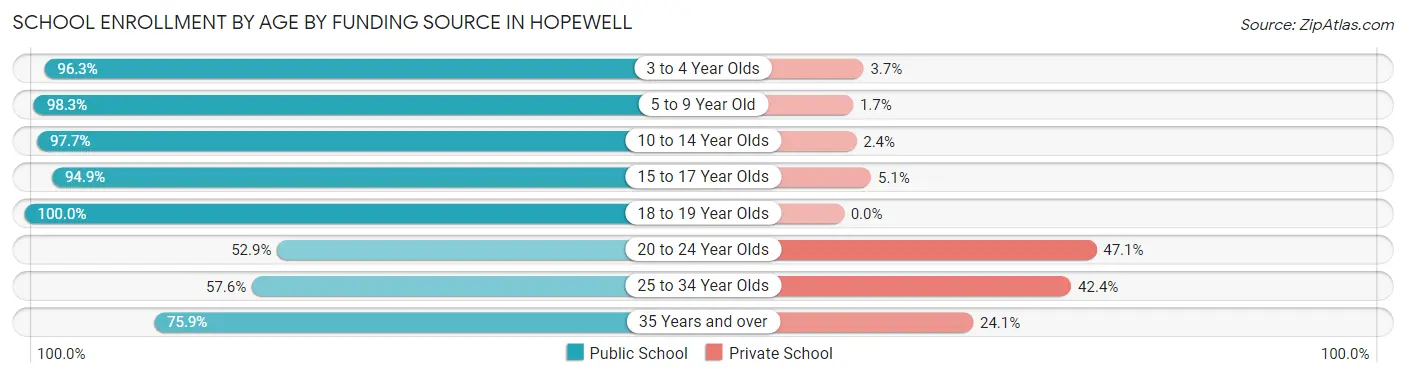
| Age Bracket | Public School | Private School |
| 3 to 4 Year Olds | 287 (96.3%) | 11 (3.7%) |
| 5 to 9 Year Old | 1,822 (98.3%) | 32 (1.7%) |
| 10 to 14 Year Olds | 1,415 (97.7%) | 34 (2.4%) |
| 15 to 17 Year Olds | 819 (94.9%) | 44 (5.1%) |
| 18 to 19 Year Olds | 287 (100.0%) | 0 (0.0%) |
| 20 to 24 Year Olds | 207 (52.9%) | 184 (47.1%) |
| 25 to 34 Year Olds | 136 (57.6%) | 100 (42.4%) |
| 35 Years and over | 337 (75.9%) | 107 (24.1%) |
| Total | 5,310 (91.2%) | 512 (8.8%) |
Educational Attainment by Field of Study in Hopewell
Business (449 | 23.1%), arts & humanities (243 | 12.5%), liberal arts & history (205 | 10.5%), social sciences (203 | 10.4%), and education (151 | 7.8%) are the most common fields of study among 1,945 individuals in Hopewell who have obtained a bachelor's degree or higher.
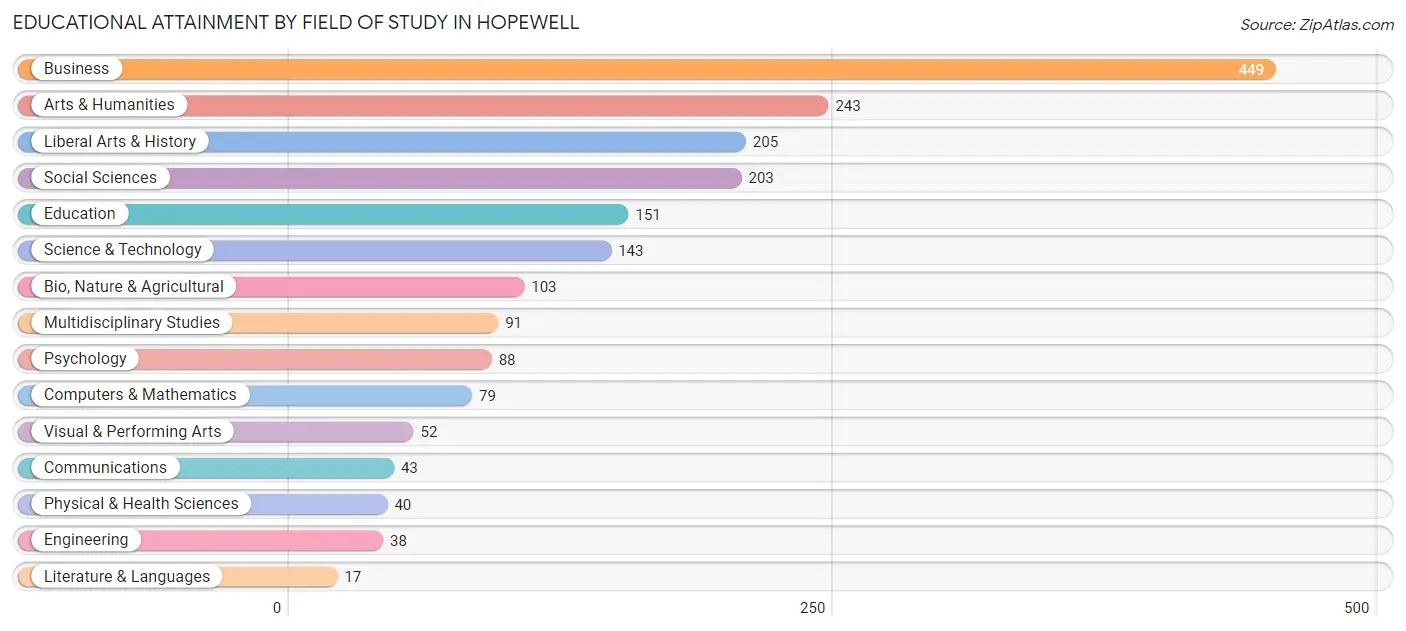
| Field of Study | # Graduates | % Graduates |
| Computers & Mathematics | 79 | 4.1% |
| Bio, Nature & Agricultural | 103 | 5.3% |
| Physical & Health Sciences | 40 | 2.1% |
| Psychology | 88 | 4.5% |
| Social Sciences | 203 | 10.4% |
| Engineering | 38 | 1.9% |
| Multidisciplinary Studies | 91 | 4.7% |
| Science & Technology | 143 | 7.3% |
| Business | 449 | 23.1% |
| Education | 151 | 7.8% |
| Literature & Languages | 17 | 0.9% |
| Liberal Arts & History | 205 | 10.5% |
| Visual & Performing Arts | 52 | 2.7% |
| Communications | 43 | 2.2% |
| Arts & Humanities | 243 | 12.5% |
| Total | 1,945 | 100.0% |
Transportation & Commute in Hopewell
Vehicle Availability by Sex in Hopewell
The most prevalent vehicle ownership categories in Hopewell are males with 3 vehicles (1,768, accounting for 36.2%) and females with 3 vehicles (1,336, making up 38.9%).
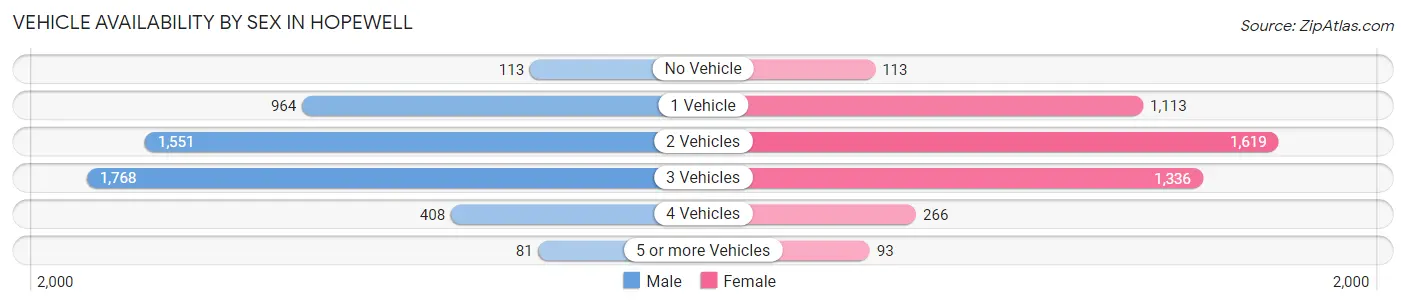
| Vehicles Available | Male | Female |
| No Vehicle | 113 (2.3%) | 113 (2.5%) |
| 1 Vehicle | 964 (19.7%) | 1,113 (24.5%) |
| 2 Vehicles | 1,551 (31.8%) | 1,619 (35.7%) |
| 3 Vehicles | 1,768 (36.2%) | 1,336 (29.4%) |
| 4 Vehicles | 408 (8.4%) | 266 (5.9%) |
| 5 or more Vehicles | 81 (1.7%) | 93 (2.1%) |
| Total | 4,885 (100.0%) | 4,540 (100.0%) |
Commute Time in Hopewell
The most frequently occuring commute durations in Hopewell are 10 to 14 minutes (1,439 commuters, 16.3%), 30 to 34 minutes (1,270 commuters, 14.4%), and 20 to 24 minutes (1,227 commuters, 13.9%).
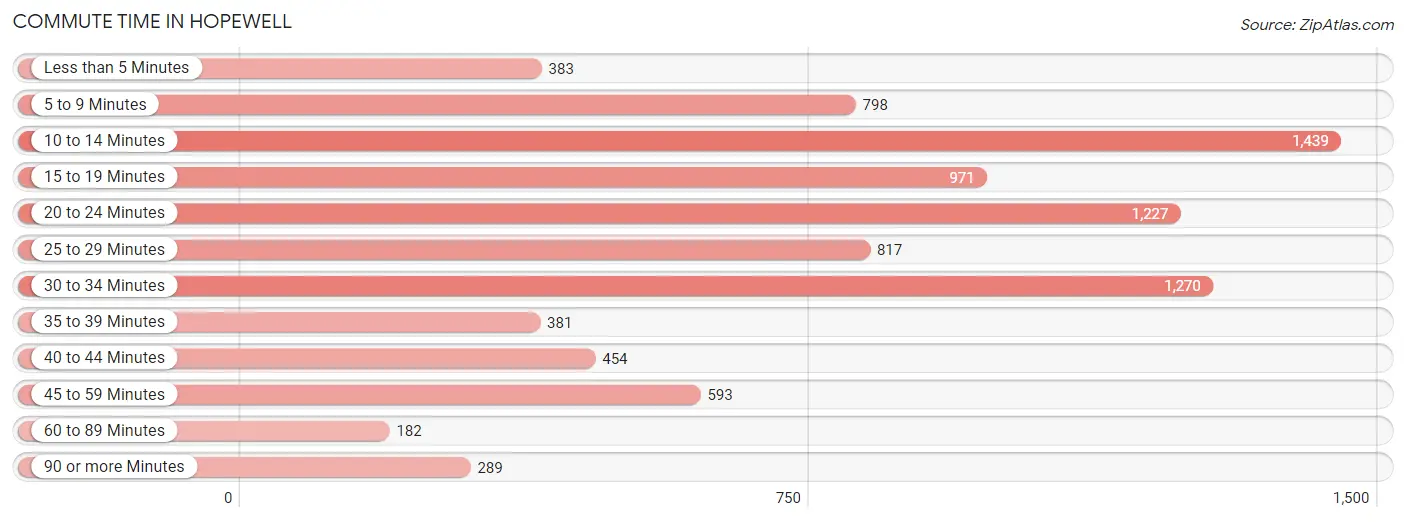
| Commute Time | # Commuters | % Commuters |
| Less than 5 Minutes | 383 | 4.3% |
| 5 to 9 Minutes | 798 | 9.1% |
| 10 to 14 Minutes | 1,439 | 16.3% |
| 15 to 19 Minutes | 971 | 11.0% |
| 20 to 24 Minutes | 1,227 | 13.9% |
| 25 to 29 Minutes | 817 | 9.3% |
| 30 to 34 Minutes | 1,270 | 14.4% |
| 35 to 39 Minutes | 381 | 4.3% |
| 40 to 44 Minutes | 454 | 5.2% |
| 45 to 59 Minutes | 593 | 6.7% |
| 60 to 89 Minutes | 182 | 2.1% |
| 90 or more Minutes | 289 | 3.3% |
Commute Time by Sex in Hopewell
The most common commute times in Hopewell are 30 to 34 minutes (919 commuters, 19.4%) for males and 10 to 14 minutes (669 commuters, 16.5%) for females.
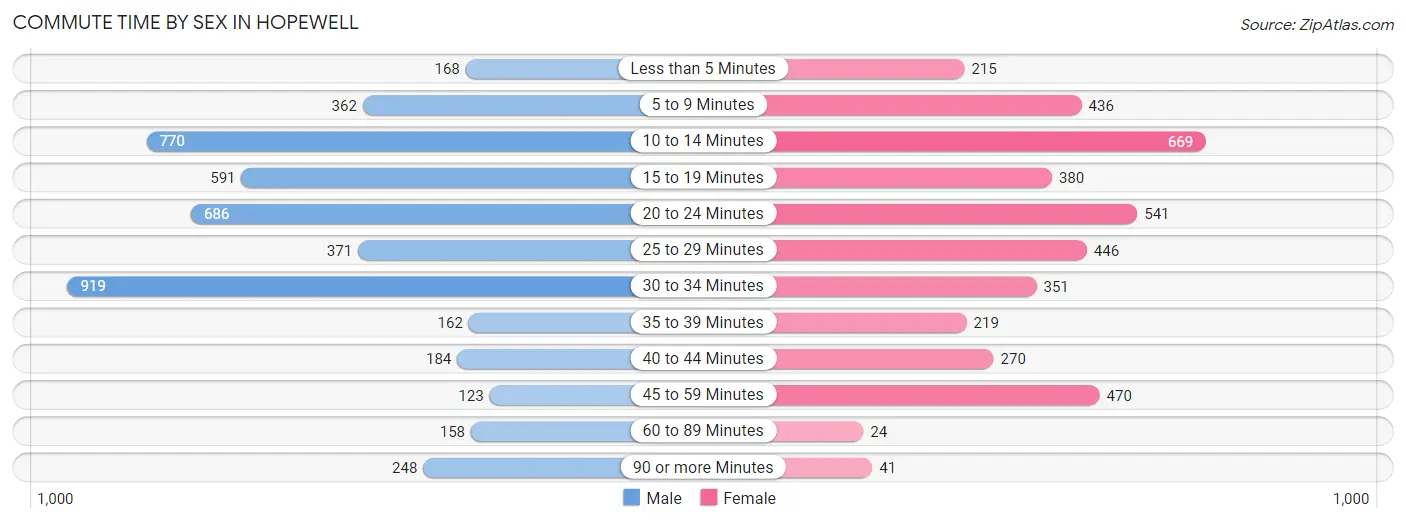
| Commute Time | Male | Female |
| Less than 5 Minutes | 168 (3.5%) | 215 (5.3%) |
| 5 to 9 Minutes | 362 (7.6%) | 436 (10.7%) |
| 10 to 14 Minutes | 770 (16.2%) | 669 (16.5%) |
| 15 to 19 Minutes | 591 (12.5%) | 380 (9.3%) |
| 20 to 24 Minutes | 686 (14.5%) | 541 (13.3%) |
| 25 to 29 Minutes | 371 (7.8%) | 446 (11.0%) |
| 30 to 34 Minutes | 919 (19.4%) | 351 (8.6%) |
| 35 to 39 Minutes | 162 (3.4%) | 219 (5.4%) |
| 40 to 44 Minutes | 184 (3.9%) | 270 (6.7%) |
| 45 to 59 Minutes | 123 (2.6%) | 470 (11.6%) |
| 60 to 89 Minutes | 158 (3.3%) | 24 (0.6%) |
| 90 or more Minutes | 248 (5.2%) | 41 (1.0%) |
Time of Departure to Work by Sex in Hopewell
The most frequent times of departure to work in Hopewell are 4:00 PM to 11:59 PM (683, 14.4%) for males and 6:30 AM to 6:59 AM (609, 15.0%) for females.
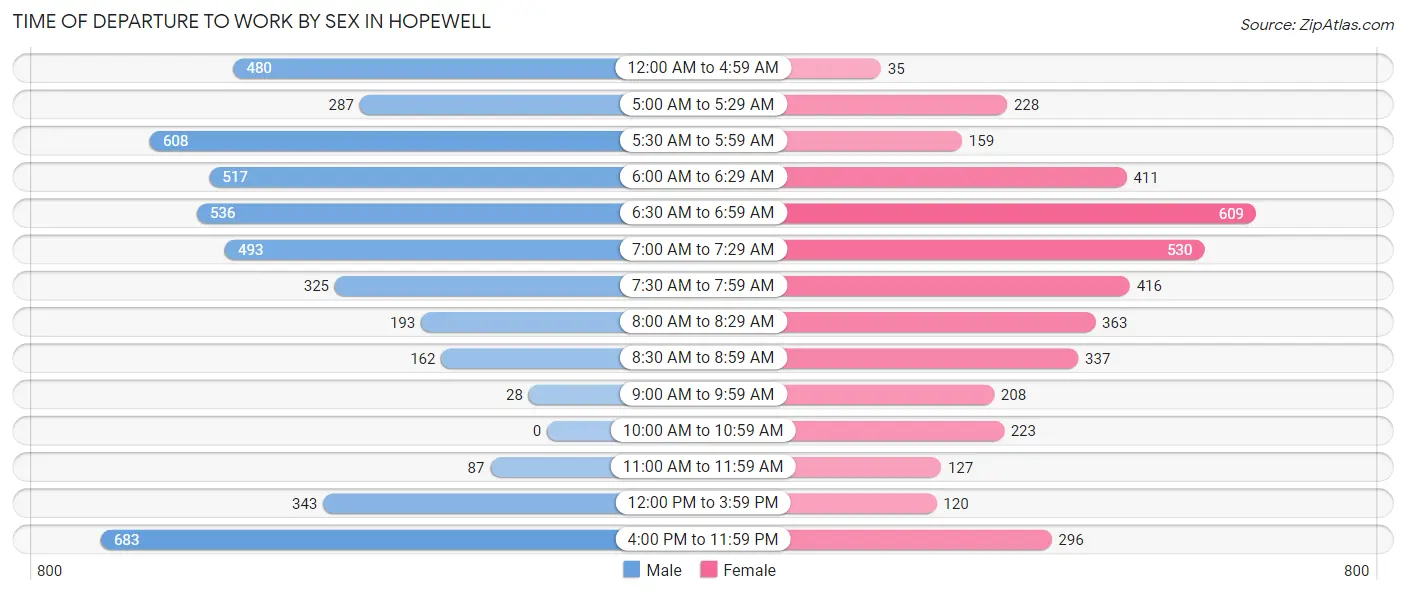
| Time of Departure | Male | Female |
| 12:00 AM to 4:59 AM | 480 (10.1%) | 35 (0.9%) |
| 5:00 AM to 5:29 AM | 287 (6.0%) | 228 (5.6%) |
| 5:30 AM to 5:59 AM | 608 (12.8%) | 159 (3.9%) |
| 6:00 AM to 6:29 AM | 517 (10.9%) | 411 (10.1%) |
| 6:30 AM to 6:59 AM | 536 (11.3%) | 609 (15.0%) |
| 7:00 AM to 7:29 AM | 493 (10.4%) | 530 (13.1%) |
| 7:30 AM to 7:59 AM | 325 (6.9%) | 416 (10.2%) |
| 8:00 AM to 8:29 AM | 193 (4.1%) | 363 (8.9%) |
| 8:30 AM to 8:59 AM | 162 (3.4%) | 337 (8.3%) |
| 9:00 AM to 9:59 AM | 28 (0.6%) | 208 (5.1%) |
| 10:00 AM to 10:59 AM | 0 (0.0%) | 223 (5.5%) |
| 11:00 AM to 11:59 AM | 87 (1.8%) | 127 (3.1%) |
| 12:00 PM to 3:59 PM | 343 (7.2%) | 120 (2.9%) |
| 4:00 PM to 11:59 PM | 683 (14.4%) | 296 (7.3%) |
| Total | 4,742 (100.0%) | 4,062 (100.0%) |
Housing Occupancy in Hopewell
Occupancy by Ownership in Hopewell
Of the total 9,348 dwellings in Hopewell, owner-occupied units account for 5,007 (53.6%), while renter-occupied units make up 4,341 (46.4%).
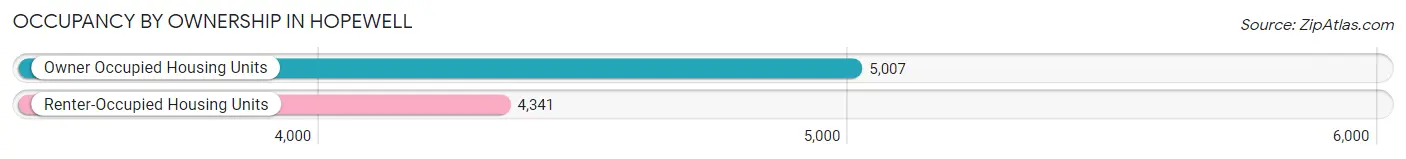
| Occupancy | # Housing Units | % Housing Units |
| Owner Occupied Housing Units | 5,007 | 53.6% |
| Renter-Occupied Housing Units | 4,341 | 46.4% |
| Total Occupied Housing Units | 9,348 | 100.0% |
Occupancy by Household Size in Hopewell
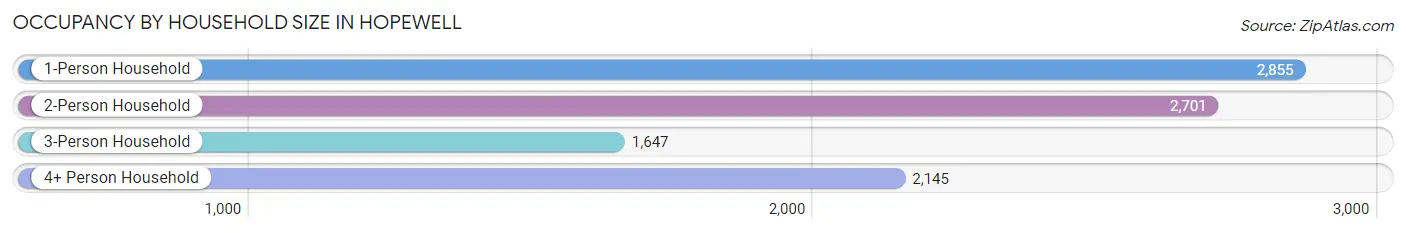
| Household Size | # Housing Units | % Housing Units |
| 1-Person Household | 2,855 | 30.5% |
| 2-Person Household | 2,701 | 28.9% |
| 3-Person Household | 1,647 | 17.6% |
| 4+ Person Household | 2,145 | 23.0% |
| Total Housing Units | 9,348 | 100.0% |
Occupancy by Ownership by Household Size in Hopewell
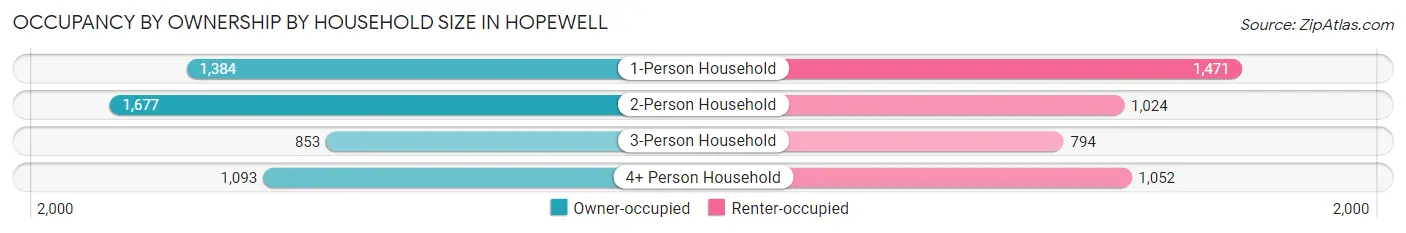
| Household Size | Owner-occupied | Renter-occupied |
| 1-Person Household | 1,384 (48.5%) | 1,471 (51.5%) |
| 2-Person Household | 1,677 (62.1%) | 1,024 (37.9%) |
| 3-Person Household | 853 (51.8%) | 794 (48.2%) |
| 4+ Person Household | 1,093 (51.0%) | 1,052 (49.0%) |
| Total Housing Units | 5,007 (53.6%) | 4,341 (46.4%) |
Occupancy by Educational Attainment in Hopewell
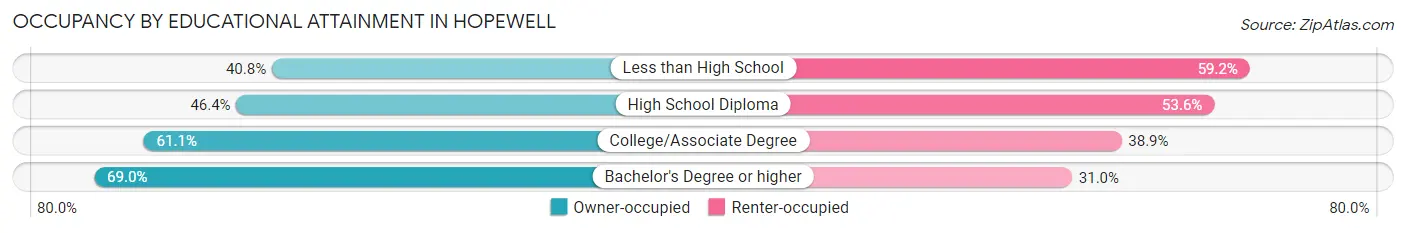
| Household Size | Owner-occupied | Renter-occupied |
| Less than High School | 450 (40.8%) | 654 (59.2%) |
| High School Diploma | 1,790 (46.4%) | 2,068 (53.6%) |
| College/Associate Degree | 2,005 (61.1%) | 1,276 (38.9%) |
| Bachelor's Degree or higher | 762 (69.0%) | 343 (31.0%) |
Occupancy by Age of Householder in Hopewell
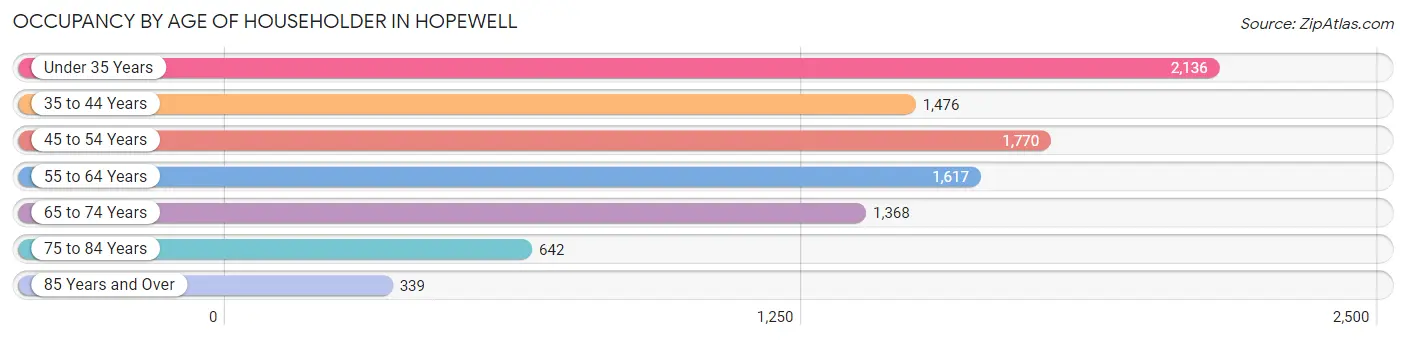
| Age Bracket | # Households | % Households |
| Under 35 Years | 2,136 | 22.9% |
| 35 to 44 Years | 1,476 | 15.8% |
| 45 to 54 Years | 1,770 | 18.9% |
| 55 to 64 Years | 1,617 | 17.3% |
| 65 to 74 Years | 1,368 | 14.6% |
| 75 to 84 Years | 642 | 6.9% |
| 85 Years and Over | 339 | 3.6% |
| Total | 9,348 | 100.0% |
Housing Finances in Hopewell
Median Income by Occupancy in Hopewell
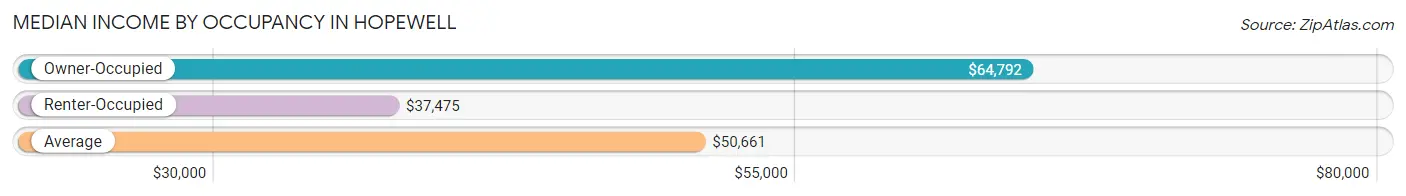
| Occupancy Type | # Households | Median Income |
| Owner-Occupied | 5,007 (53.6%) | $64,792 |
| Renter-Occupied | 4,341 (46.4%) | $37,475 |
| Average | 9,348 (100.0%) | $50,661 |
Occupancy by Householder Income Bracket in Hopewell
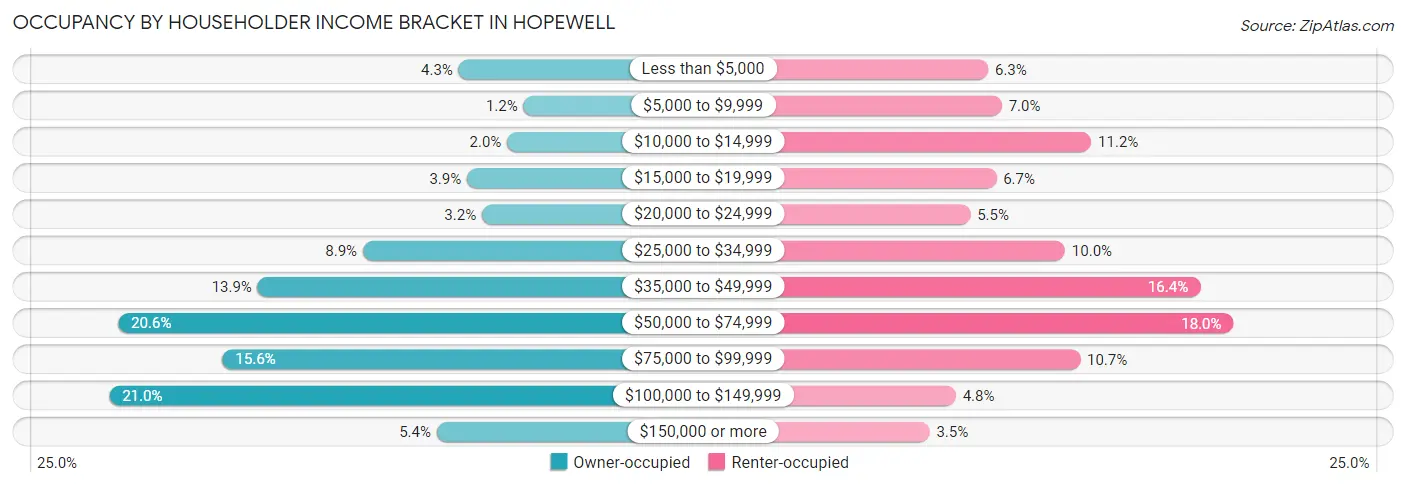
| Income Bracket | Owner-occupied | Renter-occupied |
| Less than $5,000 | 217 (4.3%) | 274 (6.3%) |
| $5,000 to $9,999 | 62 (1.2%) | 302 (7.0%) |
| $10,000 to $14,999 | 101 (2.0%) | 487 (11.2%) |
| $15,000 to $19,999 | 197 (3.9%) | 291 (6.7%) |
| $20,000 to $24,999 | 161 (3.2%) | 237 (5.5%) |
| $25,000 to $34,999 | 445 (8.9%) | 433 (10.0%) |
| $35,000 to $49,999 | 696 (13.9%) | 712 (16.4%) |
| $50,000 to $74,999 | 1,029 (20.5%) | 781 (18.0%) |
| $75,000 to $99,999 | 780 (15.6%) | 464 (10.7%) |
| $100,000 to $149,999 | 1,050 (21.0%) | 207 (4.8%) |
| $150,000 or more | 269 (5.4%) | 153 (3.5%) |
| Total | 5,007 (100.0%) | 4,341 (100.0%) |
Monthly Housing Cost Tiers in Hopewell
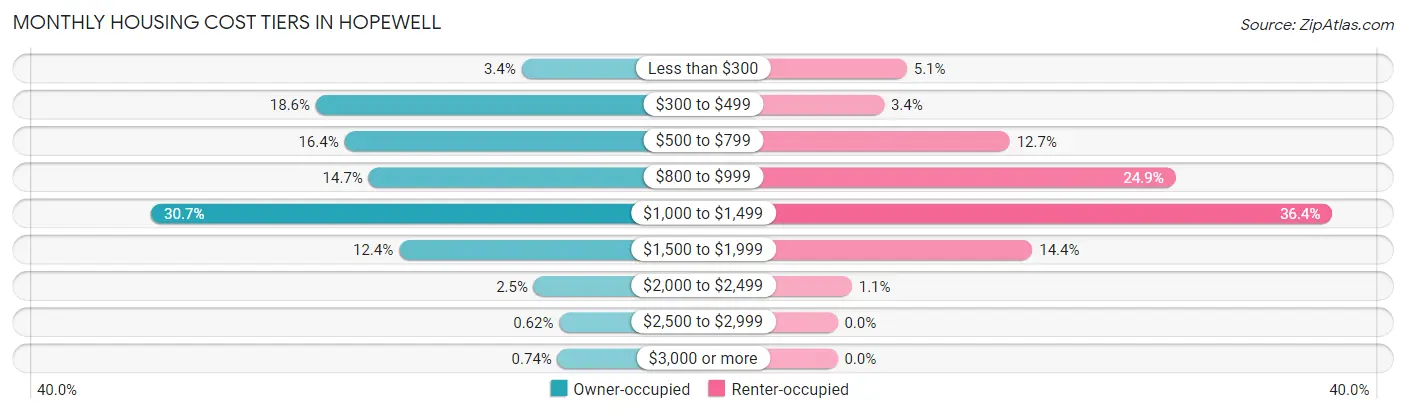
| Monthly Cost | Owner-occupied | Renter-occupied |
| Less than $300 | 170 (3.4%) | 222 (5.1%) |
| $300 to $499 | 929 (18.5%) | 149 (3.4%) |
| $500 to $799 | 823 (16.4%) | 551 (12.7%) |
| $800 to $999 | 734 (14.7%) | 1,081 (24.9%) |
| $1,000 to $1,499 | 1,536 (30.7%) | 1,582 (36.4%) |
| $1,500 to $1,999 | 622 (12.4%) | 623 (14.3%) |
| $2,000 to $2,499 | 125 (2.5%) | 46 (1.1%) |
| $2,500 to $2,999 | 31 (0.6%) | 0 (0.0%) |
| $3,000 or more | 37 (0.7%) | 0 (0.0%) |
| Total | 5,007 (100.0%) | 4,341 (100.0%) |
Physical Housing Characteristics in Hopewell
Housing Structures in Hopewell
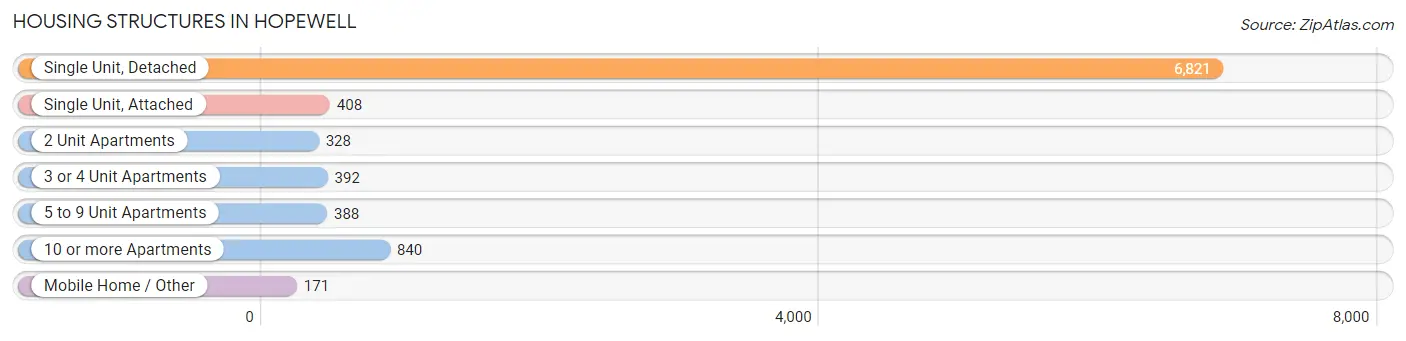
| Structure Type | # Housing Units | % Housing Units |
| Single Unit, Detached | 6,821 | 73.0% |
| Single Unit, Attached | 408 | 4.4% |
| 2 Unit Apartments | 328 | 3.5% |
| 3 or 4 Unit Apartments | 392 | 4.2% |
| 5 to 9 Unit Apartments | 388 | 4.2% |
| 10 or more Apartments | 840 | 9.0% |
| Mobile Home / Other | 171 | 1.8% |
| Total | 9,348 | 100.0% |
Housing Structures by Occupancy in Hopewell
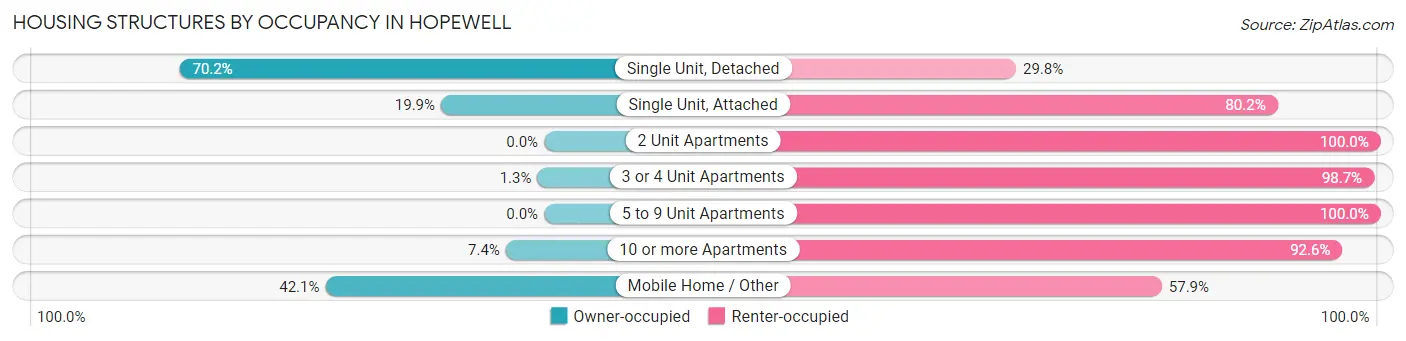
| Structure Type | Owner-occupied | Renter-occupied |
| Single Unit, Detached | 4,787 (70.2%) | 2,034 (29.8%) |
| Single Unit, Attached | 81 (19.9%) | 327 (80.1%) |
| 2 Unit Apartments | 0 (0.0%) | 328 (100.0%) |
| 3 or 4 Unit Apartments | 5 (1.3%) | 387 (98.7%) |
| 5 to 9 Unit Apartments | 0 (0.0%) | 388 (100.0%) |
| 10 or more Apartments | 62 (7.4%) | 778 (92.6%) |
| Mobile Home / Other | 72 (42.1%) | 99 (57.9%) |
| Total | 5,007 (53.6%) | 4,341 (46.4%) |
Housing Structures by Number of Rooms in Hopewell
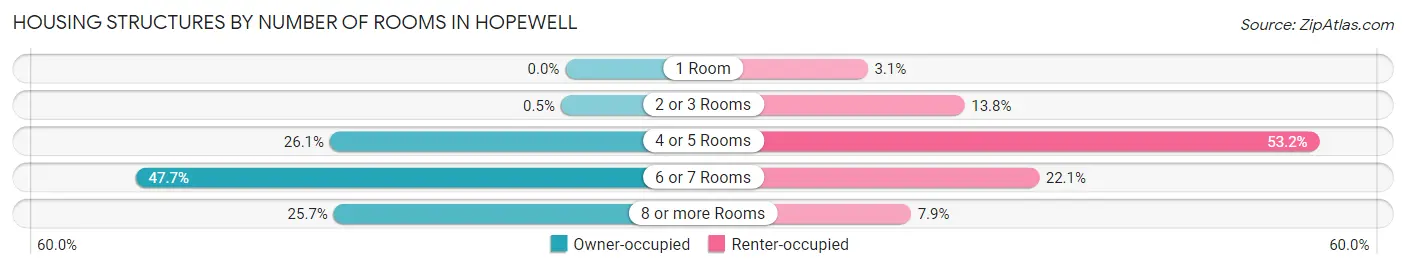
| Number of Rooms | Owner-occupied | Renter-occupied |
| 1 Room | 0 (0.0%) | 133 (3.1%) |
| 2 or 3 Rooms | 25 (0.5%) | 599 (13.8%) |
| 4 or 5 Rooms | 1,308 (26.1%) | 2,310 (53.2%) |
| 6 or 7 Rooms | 2,387 (47.7%) | 958 (22.1%) |
| 8 or more Rooms | 1,287 (25.7%) | 341 (7.9%) |
| Total | 5,007 (100.0%) | 4,341 (100.0%) |
Housing Structure by Heating Type in Hopewell
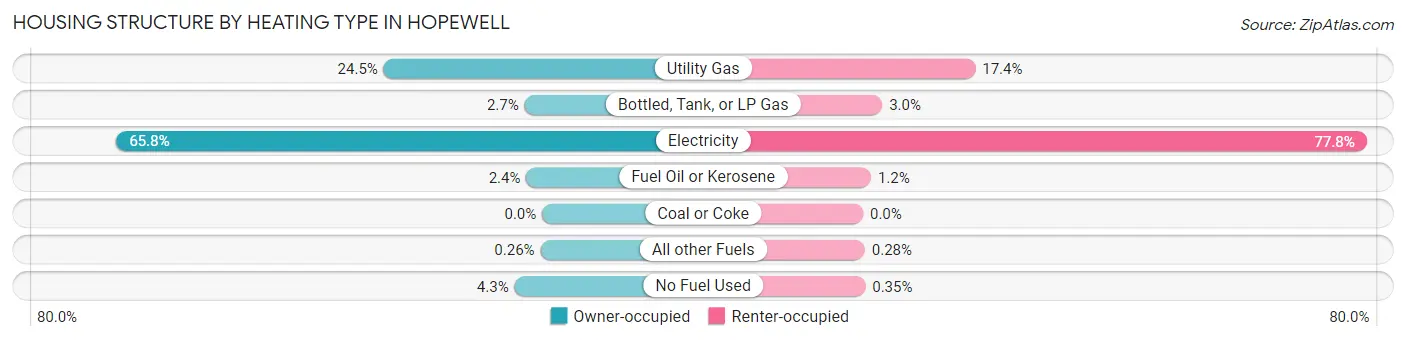
| Heating Type | Owner-occupied | Renter-occupied |
| Utility Gas | 1,226 (24.5%) | 753 (17.3%) |
| Bottled, Tank, or LP Gas | 136 (2.7%) | 129 (3.0%) |
| Electricity | 3,296 (65.8%) | 3,379 (77.8%) |
| Fuel Oil or Kerosene | 122 (2.4%) | 53 (1.2%) |
| Coal or Coke | 0 (0.0%) | 0 (0.0%) |
| All other Fuels | 13 (0.3%) | 12 (0.3%) |
| No Fuel Used | 214 (4.3%) | 15 (0.4%) |
| Total | 5,007 (100.0%) | 4,341 (100.0%) |
Household Vehicle Usage in Hopewell
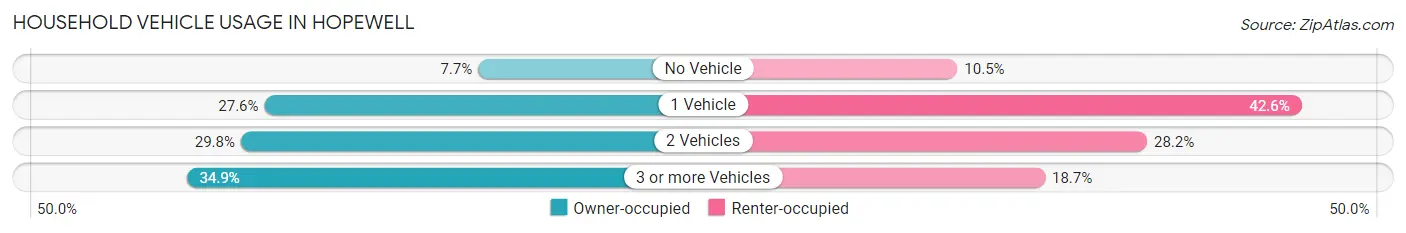
| Vehicles per Household | Owner-occupied | Renter-occupied |
| No Vehicle | 384 (7.7%) | 456 (10.5%) |
| 1 Vehicle | 1,383 (27.6%) | 1,850 (42.6%) |
| 2 Vehicles | 1,493 (29.8%) | 1,224 (28.2%) |
| 3 or more Vehicles | 1,747 (34.9%) | 811 (18.7%) |
| Total | 5,007 (100.0%) | 4,341 (100.0%) |
Real Estate & Mortgages in Hopewell
Real Estate and Mortgage Overview in Hopewell
| Characteristic | Without Mortgage | With Mortgage |
| Housing Units | 1,502 | 3,505 |
| Median Property Value | $132,100 | $159,300 |
| Median Household Income | $45,889 | $202 |
| Monthly Housing Costs | $435 | $37 |
| Real Estate Taxes | $1,498 | $275 |
Property Value by Mortgage Status in Hopewell
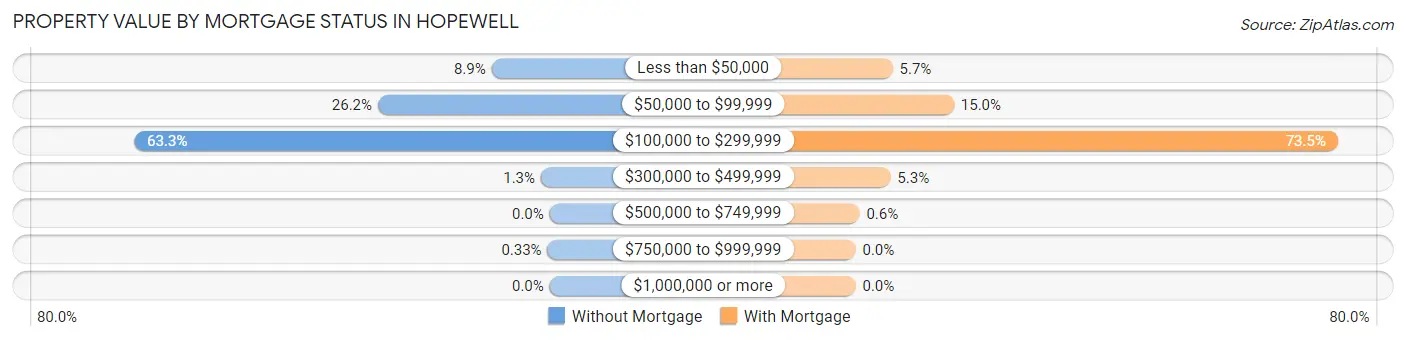
| Property Value | Without Mortgage | With Mortgage |
| Less than $50,000 | 133 (8.8%) | 198 (5.7%) |
| $50,000 to $99,999 | 393 (26.2%) | 525 (15.0%) |
| $100,000 to $299,999 | 951 (63.3%) | 2,575 (73.5%) |
| $300,000 to $499,999 | 20 (1.3%) | 186 (5.3%) |
| $500,000 to $749,999 | 0 (0.0%) | 21 (0.6%) |
| $750,000 to $999,999 | 5 (0.3%) | 0 (0.0%) |
| $1,000,000 or more | 0 (0.0%) | 0 (0.0%) |
| Total | 1,502 (100.0%) | 3,505 (100.0%) |
Household Income by Mortgage Status in Hopewell
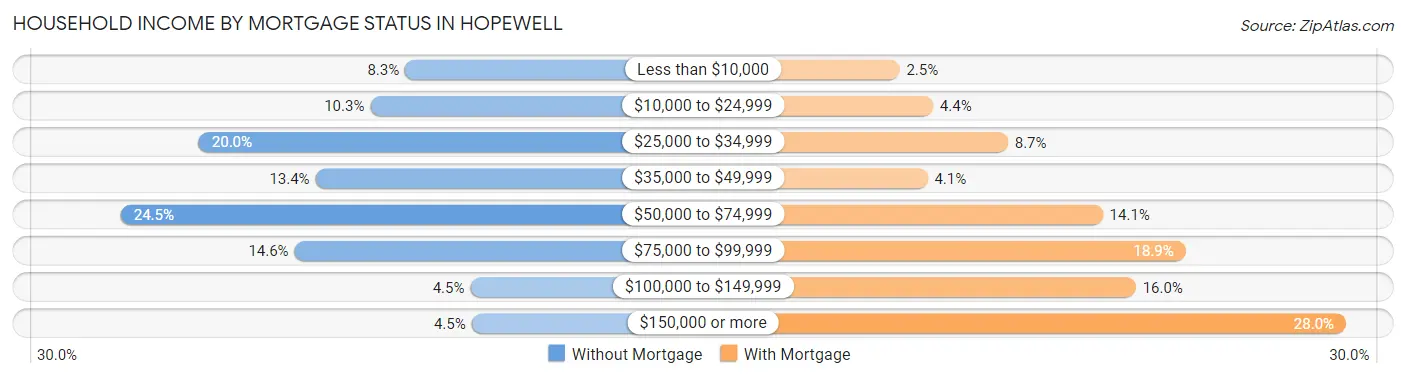
| Household Income | Without Mortgage | With Mortgage |
| Less than $10,000 | 124 (8.3%) | 88 (2.5%) |
| $10,000 to $24,999 | 154 (10.2%) | 155 (4.4%) |
| $25,000 to $34,999 | 301 (20.0%) | 305 (8.7%) |
| $35,000 to $49,999 | 201 (13.4%) | 144 (4.1%) |
| $50,000 to $74,999 | 368 (24.5%) | 495 (14.1%) |
| $75,000 to $99,999 | 219 (14.6%) | 661 (18.9%) |
| $100,000 to $149,999 | 68 (4.5%) | 561 (16.0%) |
| $150,000 or more | 67 (4.5%) | 982 (28.0%) |
| Total | 1,502 (100.0%) | 3,505 (100.0%) |
Property Value to Household Income Ratio in Hopewell
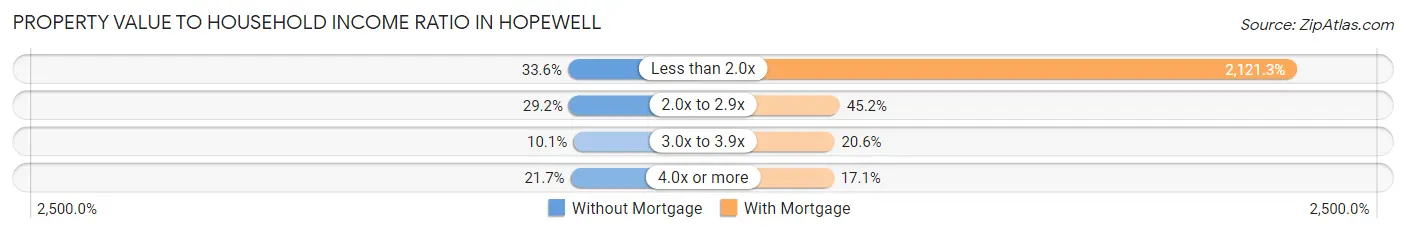
| Value-to-Income Ratio | Without Mortgage | With Mortgage |
| Less than 2.0x | 505 (33.6%) | 74,353 (2,121.3%) |
| 2.0x to 2.9x | 439 (29.2%) | 1,583 (45.2%) |
| 3.0x to 3.9x | 151 (10.1%) | 721 (20.6%) |
| 4.0x or more | 326 (21.7%) | 599 (17.1%) |
| Total | 1,502 (100.0%) | 3,505 (100.0%) |
Real Estate Taxes by Mortgage Status in Hopewell
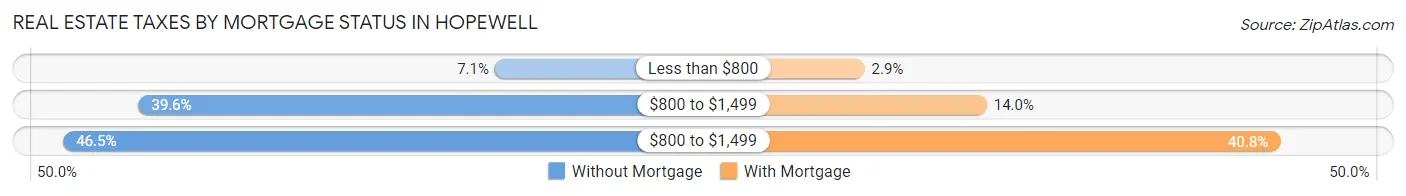
| Property Taxes | Without Mortgage | With Mortgage |
| Less than $800 | 106 (7.1%) | 101 (2.9%) |
| $800 to $1,499 | 595 (39.6%) | 492 (14.0%) |
| $800 to $1,499 | 698 (46.5%) | 1,431 (40.8%) |
| Total | 1,502 (100.0%) | 3,505 (100.0%) |
Health & Disability in Hopewell
Health Insurance Coverage by Age in Hopewell
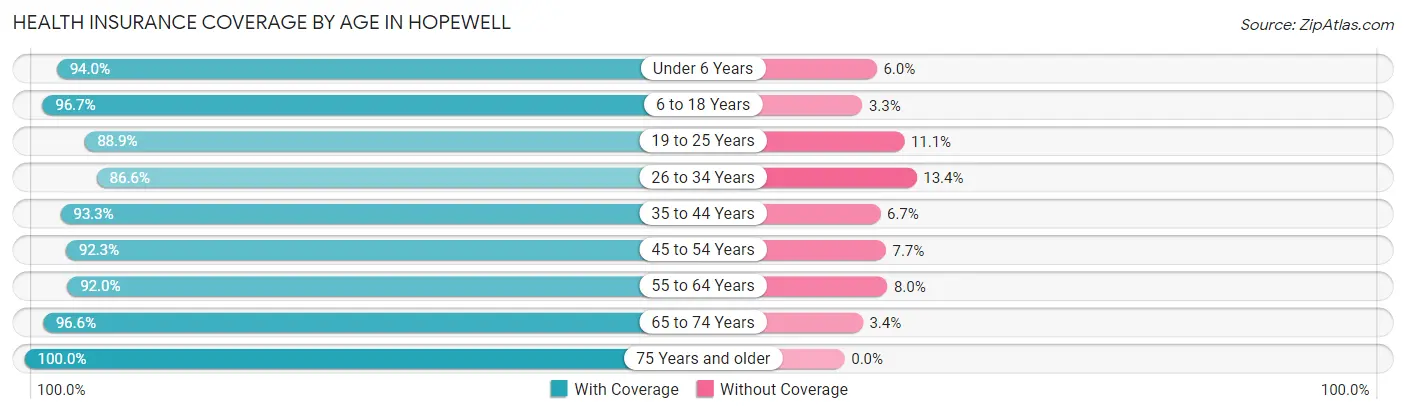
| Age Bracket | With Coverage | Without Coverage |
| Under 6 Years | 1,709 (94.0%) | 109 (6.0%) |
| 6 to 18 Years | 4,185 (96.7%) | 143 (3.3%) |
| 19 to 25 Years | 1,847 (88.9%) | 231 (11.1%) |
| 26 to 34 Years | 2,637 (86.6%) | 409 (13.4%) |
| 35 to 44 Years | 2,340 (93.3%) | 167 (6.7%) |
| 45 to 54 Years | 2,593 (92.3%) | 216 (7.7%) |
| 55 to 64 Years | 2,635 (92.0%) | 228 (8.0%) |
| 65 to 74 Years | 1,850 (96.6%) | 65 (3.4%) |
| 75 Years and older | 1,284 (100.0%) | 0 (0.0%) |
| Total | 21,080 (93.1%) | 1,568 (6.9%) |
Health Insurance Coverage by Citizenship Status in Hopewell
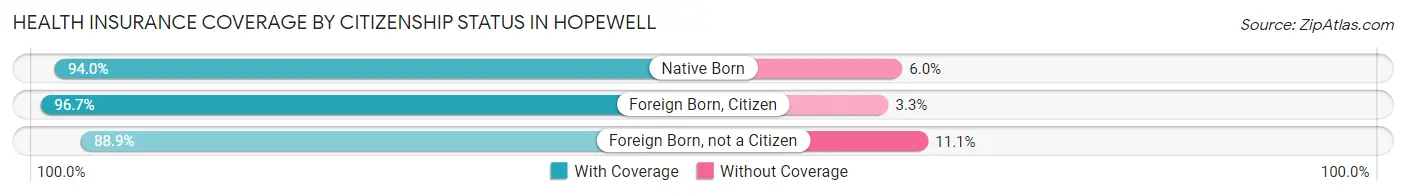
| Citizenship Status | With Coverage | Without Coverage |
| Native Born | 1,709 (94.0%) | 109 (6.0%) |
| Foreign Born, Citizen | 4,185 (96.7%) | 143 (3.3%) |
| Foreign Born, not a Citizen | 1,847 (88.9%) | 231 (11.1%) |
Health Insurance Coverage by Household Income in Hopewell
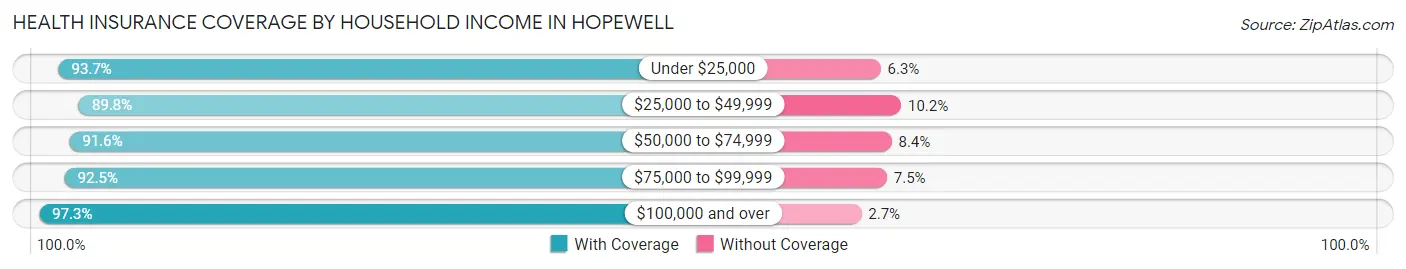
| Household Income | With Coverage | Without Coverage |
| Under $25,000 | 4,252 (93.7%) | 288 (6.3%) |
| $25,000 to $49,999 | 4,374 (89.8%) | 495 (10.2%) |
| $50,000 to $74,999 | 4,516 (91.6%) | 413 (8.4%) |
| $75,000 to $99,999 | 2,776 (92.5%) | 225 (7.5%) |
| $100,000 and over | 5,155 (97.3%) | 144 (2.7%) |
Public vs Private Health Insurance Coverage by Age in Hopewell
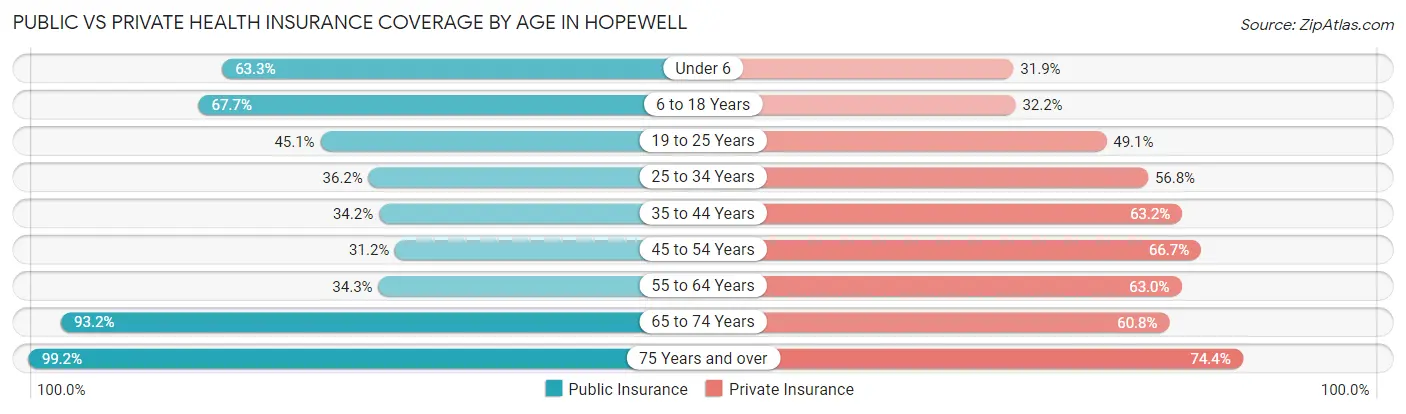
| Age Bracket | Public Insurance | Private Insurance |
| Under 6 | 1,151 (63.3%) | 579 (31.9%) |
| 6 to 18 Years | 2,930 (67.7%) | 1,395 (32.2%) |
| 19 to 25 Years | 937 (45.1%) | 1,020 (49.1%) |
| 25 to 34 Years | 1,101 (36.1%) | 1,731 (56.8%) |
| 35 to 44 Years | 858 (34.2%) | 1,584 (63.2%) |
| 45 to 54 Years | 877 (31.2%) | 1,873 (66.7%) |
| 55 to 64 Years | 983 (34.3%) | 1,804 (63.0%) |
| 65 to 74 Years | 1,785 (93.2%) | 1,164 (60.8%) |
| 75 Years and over | 1,274 (99.2%) | 955 (74.4%) |
| Total | 11,896 (52.5%) | 12,105 (53.4%) |
Disability Status by Sex by Age in Hopewell
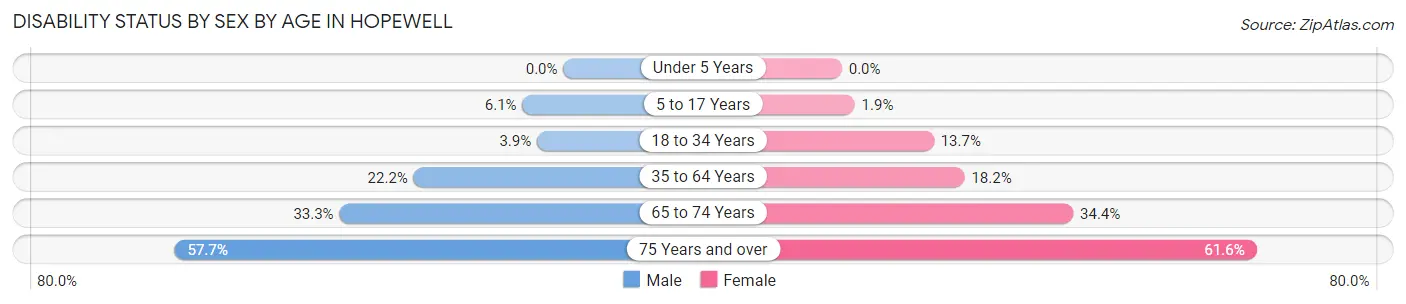
| Age Bracket | Male | Female |
| Under 5 Years | 0 (0.0%) | 0 (0.0%) |
| 5 to 17 Years | 137 (6.1%) | 38 (1.9%) |
| 18 to 34 Years | 103 (3.9%) | 374 (13.7%) |
| 35 to 64 Years | 774 (22.2%) | 856 (18.2%) |
| 65 to 74 Years | 265 (33.3%) | 384 (34.4%) |
| 75 Years and over | 280 (57.7%) | 492 (61.6%) |
Disability Class by Sex by Age in Hopewell
Disability Class: Hearing Difficulty
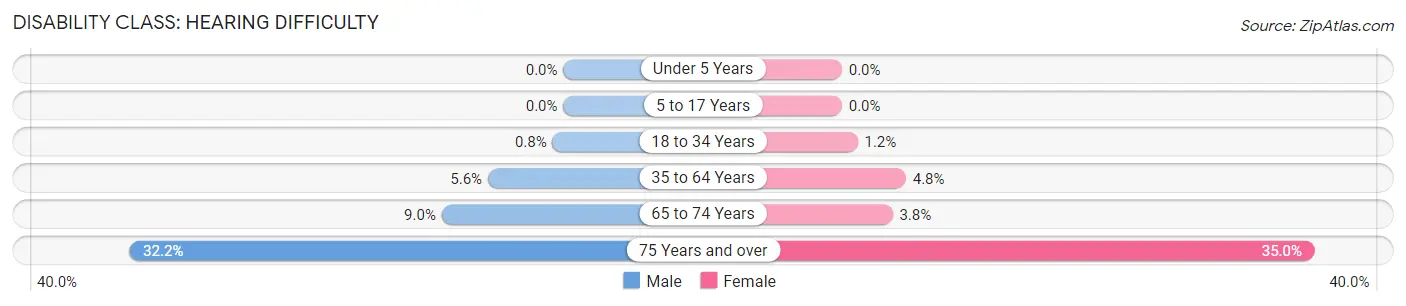
| Age Bracket | Male | Female |
| Under 5 Years | 0 (0.0%) | 0 (0.0%) |
| 5 to 17 Years | 0 (0.0%) | 0 (0.0%) |
| 18 to 34 Years | 21 (0.8%) | 32 (1.2%) |
| 35 to 64 Years | 195 (5.6%) | 223 (4.8%) |
| 65 to 74 Years | 72 (9.0%) | 42 (3.8%) |
| 75 Years and over | 156 (32.2%) | 280 (35.0%) |
Disability Class: Vision Difficulty
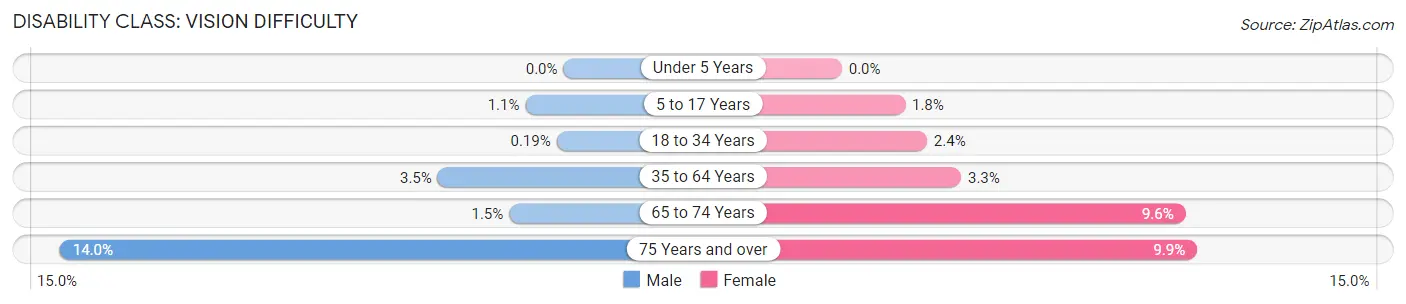
| Age Bracket | Male | Female |
| Under 5 Years | 0 (0.0%) | 0 (0.0%) |
| 5 to 17 Years | 24 (1.1%) | 35 (1.8%) |
| 18 to 34 Years | 5 (0.2%) | 65 (2.4%) |
| 35 to 64 Years | 122 (3.5%) | 156 (3.3%) |
| 65 to 74 Years | 12 (1.5%) | 107 (9.6%) |
| 75 Years and over | 68 (14.0%) | 79 (9.9%) |
Disability Class: Cognitive Difficulty
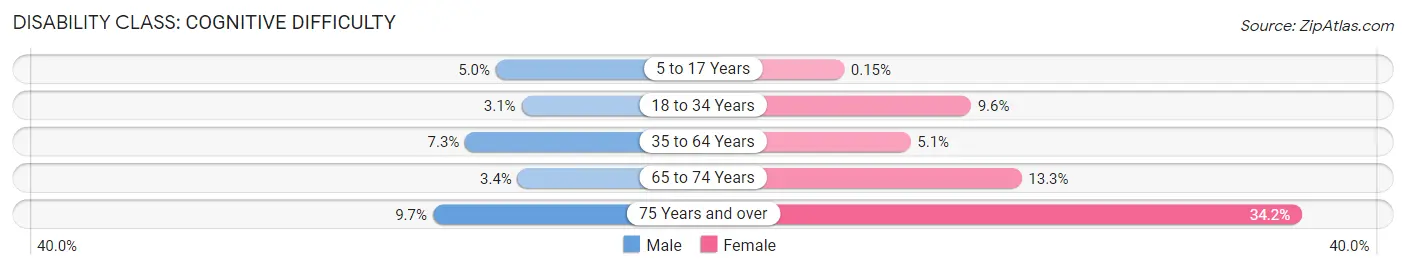
| Age Bracket | Male | Female |
| 5 to 17 Years | 113 (5.0%) | 3 (0.2%) |
| 18 to 34 Years | 82 (3.1%) | 262 (9.6%) |
| 35 to 64 Years | 254 (7.3%) | 239 (5.1%) |
| 65 to 74 Years | 27 (3.4%) | 149 (13.3%) |
| 75 Years and over | 47 (9.7%) | 273 (34.2%) |
Disability Class: Ambulatory Difficulty
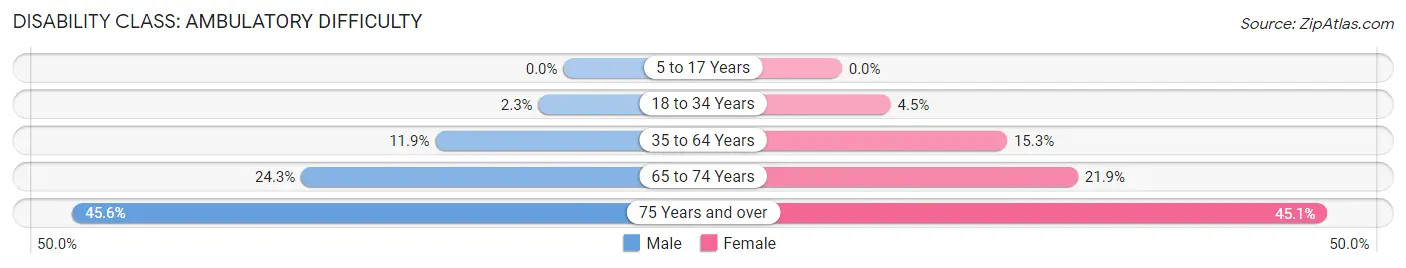
| Age Bracket | Male | Female |
| 5 to 17 Years | 0 (0.0%) | 0 (0.0%) |
| 18 to 34 Years | 61 (2.3%) | 124 (4.5%) |
| 35 to 64 Years | 414 (11.9%) | 720 (15.3%) |
| 65 to 74 Years | 194 (24.3%) | 245 (21.9%) |
| 75 Years and over | 221 (45.6%) | 360 (45.1%) |
Disability Class: Self-Care Difficulty
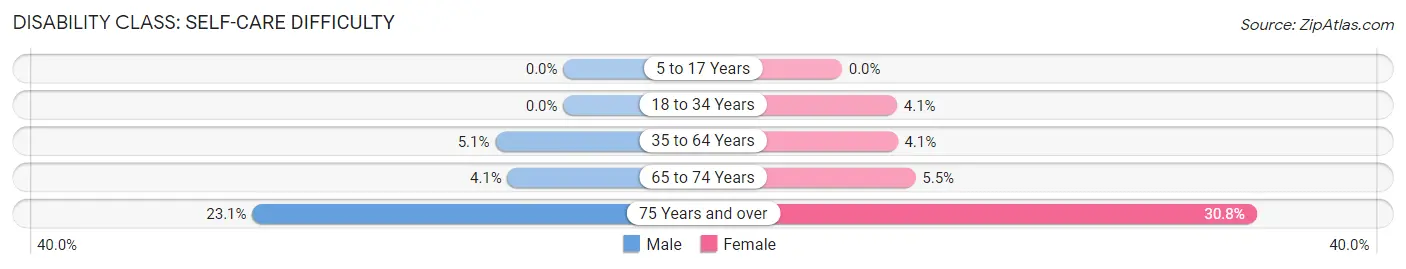
| Age Bracket | Male | Female |
| 5 to 17 Years | 0 (0.0%) | 0 (0.0%) |
| 18 to 34 Years | 0 (0.0%) | 112 (4.1%) |
| 35 to 64 Years | 176 (5.1%) | 194 (4.1%) |
| 65 to 74 Years | 33 (4.1%) | 61 (5.5%) |
| 75 Years and over | 112 (23.1%) | 246 (30.8%) |
Technology Access in Hopewell
Computing Device Access in Hopewell
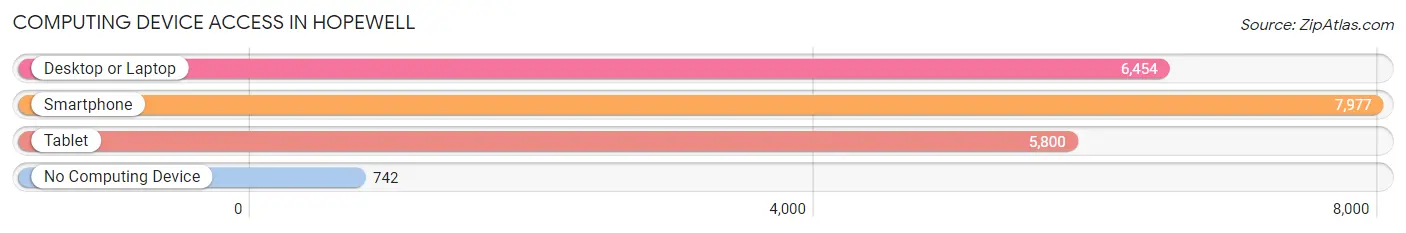
| Device Type | # Households | % Households |
| Desktop or Laptop | 6,454 | 69.0% |
| Smartphone | 7,977 | 85.3% |
| Tablet | 5,800 | 62.1% |
| No Computing Device | 742 | 7.9% |
| Total | 9,348 | 100.0% |
Internet Access in Hopewell
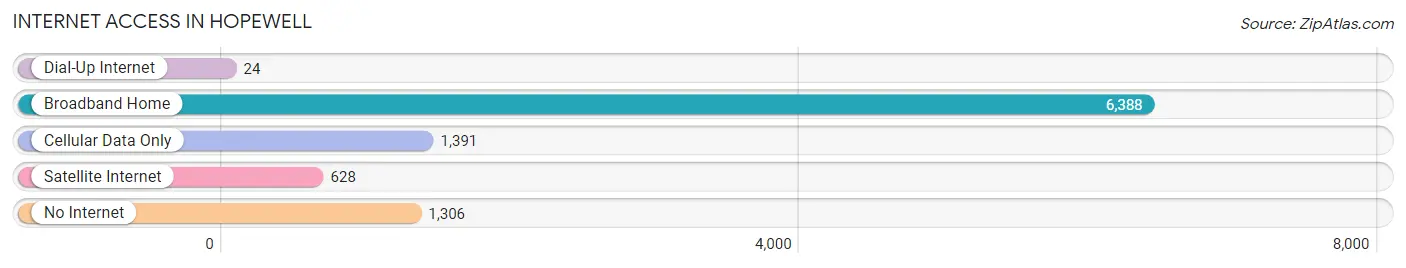
| Internet Type | # Households | % Households |
| Dial-Up Internet | 24 | 0.3% |
| Broadband Home | 6,388 | 68.3% |
| Cellular Data Only | 1,391 | 14.9% |
| Satellite Internet | 628 | 6.7% |
| No Internet | 1,306 | 14.0% |
| Total | 9,348 | 100.0% |
Hopewell Summary
HopeWell, Virginia is a small town located in the southeastern part of the state, about 25 miles south of Richmond. It is situated in the Appomattox River Valley, and is part of the greater Richmond metropolitan area. The town has a population of approximately 8,000 people, and is known for its historic buildings, quaint downtown area, and friendly atmosphere.
History
The area that is now Hopewell was first settled in the early 1700s by English colonists. The town was originally known as City Point, and was a major port for the export of tobacco and other goods. In 1814, the town was renamed Hopewell, after the nearby Hopewell Plantation. The town was officially incorporated in 1874.
During the Civil War, Hopewell was a major center of Confederate activity. The town was the site of several battles, including the Battle of City Point in 1864. After the war, the town experienced a period of economic growth, as the railroad and other industries began to develop.
Geography
Hopewell is located in the Appomattox River Valley, about 25 miles south of Richmond. The town is situated on the banks of the Appomattox River, and is surrounded by rolling hills and farmland. The climate is mild, with hot summers and cool winters.
Economy
Hopewell’s economy is largely based on manufacturing and services. The town is home to several large companies, including the DuPont Company, which produces chemicals and plastics. Other major employers include the Hopewell Foundry, which produces cast iron products, and the Hopewell Shipyard, which builds ships and boats.
The town is also home to several small businesses, including restaurants, shops, and other services. Tourism is also an important part of the local economy, as the town is home to several historic sites, including the Appomattox Court House National Historical Park.
Demographics
As of the 2010 census, Hopewell had a population of 8,000 people. The racial makeup of the town was 79.3% White, 15.2% African American, 0.7% Native American, 1.2% Asian, and 3.6% from other races. The median household income was $37,000, and the median age was 37.
Conclusion
Hopewell, Virginia is a small town with a rich history and a friendly atmosphere. The town is home to several large companies, as well as small businesses and tourist attractions. The population is diverse, with a mix of races and ages. Hopewell is a great place to live and work, and is a great example of a small town with a big heart.
Common Questions
What is Per Capita Income in Hopewell?
Per Capita income in Hopewell is $25,664.
What is the Median Family Income in Hopewell?
Median Family Income in Hopewell is $58,850.
What is the Median Household income in Hopewell?
Median Household Income in Hopewell is $50,661.
What is Income or Wage Gap in Hopewell?
Income or Wage Gap in Hopewell is 14.9%.
Women in Hopewell earn 85.1 cents for every dollar earned by a man.
What is Family Income Deficit in Hopewell?
Family Income Deficit in Hopewell is $10,942.
Families that are below poverty line in Hopewell earn $10,942 less on average than the poverty threshold level.
What is Inequality or Gini Index in Hopewell?
Inequality or Gini Index in Hopewell is 0.44.
What is the Total Population of Hopewell?
Total Population of Hopewell is 23,046.
What is the Total Male Population of Hopewell?
Total Male Population of Hopewell is 10,827.
What is the Total Female Population of Hopewell?
Total Female Population of Hopewell is 12,219.
What is the Ratio of Males per 100 Females in Hopewell?
There are 88.61 Males per 100 Females in Hopewell.
What is the Ratio of Females per 100 Males in Hopewell?
There are 112.86 Females per 100 Males in Hopewell.
What is the Median Population Age in Hopewell?
Median Population Age in Hopewell is 35.7 Years.
What is the Average Family Size in Hopewell
Average Family Size in Hopewell is 3.0 People.
What is the Average Household Size in Hopewell
Average Household Size in Hopewell is 2.4 People.
How Large is the Labor Force in Hopewell?
There are 10,655 People in the Labor Forcein in Hopewell.
What is the Percentage of People in the Labor Force in Hopewell?
60.2% of People are in the Labor Force in Hopewell.
What is the Unemployment Rate in Hopewell?
Unemployment Rate in Hopewell is 8.8%.