Cities with the Highest Percentage of Immigrants from Afghanistan in Virginia
RELATED REPORTS & OPTIONS
Afghanistan
Virginia
Compare Cities
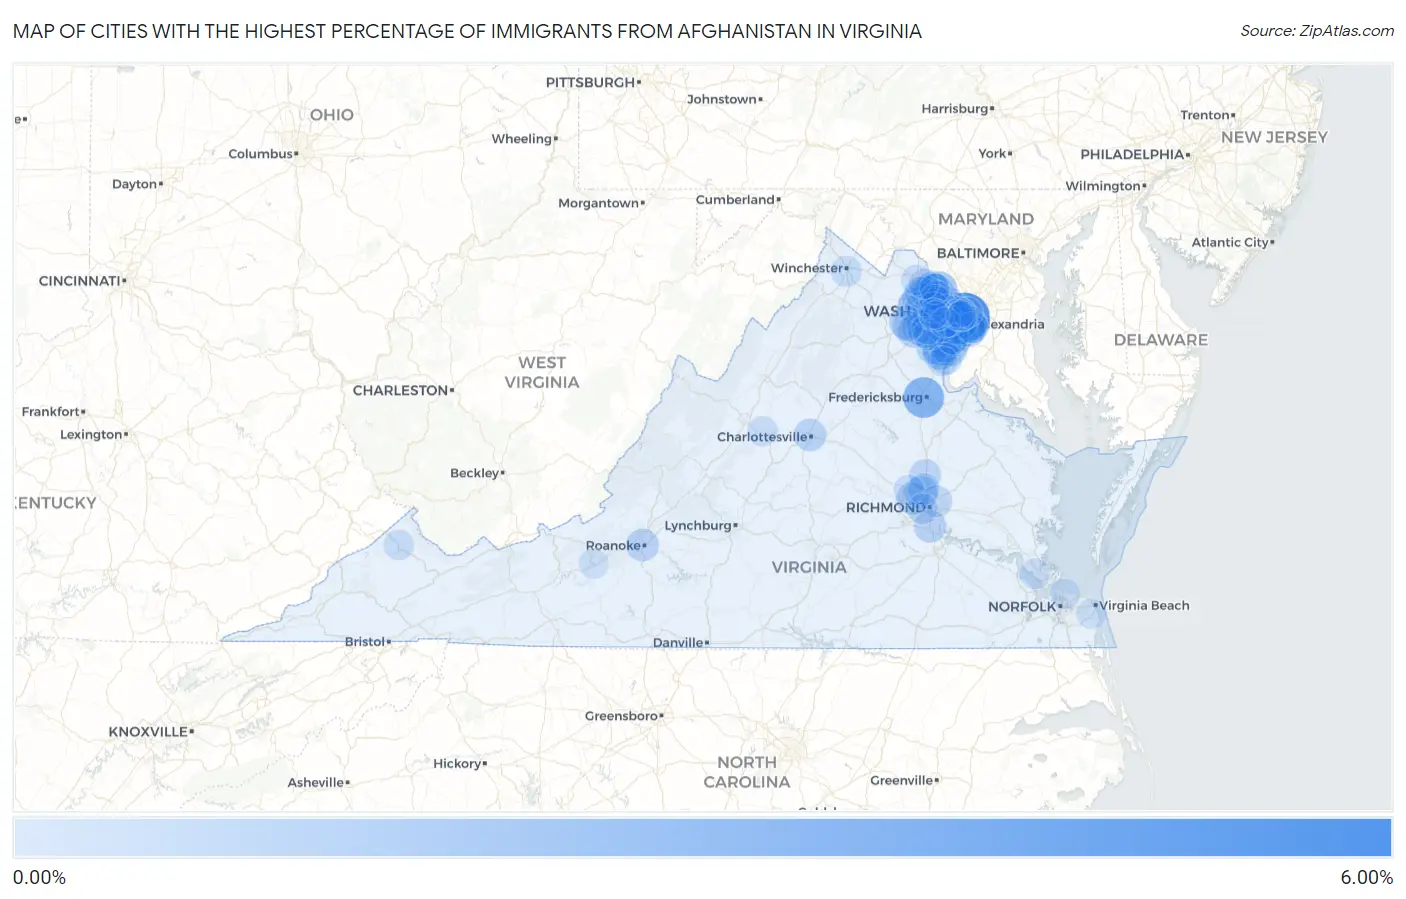
Map of Cities with the Highest Percentage of Immigrants from Afghanistan in Virginia
0.00%
6.00%
Cities with the Highest Percentage of Immigrants from Afghanistan in Virginia
| City | Afghanistan | vs State | vs National | |
| 1. | Bailey S Crossroads | 5.13% | 0.23%(+4.91)#1 | 0.041%(+5.09)#4 |
| 2. | Fredericksburg | 2.75% | 0.23%(+2.53)#2 | 0.041%(+2.71)#16 |
| 3. | Lowes Island | 1.80% | 0.23%(+1.58)#3 | 0.041%(+1.76)#27 |
| 4. | Stone Ridge | 1.77% | 0.23%(+1.54)#4 | 0.041%(+1.73)#28 |
| 5. | Woodburn | 1.62% | 0.23%(+1.39)#5 | 0.041%(+1.58)#34 |
| 6. | Burke Centre | 1.57% | 0.23%(+1.35)#6 | 0.041%(+1.53)#36 |
| 7. | Dale City | 1.53% | 0.23%(+1.30)#7 | 0.041%(+1.48)#38 |
| 8. | Dulles Town Center | 1.43% | 0.23%(+1.20)#8 | 0.041%(+1.39)#42 |
| 9. | Bull Run | 1.37% | 0.23%(+1.15)#9 | 0.041%(+1.33)#44 |
| 10. | Annandale | 1.31% | 0.23%(+1.09)#10 | 0.041%(+1.27)#47 |
| 11. | Sugarland Run | 1.30% | 0.23%(+1.07)#11 | 0.041%(+1.25)#50 |
| 12. | Newington | 1.28% | 0.23%(+1.06)#12 | 0.041%(+1.24)#51 |
| 13. | Leesylvania | 1.28% | 0.23%(+1.05)#13 | 0.041%(+1.23)#52 |
| 14. | Woodbridge | 1.22% | 0.23%(+0.997)#14 | 0.041%(+1.18)#56 |
| 15. | Merrifield | 1.15% | 0.23%(+0.924)#15 | 0.041%(+1.11)#62 |
| 16. | Montclair | 1.09% | 0.23%(+0.866)#16 | 0.041%(+1.05)#68 |
| 17. | Wolf Trap | 1.07% | 0.23%(+0.844)#17 | 0.041%(+1.03)#72 |
| 18. | Mcnair | 1.05% | 0.23%(+0.829)#18 | 0.041%(+1.01)#73 |
| 19. | Alexandria | 1.05% | 0.23%(+0.826)#19 | 0.041%(+1.01)#74 |
| 20. | George Mason | 1.02% | 0.23%(+0.793)#20 | 0.041%(+0.977)#78 |
| 21. | Haymarket | 1.02% | 0.23%(+0.793)#21 | 0.041%(+0.977)#79 |
| 22. | Burke | 0.95% | 0.23%(+0.727)#22 | 0.041%(+0.911)#89 |
| 23. | Kingstowne | 0.95% | 0.23%(+0.724)#23 | 0.041%(+0.908)#90 |
| 24. | Huntington | 0.94% | 0.23%(+0.716)#24 | 0.041%(+0.900)#91 |
| 25. | Centreville | 0.93% | 0.23%(+0.708)#25 | 0.041%(+0.892)#93 |
| 26. | Groveton | 0.89% | 0.23%(+0.664)#26 | 0.041%(+0.848)#96 |
| 27. | West Springfield | 0.80% | 0.23%(+0.579)#27 | 0.041%(+0.763)#107 |
| 28. | Brambleton | 0.79% | 0.23%(+0.564)#28 | 0.041%(+0.748)#110 |
| 29. | Linton Hall | 0.78% | 0.23%(+0.559)#29 | 0.041%(+0.743)#111 |
| 30. | Laurel | 0.74% | 0.23%(+0.511)#30 | 0.041%(+0.695)#121 |
| 31. | Woodlawn Cdp Fairfax County | 0.74% | 0.23%(+0.511)#31 | 0.041%(+0.695)#122 |
| 32. | Lake Ridge | 0.72% | 0.23%(+0.499)#32 | 0.041%(+0.683)#124 |
| 33. | Roanoke | 0.70% | 0.23%(+0.477)#33 | 0.041%(+0.661)#128 |
| 34. | Charlottesville | 0.69% | 0.23%(+0.462)#34 | 0.041%(+0.646)#129 |
| 35. | Springfield | 0.67% | 0.23%(+0.448)#35 | 0.041%(+0.633)#131 |
| 36. | Bellwood | 0.67% | 0.23%(+0.443)#36 | 0.041%(+0.627)#134 |
| 37. | Tuckahoe | 0.65% | 0.23%(+0.426)#37 | 0.041%(+0.610)#138 |
| 38. | Rose Hill Cdp Fairfax County | 0.65% | 0.23%(+0.426)#38 | 0.041%(+0.610)#140 |
| 39. | Independent Hill | 0.64% | 0.23%(+0.414)#39 | 0.041%(+0.598)#141 |
| 40. | Union Mill | 0.63% | 0.23%(+0.402)#40 | 0.041%(+0.586)#143 |
| 41. | Sudley | 0.62% | 0.23%(+0.392)#41 | 0.041%(+0.576)#145 |
| 42. | Lincolnia | 0.61% | 0.23%(+0.385)#42 | 0.041%(+0.570)#147 |
| 43. | Potomac Mills | 0.60% | 0.23%(+0.374)#43 | 0.041%(+0.558)#150 |
| 44. | Kings Park | 0.57% | 0.23%(+0.349)#44 | 0.041%(+0.533)#157 |
| 45. | Countryside | 0.57% | 0.23%(+0.345)#45 | 0.041%(+0.529)#159 |
| 46. | South Run | 0.53% | 0.23%(+0.308)#46 | 0.041%(+0.492)#167 |
| 47. | Floris | 0.53% | 0.23%(+0.301)#47 | 0.041%(+0.485)#171 |
| 48. | South Riding | 0.52% | 0.23%(+0.296)#48 | 0.041%(+0.480)#175 |
| 49. | Chantilly | 0.52% | 0.23%(+0.294)#49 | 0.041%(+0.478)#178 |
| 50. | Lorton | 0.51% | 0.23%(+0.287)#50 | 0.041%(+0.471)#180 |
| 51. | Ashland | 0.47% | 0.23%(+0.247)#51 | 0.041%(+0.431)#189 |
| 52. | Fairfax | 0.46% | 0.23%(+0.233)#52 | 0.041%(+0.417)#191 |
| 53. | East Highland Park | 0.44% | 0.23%(+0.217)#53 | 0.041%(+0.401)#196 |
| 54. | Dunn Loring | 0.44% | 0.23%(+0.211)#54 | 0.041%(+0.395)#197 |
| 55. | Vienna | 0.43% | 0.23%(+0.208)#55 | 0.041%(+0.392)#199 |
| 56. | Reston | 0.39% | 0.23%(+0.169)#56 | 0.041%(+0.353)#211 |
| 57. | Cherry Hill | 0.37% | 0.23%(+0.148)#57 | 0.041%(+0.332)#220 |
| 58. | Glen Allen | 0.37% | 0.23%(+0.144)#58 | 0.041%(+0.328)#222 |
| 59. | Franconia | 0.36% | 0.23%(+0.132)#59 | 0.041%(+0.316)#228 |
| 60. | Ashburn | 0.35% | 0.23%(+0.120)#60 | 0.041%(+0.304)#236 |
| 61. | Idylwood | 0.31% | 0.23%(+0.090)#61 | 0.041%(+0.274)#248 |
| 62. | Tysons | 0.30% | 0.23%(+0.072)#62 | 0.041%(+0.256)#259 |
| 63. | Laurel Hill | 0.29% | 0.23%(+0.061)#63 | 0.041%(+0.245)#263 |
| 64. | Manassas Park | 0.29% | 0.23%(+0.061)#64 | 0.041%(+0.245)#264 |
| 65. | Belle Haven | 0.28% | 0.23%(+0.058)#65 | 0.041%(+0.242)#267 |
| 66. | Sterling | 0.28% | 0.23%(+0.055)#66 | 0.041%(+0.239)#270 |
| 67. | Fairfax Station | 0.27% | 0.23%(+0.044)#67 | 0.041%(+0.228)#274 |
| 68. | Broadlands | 0.27% | 0.23%(+0.042)#68 | 0.041%(+0.226)#277 |
| 69. | Winchester | 0.25% | 0.23%(+0.027)#69 | 0.041%(+0.211)#286 |
| 70. | Manassas | 0.23% | 0.23%(+0.005)#70 | 0.041%(+0.189)#305 |
| 71. | Oakton | 0.20% | 0.23%(-0.025)#71 | 0.041%(+0.159)#325 |
| 72. | Long Branch | 0.20% | 0.23%(-0.029)#72 | 0.041%(+0.155)#329 |
| 73. | Buckhall | 0.19% | 0.23%(-0.031)#73 | 0.041%(+0.153)#331 |
| 74. | Gainesville | 0.18% | 0.23%(-0.048)#74 | 0.041%(+0.136)#342 |
| 75. | Short Pump | 0.14% | 0.23%(-0.084)#75 | 0.041%(+0.100)#381 |
| 76. | Dranesville | 0.14% | 0.23%(-0.085)#76 | 0.041%(+0.099)#386 |
| 77. | Navy | 0.14% | 0.23%(-0.088)#77 | 0.041%(+0.096)#388 |
| 78. | West Falls Church | 0.13% | 0.23%(-0.090)#78 | 0.041%(+0.094)#394 |
| 79. | Richmond | 0.13% | 0.23%(-0.091)#79 | 0.041%(+0.094)#395 |
| 80. | Grundy | 0.13% | 0.23%(-0.097)#80 | 0.041%(+0.088)#404 |
| 81. | Leesburg | 0.13% | 0.23%(-0.099)#81 | 0.041%(+0.085)#408 |
| 82. | Herndon | 0.12% | 0.23%(-0.107)#82 | 0.041%(+0.077)#420 |
| 83. | Newport News | 0.11% | 0.23%(-0.111)#83 | 0.041%(+0.073)#426 |
| 84. | Seven Corners | 0.11% | 0.23%(-0.116)#84 | 0.041%(+0.068)#436 |
| 85. | Waynesboro | 0.098% | 0.23%(-0.127)#85 | 0.041%(+0.057)#449 |
| 86. | Midlothian | 0.094% | 0.23%(-0.131)#86 | 0.041%(+0.053)#454 |
| 87. | Fair Oaks | 0.085% | 0.23%(-0.140)#87 | 0.041%(+0.044)#470 |
| 88. | Franklin Farm | 0.085% | 0.23%(-0.141)#88 | 0.041%(+0.043)#474 |
| 89. | Arlington | 0.083% | 0.23%(-0.143)#89 | 0.041%(+0.041)#479 |
| 90. | Falls Church | 0.075% | 0.23%(-0.150)#90 | 0.041%(+0.034)#499 |
| 91. | Cascades | 0.072% | 0.23%(-0.153)#91 | 0.041%(+0.031)#509 |
| 92. | Lansdowne | 0.062% | 0.23%(-0.163)#92 | 0.041%(+0.021)#536 |
| 93. | Fair Lakes | 0.056% | 0.23%(-0.169)#93 | 0.041%(+0.015)#562 |
| 94. | Triangle | 0.055% | 0.23%(-0.170)#94 | 0.041%(+0.014)#566 |
| 95. | Kings Park West | 0.045% | 0.23%(-0.180)#95 | 0.041%(+0.004)#600 |
| 96. | Lake Barcroft | 0.038% | 0.23%(-0.187)#96 | 0.041%(-0.003)#629 |
| 97. | Norfolk | 0.035% | 0.23%(-0.190)#97 | 0.041%(-0.006)#644 |
| 98. | Greenbriar | 0.025% | 0.23%(-0.200)#98 | 0.041%(-0.016)#691 |
| 99. | Christiansburg | 0.022% | 0.23%(-0.203)#99 | 0.041%(-0.019)#716 |
| 100. | Virginia Beach | 0.019% | 0.23%(-0.206)#100 | 0.041%(-0.022)#732 |
Common Questions
What are the Top 10 Cities with the Highest Percentage of Immigrants from Afghanistan in Virginia?
Top 10 Cities with the Highest Percentage of Immigrants from Afghanistan in Virginia are:
#1
5.13%
#2
2.75%
#3
1.80%
#4
1.77%
#5
1.62%
#6
1.57%
#7
1.53%
#8
1.43%
#9
1.37%
#10
1.31%
What city has the Highest Percentage of Immigrants from Afghanistan in Virginia?
Bailey s Crossroads has the Highest Percentage of Immigrants from Afghanistan in Virginia with 5.13%.
What is the Percentage of Immigrants from Afghanistan in the State of Virginia?
Percentage of Immigrants from Afghanistan in Virginia is 0.23%.
What is the Percentage of Immigrants from Afghanistan in the United States?
Percentage of Immigrants from Afghanistan in the United States is 0.041%.