Shenandoah, VA Map & Demographics
Shenandoah Map
Shenandoah Overview
$23,323
PER CAPITA INCOME
$67,857
AVG FAMILY INCOME
$64,410
AVG HOUSEHOLD INCOME
35.0%
WAGE / INCOME GAP [ % ]
65.0¢/ $1
WAGE / INCOME GAP [ $ ]
0.33
INEQUALITY / GINI INDEX
3,020
TOTAL POPULATION
1,538
MALE POPULATION
1,482
FEMALE POPULATION
103.78
MALES / 100 FEMALES
96.36
FEMALES / 100 MALES
33.7
MEDIAN AGE
3.6
AVG FAMILY SIZE
3.1
AVG HOUSEHOLD SIZE
1,395
LABOR FORCE [ PEOPLE ]
61.1%
PERCENT IN LABOR FORCE
3.5%
UNEMPLOYMENT RATE
Shenandoah Zip Codes
Shenandoah Area Codes
Income in Shenandoah
Income Overview in Shenandoah
Per Capita Income in Shenandoah is $23,323, while median incomes of families and households are $67,857 and $64,410 respectively.
| Characteristic | Number | Measure |
| Per Capita Income | 3,020 | $23,323 |
| Median Family Income | 742 | $67,857 |
| Mean Family Income | 742 | $74,090 |
| Median Household Income | 976 | $64,410 |
| Mean Household Income | 976 | $68,091 |
| Income Deficit | 742 | $0 |
| Wage / Income Gap (%) | 3,020 | 34.95% |
| Wage / Income Gap ($) | 3,020 | 65.05¢ per $1 |
| Gini / Inequality Index | 3,020 | 0.33 |
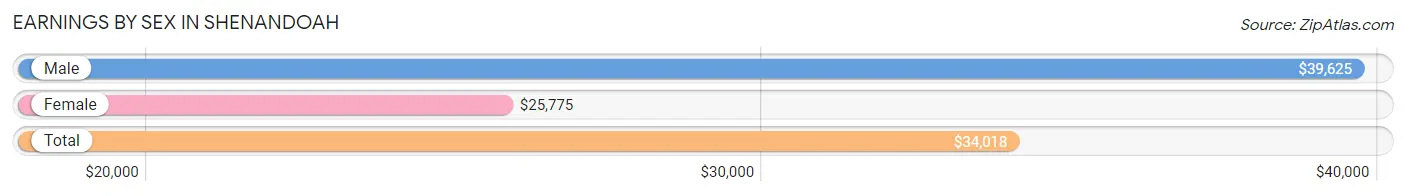
Earnings by Sex in Shenandoah
Average Earnings in Shenandoah are $34,018, $39,625 for men and $25,775 for women, a difference of 34.9%.
| Sex | Number | Average Earnings |
| Male | 791 (55.8%) | $39,625 |
| Female | 626 (44.2%) | $25,775 |
| Total | 1,417 (100.0%) | $34,018 |
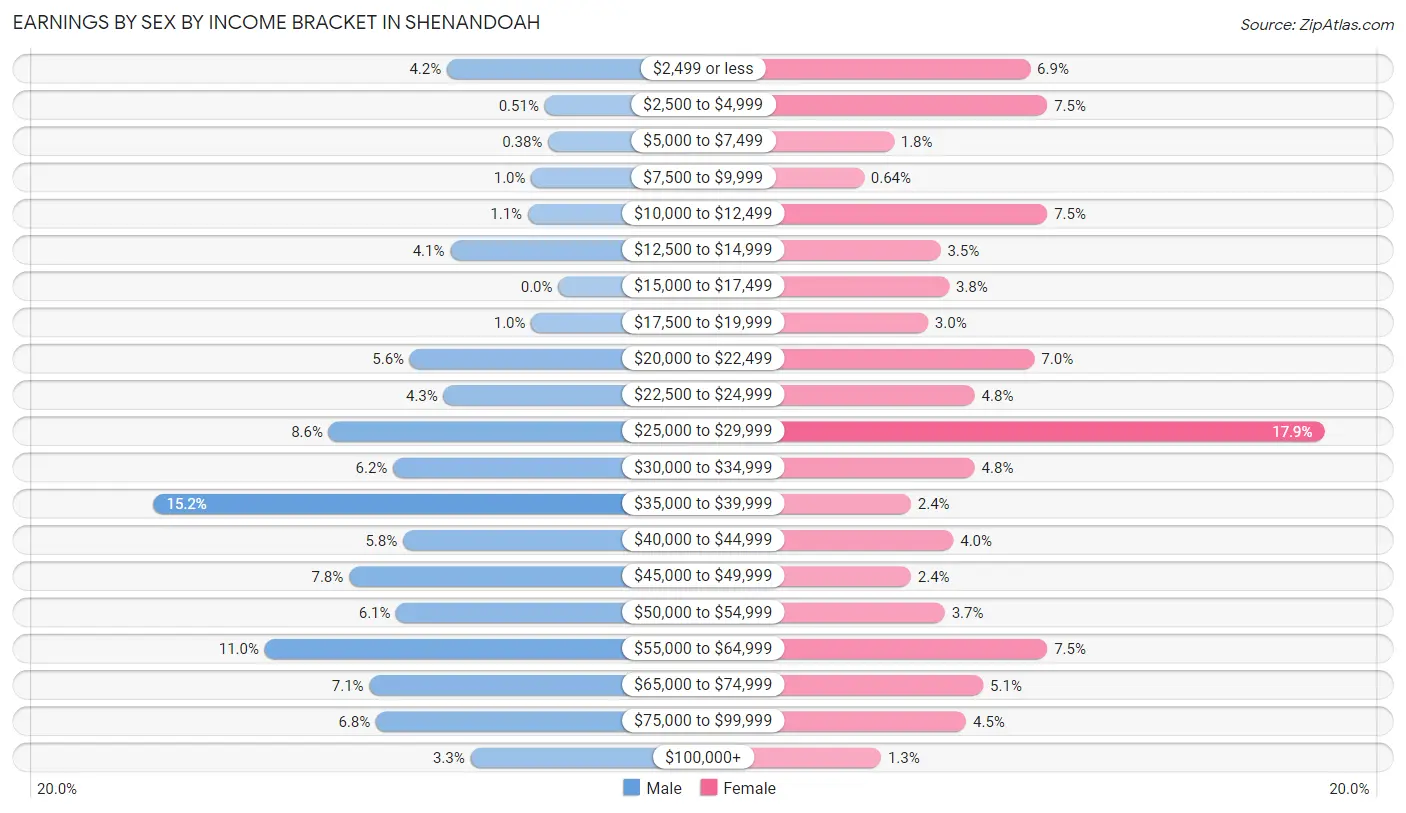
Earnings by Sex by Income Bracket in Shenandoah
The most common earnings brackets in Shenandoah are $35,000 to $39,999 for men (120 | 15.2%) and $25,000 to $29,999 for women (112 | 17.9%).
| Income | Male | Female |
| $2,499 or less | 33 (4.2%) | 43 (6.9%) |
| $2,500 to $4,999 | 4 (0.5%) | 47 (7.5%) |
| $5,000 to $7,499 | 3 (0.4%) | 11 (1.8%) |
| $7,500 to $9,999 | 8 (1.0%) | 4 (0.6%) |
| $10,000 to $12,499 | 9 (1.1%) | 47 (7.5%) |
| $12,500 to $14,999 | 32 (4.1%) | 22 (3.5%) |
| $15,000 to $17,499 | 0 (0.0%) | 24 (3.8%) |
| $17,500 to $19,999 | 8 (1.0%) | 19 (3.0%) |
| $20,000 to $22,499 | 44 (5.6%) | 44 (7.0%) |
| $22,500 to $24,999 | 34 (4.3%) | 30 (4.8%) |
| $25,000 to $29,999 | 68 (8.6%) | 112 (17.9%) |
| $30,000 to $34,999 | 49 (6.2%) | 30 (4.8%) |
| $35,000 to $39,999 | 120 (15.2%) | 15 (2.4%) |
| $40,000 to $44,999 | 46 (5.8%) | 25 (4.0%) |
| $45,000 to $49,999 | 62 (7.8%) | 15 (2.4%) |
| $50,000 to $54,999 | 48 (6.1%) | 23 (3.7%) |
| $55,000 to $64,999 | 87 (11.0%) | 47 (7.5%) |
| $65,000 to $74,999 | 56 (7.1%) | 32 (5.1%) |
| $75,000 to $99,999 | 54 (6.8%) | 28 (4.5%) |
| $100,000+ | 26 (3.3%) | 8 (1.3%) |
| Total | 791 (100.0%) | 626 (100.0%) |
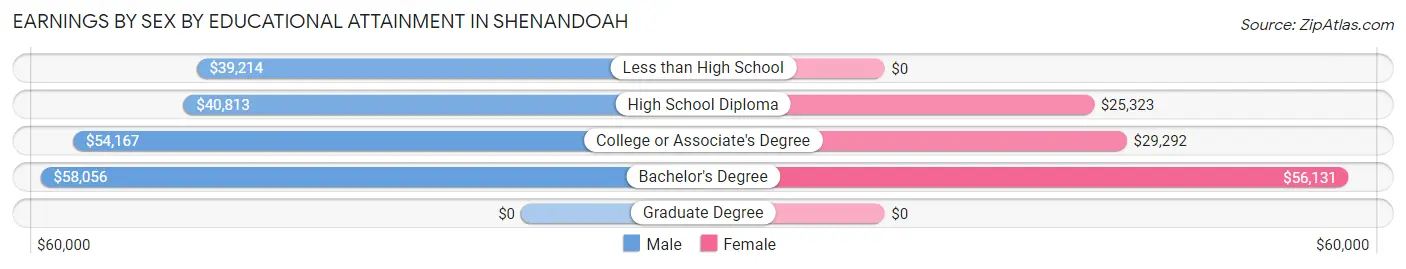
Earnings by Sex by Educational Attainment in Shenandoah
Average earnings in Shenandoah are $43,636 for men and $27,183 for women, a difference of 37.7%. Men with an educational attainment of bachelor's degree enjoy the highest average annual earnings of $58,056, while those with less than high school education earn the least with $39,214. Women with an educational attainment of bachelor's degree earn the most with the average annual earnings of $56,131, while those with high school diploma education have the smallest earnings of $25,323.
| Educational Attainment | Male Income | Female Income |
| Less than High School | $39,214 | $0 |
| High School Diploma | $40,813 | $25,323 |
| College or Associate's Degree | $54,167 | $29,292 |
| Bachelor's Degree | $58,056 | $56,131 |
| Graduate Degree | - | - |
| Total | $43,636 | $27,183 |
Family Income in Shenandoah
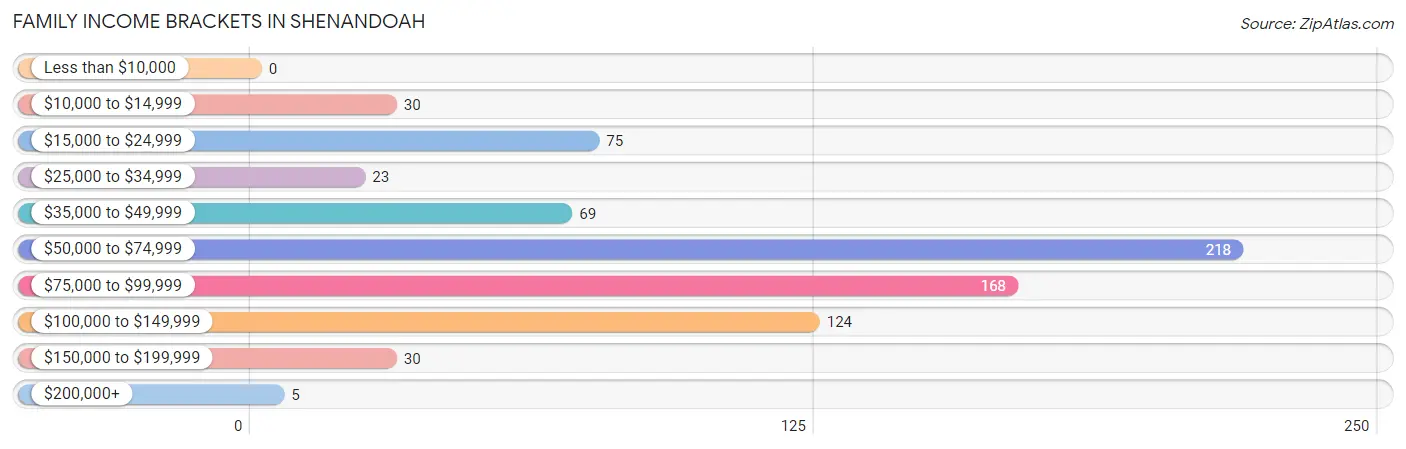
Family Income Brackets in Shenandoah
According to the Shenandoah family income data, there are 218 families falling into the $50,000 to $74,999 income range, which is the most common income bracket and makes up 29.4% of all families.
| Income Bracket | # Families | % Families |
| Less than $10,000 | 0 | 0.0% |
| $10,000 to $14,999 | 30 | 4.0% |
| $15,000 to $24,999 | 75 | 10.1% |
| $25,000 to $34,999 | 23 | 3.1% |
| $35,000 to $49,999 | 69 | 9.3% |
| $50,000 to $74,999 | 218 | 29.4% |
| $75,000 to $99,999 | 168 | 22.6% |
| $100,000 to $149,999 | 124 | 16.7% |
| $150,000 to $199,999 | 30 | 4.0% |
| $200,000+ | 5 | 0.7% |
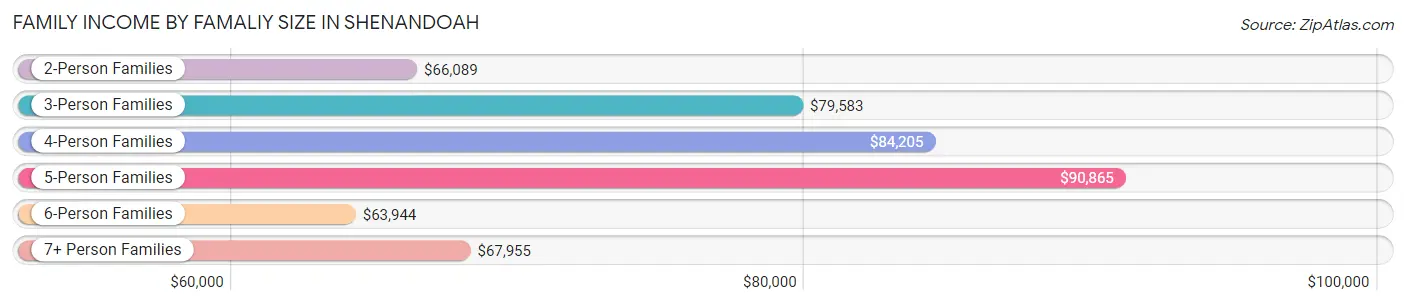
Family Income by Famaliy Size in Shenandoah
5-person families (65 | 8.8%) account for the highest median family income in Shenandoah with $90,865 per family, while 2-person families (277 | 37.3%) have the highest median income of $33,044 per family member.
| Income Bracket | # Families | Median Income |
| 2-Person Families | 277 (37.3%) | $66,089 |
| 3-Person Families | 190 (25.6%) | $79,583 |
| 4-Person Families | 111 (15.0%) | $84,205 |
| 5-Person Families | 65 (8.8%) | $90,865 |
| 6-Person Families | 69 (9.3%) | $63,944 |
| 7+ Person Families | 30 (4.0%) | $67,955 |
| Total | 742 (100.0%) | $67,857 |
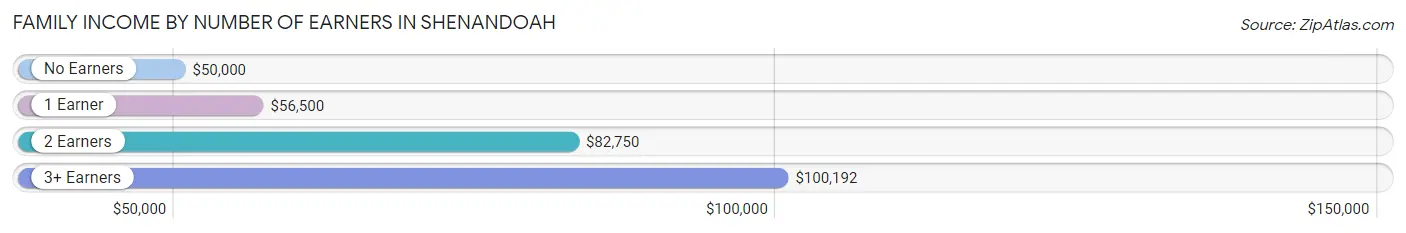
Family Income by Number of Earners in Shenandoah
The median family income in Shenandoah is $67,857, with families comprising 3+ earners (76) having the highest median family income of $100,192, while families with no earners (86) have the lowest median family income of $50,000, accounting for 10.2% and 11.6% of families, respectively.
| Number of Earners | # Families | Median Income |
| No Earners | 86 (11.6%) | $50,000 |
| 1 Earner | 284 (38.3%) | $56,500 |
| 2 Earners | 296 (39.9%) | $82,750 |
| 3+ Earners | 76 (10.2%) | $100,192 |
| Total | 742 (100.0%) | $67,857 |
Household Income in Shenandoah
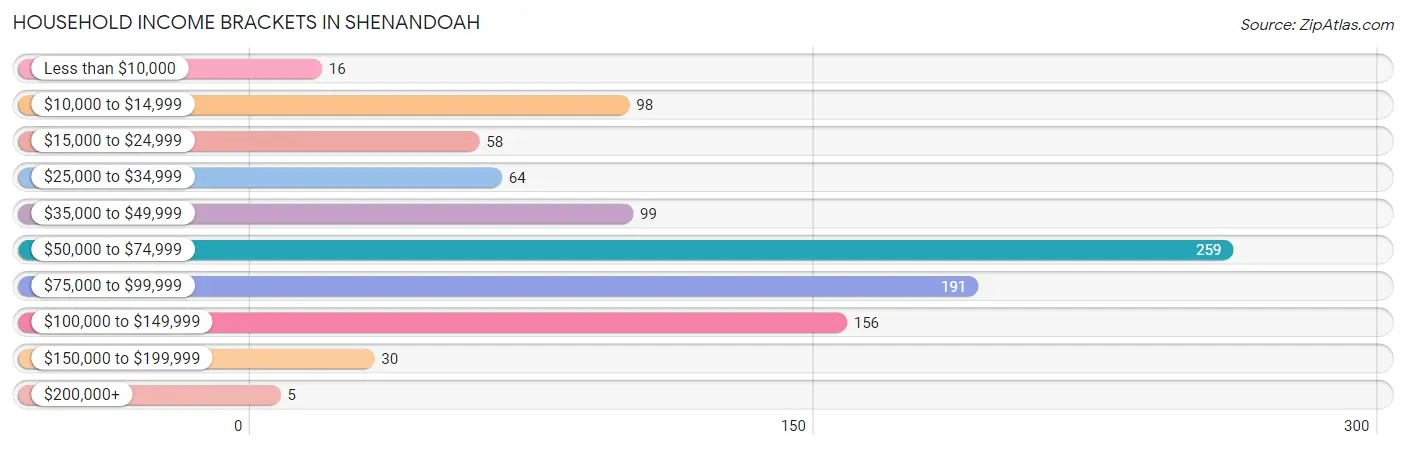
Household Income Brackets in Shenandoah
With 259 households falling in the category, the $50,000 to $74,999 income range is the most frequent in Shenandoah, accounting for 26.5% of all households. In contrast, only 5 households (0.5%) fall into the $200,000+ income bracket, making it the least populous group.
| Income Bracket | # Households | % Households |
| Less than $10,000 | 16 | 1.6% |
| $10,000 to $14,999 | 98 | 10.0% |
| $15,000 to $24,999 | 58 | 5.9% |
| $25,000 to $34,999 | 64 | 6.6% |
| $35,000 to $49,999 | 99 | 10.1% |
| $50,000 to $74,999 | 259 | 26.5% |
| $75,000 to $99,999 | 191 | 19.6% |
| $100,000 to $149,999 | 156 | 16.0% |
| $150,000 to $199,999 | 30 | 3.1% |
| $200,000+ | 5 | 0.5% |
Household Income by Householder Age in Shenandoah
The median household income in Shenandoah is $64,410, with the highest median household income of $78,542 found in the 45 to 64 years age bracket for the primary householder. A total of 354 households (36.3%) fall into this category. Meanwhile, the 65+ years age bracket for the primary householder has the lowest median household income of $47,396, with 291 households (29.8%) in this group.
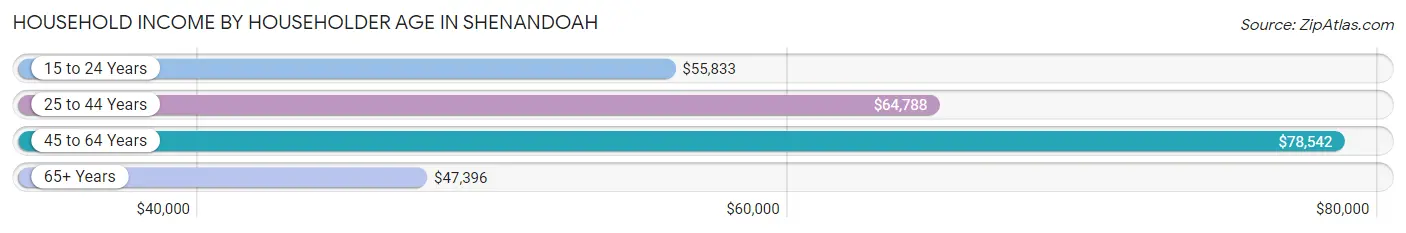
| Income Bracket | # Households | Median Income |
| 15 to 24 Years | 10 (1.0%) | $55,833 |
| 25 to 44 Years | 321 (32.9%) | $64,788 |
| 45 to 64 Years | 354 (36.3%) | $78,542 |
| 65+ Years | 291 (29.8%) | $47,396 |
| Total | 976 (100.0%) | $64,410 |
Poverty in Shenandoah
Income Below Poverty by Sex and Age in Shenandoah
With 20.6% poverty level for males and 19.3% for females among the residents of Shenandoah, 15 year old males and 5 year old females are the most vulnerable to poverty, with 24 males (64.9%) and 1 females (100.0%) in their respective age groups living below the poverty level.
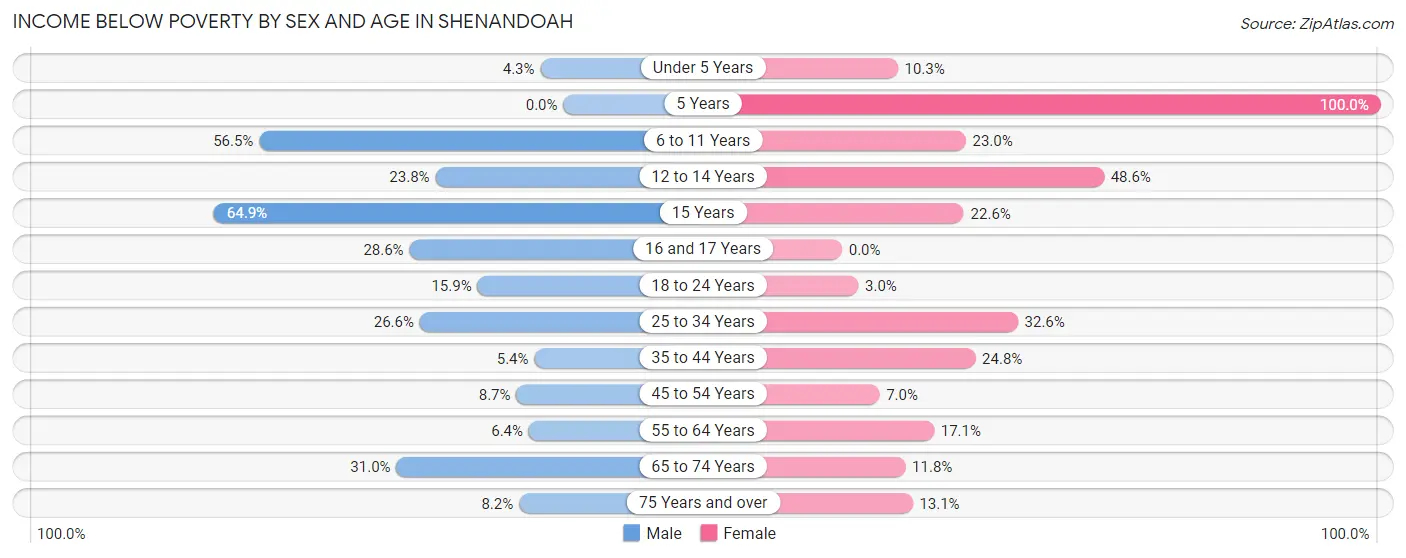
| Age Bracket | Male | Female |
| Under 5 Years | 4 (4.3%) | 6 (10.3%) |
| 5 Years | 0 (0.0%) | 1 (100.0%) |
| 6 to 11 Years | 83 (56.5%) | 34 (23.0%) |
| 12 to 14 Years | 19 (23.7%) | 35 (48.6%) |
| 15 Years | 24 (64.9%) | 19 (22.6%) |
| 16 and 17 Years | 22 (28.6%) | 0 (0.0%) |
| 18 to 24 Years | 22 (15.9%) | 3 (3.0%) |
| 25 to 34 Years | 57 (26.6%) | 77 (32.6%) |
| 35 to 44 Years | 12 (5.4%) | 50 (24.7%) |
| 45 to 54 Years | 15 (8.7%) | 13 (7.0%) |
| 55 to 64 Years | 8 (6.4%) | 14 (17.1%) |
| 65 to 74 Years | 44 (31.0%) | 18 (11.8%) |
| 75 Years and over | 6 (8.2%) | 16 (13.1%) |
| Total | 316 (20.6%) | 286 (19.3%) |
Income Above Poverty by Sex and Age in Shenandoah
According to the poverty statistics in Shenandoah, males aged 5 years and females aged 16 and 17 years are the age groups that are most secure financially, with 100.0% of males and 100.0% of females in these age groups living above the poverty line.
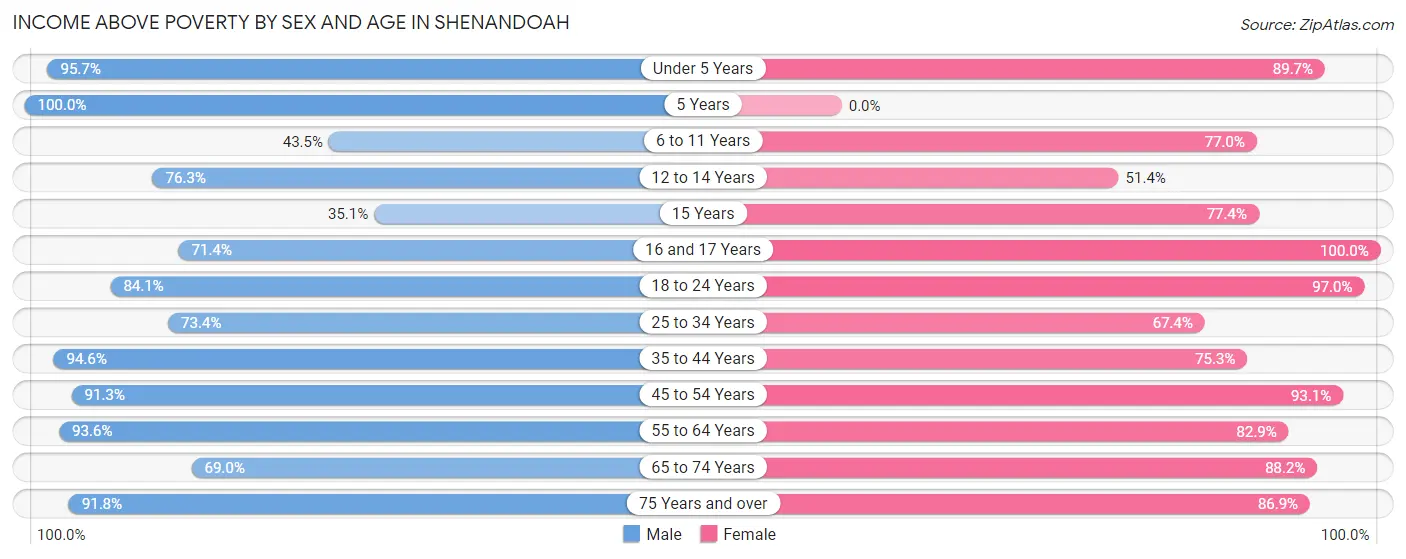
| Age Bracket | Male | Female |
| Under 5 Years | 90 (95.7%) | 52 (89.7%) |
| 5 Years | 10 (100.0%) | 0 (0.0%) |
| 6 to 11 Years | 64 (43.5%) | 114 (77.0%) |
| 12 to 14 Years | 61 (76.2%) | 37 (51.4%) |
| 15 Years | 13 (35.1%) | 65 (77.4%) |
| 16 and 17 Years | 55 (71.4%) | 38 (100.0%) |
| 18 to 24 Years | 116 (84.1%) | 96 (97.0%) |
| 25 to 34 Years | 157 (73.4%) | 159 (67.4%) |
| 35 to 44 Years | 211 (94.6%) | 152 (75.2%) |
| 45 to 54 Years | 157 (91.3%) | 174 (93.0%) |
| 55 to 64 Years | 117 (93.6%) | 68 (82.9%) |
| 65 to 74 Years | 98 (69.0%) | 135 (88.2%) |
| 75 Years and over | 67 (91.8%) | 106 (86.9%) |
| Total | 1,216 (79.4%) | 1,196 (80.7%) |
Income Below Poverty Among Married-Couple Families in Shenandoah
The poverty statistics for married-couple families in Shenandoah show that 0.2% or 1 of the total 553 families live below the poverty line. Families with 3 or 4 children have the highest poverty rate of 1.1%, comprising of 1 families. On the other hand, families with no children have the lowest poverty rate of 0.0%, which includes 0 families.
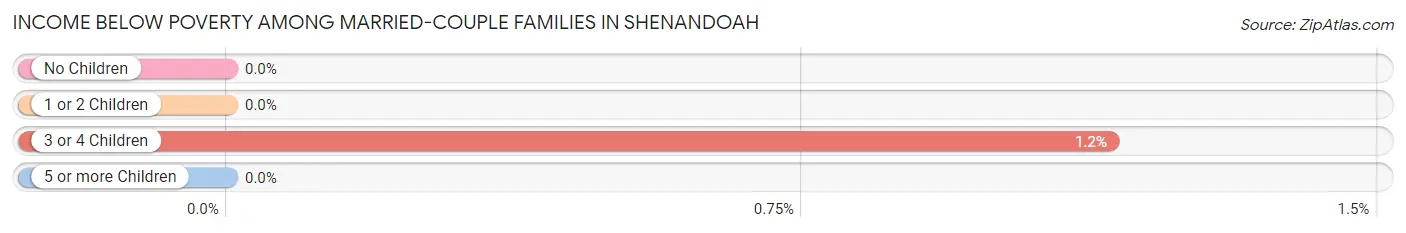
| Children | Above Poverty | Below Poverty |
| No Children | 293 (100.0%) | 0 (0.0%) |
| 1 or 2 Children | 173 (100.0%) | 0 (0.0%) |
| 3 or 4 Children | 86 (98.9%) | 1 (1.1%) |
| 5 or more Children | 0 (0.0%) | 0 (0.0%) |
| Total | 552 (99.8%) | 1 (0.2%) |
Income Below Poverty Among Single-Parent Households in Shenandoah
According to the poverty data in Shenandoah, 52.4% or 33 single-father households and 47.6% or 60 single-mother households are living below the poverty line. Among single-father households, those with 1 or 2 children have the highest poverty rate, with 30 households (65.2%) experiencing poverty. Likewise, among single-mother households, those with 3 or 4 children have the highest poverty rate, with 33 households (100.0%) falling below the poverty line.
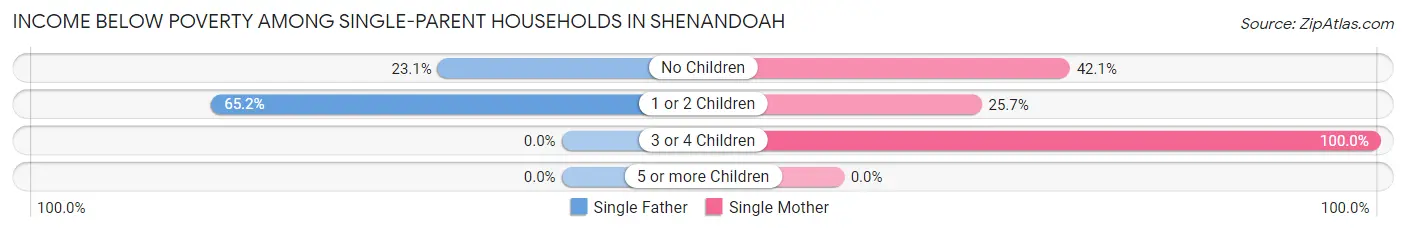
| Children | Single Father | Single Mother |
| No Children | 3 (23.1%) | 8 (42.1%) |
| 1 or 2 Children | 30 (65.2%) | 19 (25.7%) |
| 3 or 4 Children | 0 (0.0%) | 33 (100.0%) |
| 5 or more Children | 0 (0.0%) | 0 (0.0%) |
| Total | 33 (52.4%) | 60 (47.6%) |
Income Below Poverty Among Married-Couple vs Single-Parent Households in Shenandoah
The poverty data for Shenandoah shows that 1 of the married-couple family households (0.2%) and 93 of the single-parent households (49.2%) are living below the poverty level. Within the married-couple family households, those with 3 or 4 children have the highest poverty rate, with 1 households (1.1%) falling below the poverty line. Among the single-parent households, those with 3 or 4 children have the highest poverty rate, with 33 household (89.2%) living below poverty.
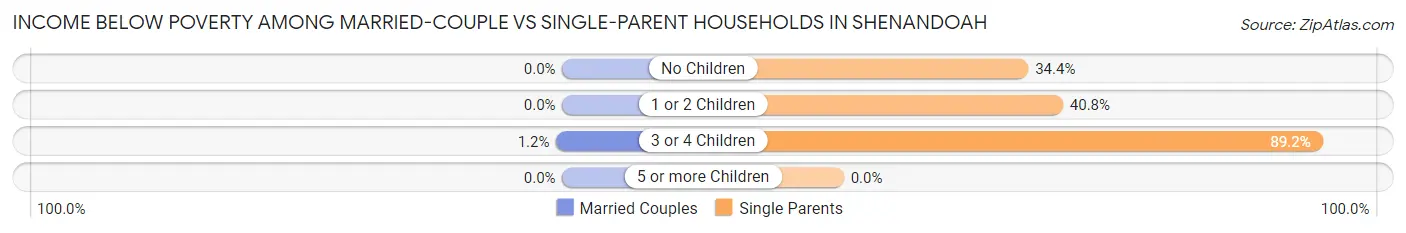
| Children | Married-Couple Families | Single-Parent Households |
| No Children | 0 (0.0%) | 11 (34.4%) |
| 1 or 2 Children | 0 (0.0%) | 49 (40.8%) |
| 3 or 4 Children | 1 (1.1%) | 33 (89.2%) |
| 5 or more Children | 0 (0.0%) | 0 (0.0%) |
| Total | 1 (0.2%) | 93 (49.2%) |
Race in Shenandoah
The most populous races in Shenandoah are White / Caucasian (2,577 | 85.3%), Two or more Races (341 | 11.3%), and Hispanic or Latino (319 | 10.6%).
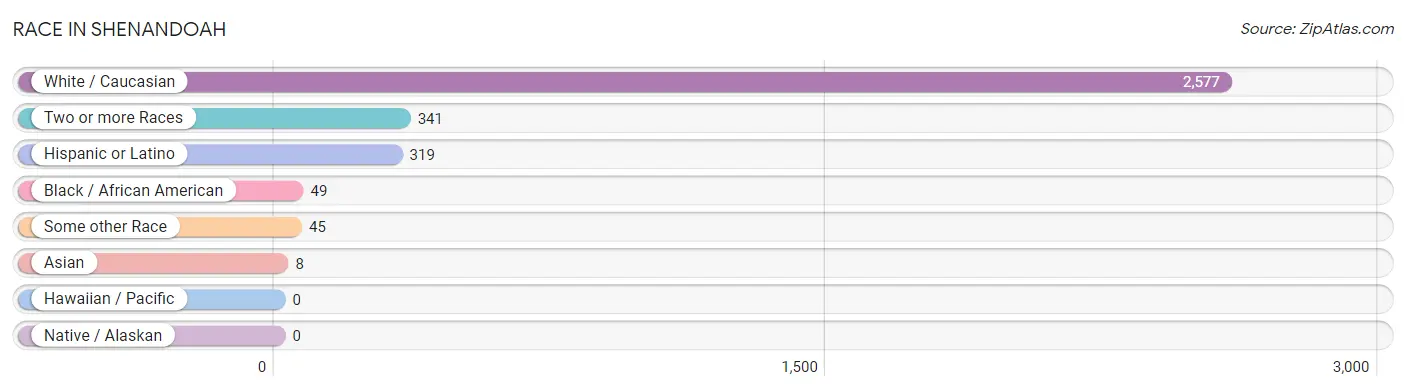
| Race | # Population | % Population |
| Asian | 8 | 0.3% |
| Black / African American | 49 | 1.6% |
| Hawaiian / Pacific | 0 | 0.0% |
| Hispanic or Latino | 319 | 10.6% |
| Native / Alaskan | 0 | 0.0% |
| White / Caucasian | 2,577 | 85.3% |
| Two or more Races | 341 | 11.3% |
| Some other Race | 45 | 1.5% |
| Total | 3,020 | 100.0% |
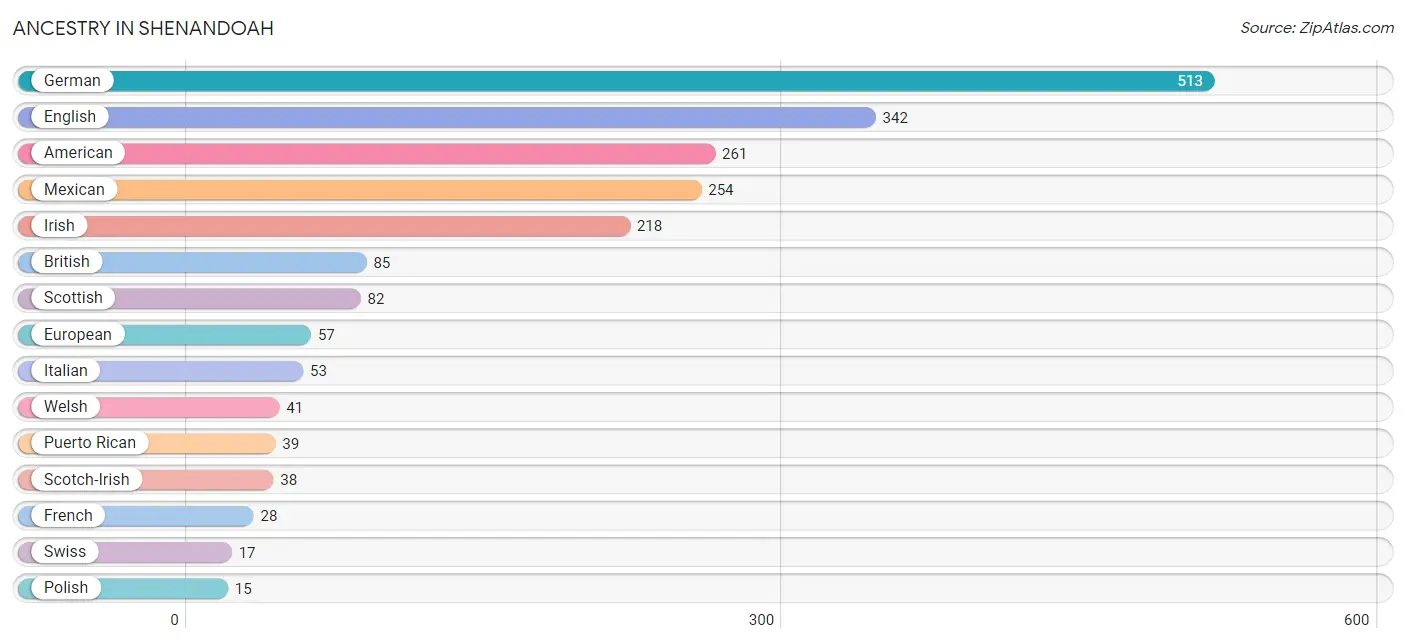
Ancestry in Shenandoah
The most populous ancestries reported in Shenandoah are German (513 | 17.0%), English (342 | 11.3%), American (261 | 8.6%), Mexican (254 | 8.4%), and Irish (218 | 7.2%), together accounting for 52.6% of all Shenandoah residents.
| Ancestry | # Population | % Population |
| American | 261 | 8.6% |
| Arab | 2 | 0.1% |
| British | 85 | 2.8% |
| Central American | 13 | 0.4% |
| Cherokee | 5 | 0.2% |
| Czech | 9 | 0.3% |
| Danish | 6 | 0.2% |
| Dutch | 9 | 0.3% |
| English | 342 | 11.3% |
| European | 57 | 1.9% |
| French | 28 | 0.9% |
| German | 513 | 17.0% |
| Irish | 218 | 7.2% |
| Italian | 53 | 1.8% |
| Lebanese | 2 | 0.1% |
| Lithuanian | 3 | 0.1% |
| Mexican | 254 | 8.4% |
| Norwegian | 7 | 0.2% |
| Pakistani | 8 | 0.3% |
| Polish | 15 | 0.5% |
| Puerto Rican | 39 | 1.3% |
| Romanian | 4 | 0.1% |
| Russian | 12 | 0.4% |
| Salvadoran | 13 | 0.4% |
| Scotch-Irish | 38 | 1.3% |
| Scottish | 82 | 2.7% |
| South American | 7 | 0.2% |
| Spanish | 6 | 0.2% |
| Swedish | 4 | 0.1% |
| Swiss | 17 | 0.6% |
| U.S. Virgin Islander | 13 | 0.4% |
| Welsh | 41 | 1.4% |
| West Indian | 7 | 0.2% | View All 33 Rows |
Immigrants in Shenandoah
The most numerous immigrant groups reported in Shenandoah came from Latin America (155 | 5.1%), Central America (149 | 4.9%), Mexico (142 | 4.7%), Europe (56 | 1.8%), and Northern Europe (52 | 1.7%), together accounting for 18.3% of all Shenandoah residents.
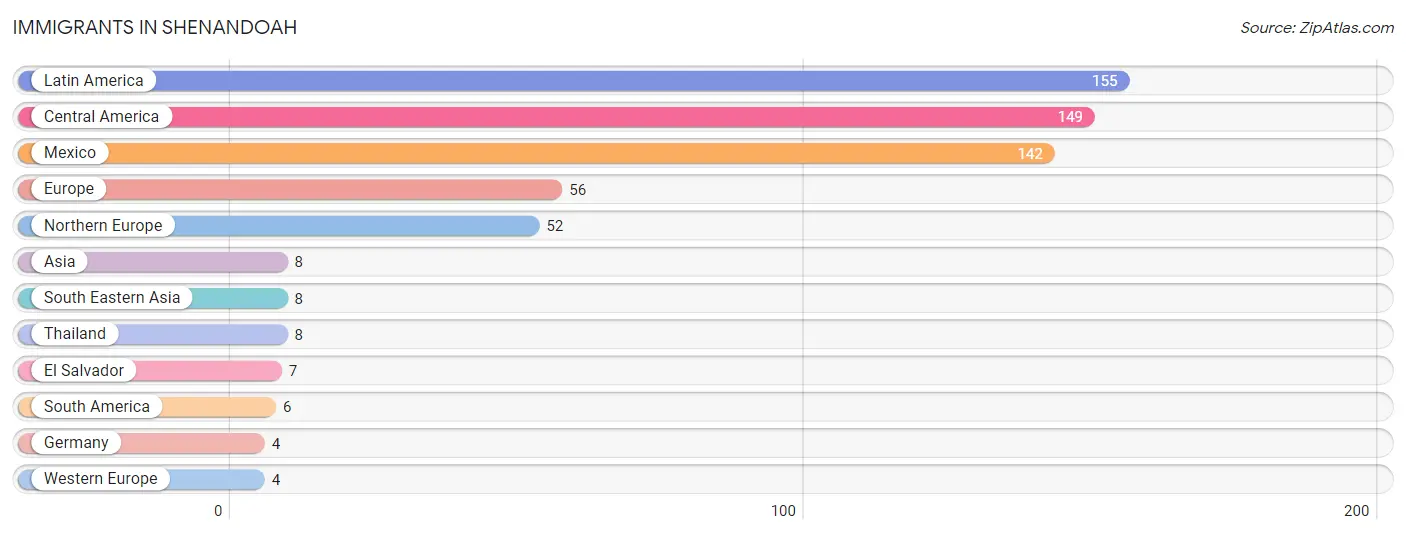
| Immigration Origin | # Population | % Population |
| Asia | 8 | 0.3% |
| Central America | 149 | 4.9% |
| El Salvador | 7 | 0.2% |
| Europe | 56 | 1.8% |
| Germany | 4 | 0.1% |
| Latin America | 155 | 5.1% |
| Mexico | 142 | 4.7% |
| Northern Europe | 52 | 1.7% |
| South America | 6 | 0.2% |
| South Eastern Asia | 8 | 0.3% |
| Thailand | 8 | 0.3% |
| Western Europe | 4 | 0.1% | View All 12 Rows |
Sex and Age in Shenandoah
Sex and Age in Shenandoah
The most populous age groups in Shenandoah are 15 to 19 Years (180 | 11.7%) for men and 25 to 29 Years (156 | 10.5%) for women.
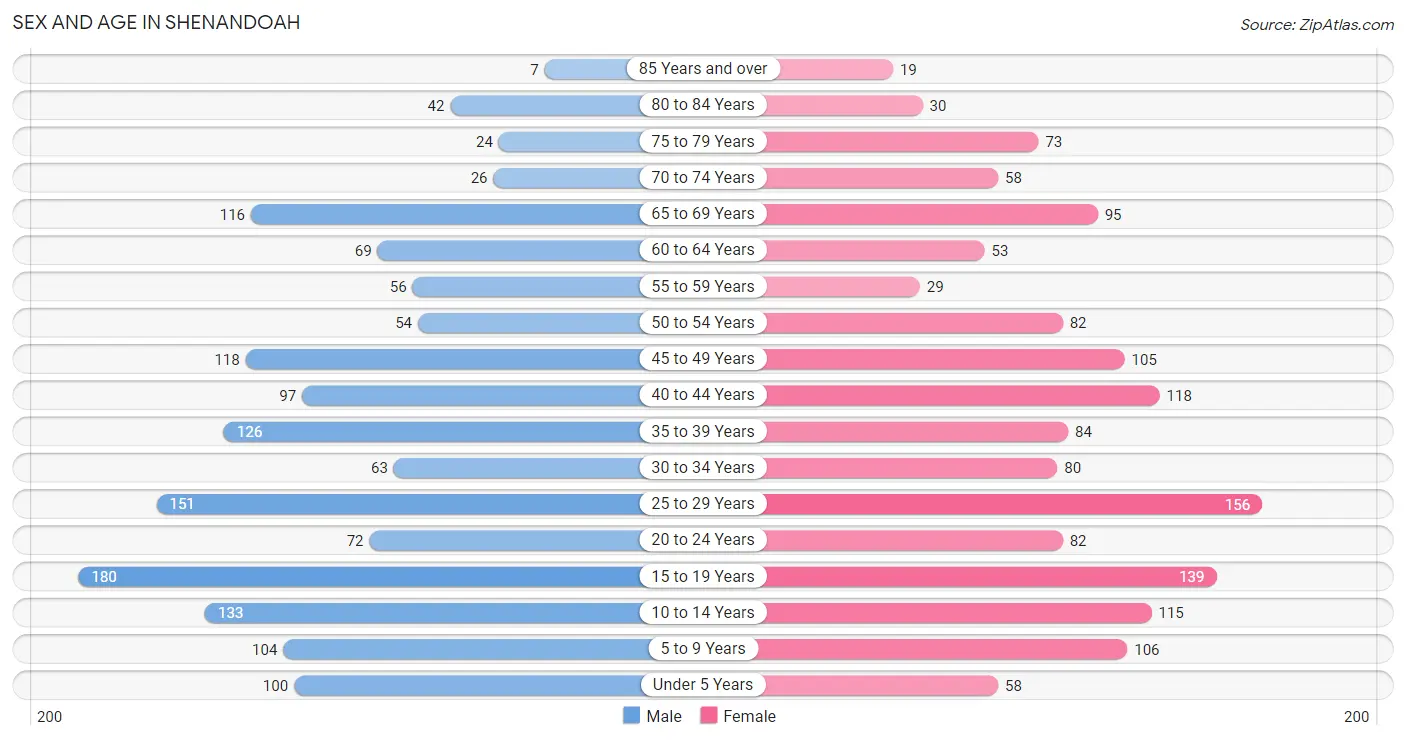
| Age Bracket | Male | Female |
| Under 5 Years | 100 (6.5%) | 58 (3.9%) |
| 5 to 9 Years | 104 (6.8%) | 106 (7.1%) |
| 10 to 14 Years | 133 (8.6%) | 115 (7.8%) |
| 15 to 19 Years | 180 (11.7%) | 139 (9.4%) |
| 20 to 24 Years | 72 (4.7%) | 82 (5.5%) |
| 25 to 29 Years | 151 (9.8%) | 156 (10.5%) |
| 30 to 34 Years | 63 (4.1%) | 80 (5.4%) |
| 35 to 39 Years | 126 (8.2%) | 84 (5.7%) |
| 40 to 44 Years | 97 (6.3%) | 118 (8.0%) |
| 45 to 49 Years | 118 (7.7%) | 105 (7.1%) |
| 50 to 54 Years | 54 (3.5%) | 82 (5.5%) |
| 55 to 59 Years | 56 (3.6%) | 29 (2.0%) |
| 60 to 64 Years | 69 (4.5%) | 53 (3.6%) |
| 65 to 69 Years | 116 (7.5%) | 95 (6.4%) |
| 70 to 74 Years | 26 (1.7%) | 58 (3.9%) |
| 75 to 79 Years | 24 (1.6%) | 73 (4.9%) |
| 80 to 84 Years | 42 (2.7%) | 30 (2.0%) |
| 85 Years and over | 7 (0.5%) | 19 (1.3%) |
| Total | 1,538 (100.0%) | 1,482 (100.0%) |
Families and Households in Shenandoah
Median Family Size in Shenandoah
The median family size in Shenandoah is 3.60 persons per family, with single female/mother families (126 | 17.0%) accounting for the largest median family size of 5.52 persons per family. On the other hand, single male/father families (63 | 8.5%) represent the smallest median family size with 2.59 persons per family.
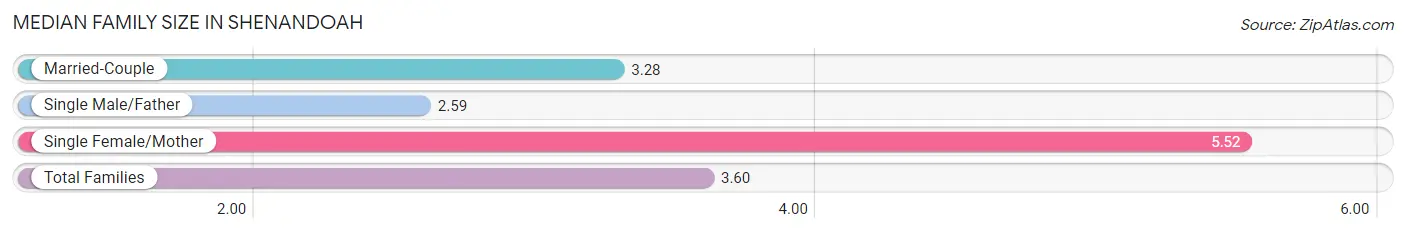
| Family Type | # Families | Family Size |
| Married-Couple | 553 (74.5%) | 3.28 |
| Single Male/Father | 63 (8.5%) | 2.59 |
| Single Female/Mother | 126 (17.0%) | 5.52 |
| Total Families | 742 (100.0%) | 3.60 |
Median Household Size in Shenandoah
The median household size in Shenandoah is 3.09 persons per household, with single female/mother households (126 | 12.9%) accounting for the largest median household size of 5.72 persons per household. non-family households (234 | 24.0%) represent the smallest median household size with 1.11 persons per household.
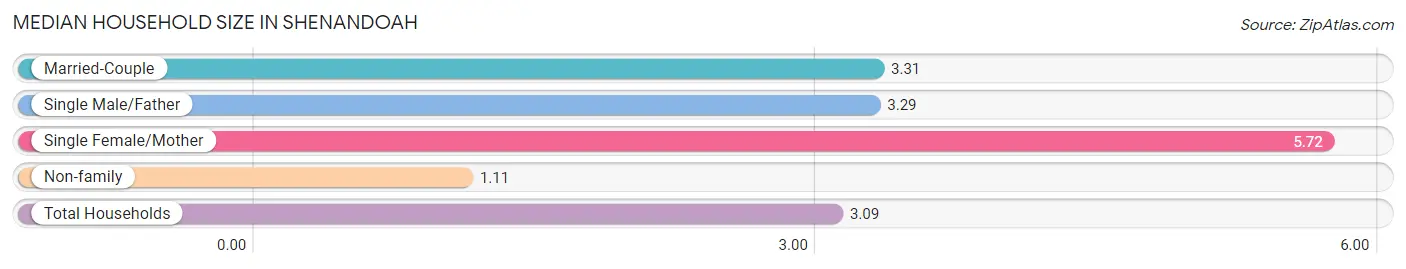
| Household Type | # Households | Household Size |
| Married-Couple | 553 (56.7%) | 3.31 |
| Single Male/Father | 63 (6.5%) | 3.29 |
| Single Female/Mother | 126 (12.9%) | 5.72 |
| Non-family | 234 (24.0%) | 1.11 |
| Total Households | 976 (100.0%) | 3.09 |
Household Size by Marriage Status in Shenandoah
Out of a total of 976 households in Shenandoah, 742 (76.0%) are family households, while 234 (24.0%) are nonfamily households. The most numerous type of family households are 2-person households, comprising 250, and the most common type of nonfamily households are 1-person households, comprising 212.
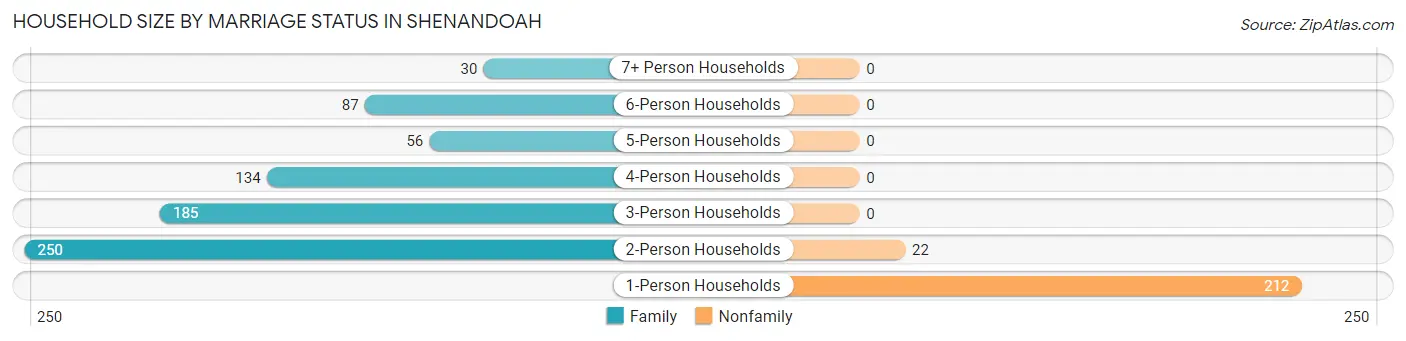
| Household Size | Family Households | Nonfamily Households |
| 1-Person Households | - | 212 (21.7%) |
| 2-Person Households | 250 (25.6%) | 22 (2.2%) |
| 3-Person Households | 185 (19.0%) | 0 (0.0%) |
| 4-Person Households | 134 (13.7%) | 0 (0.0%) |
| 5-Person Households | 56 (5.7%) | 0 (0.0%) |
| 6-Person Households | 87 (8.9%) | 0 (0.0%) |
| 7+ Person Households | 30 (3.1%) | 0 (0.0%) |
| Total | 742 (76.0%) | 234 (24.0%) |
Female Fertility in Shenandoah
Fertility by Age in Shenandoah
Average fertility rate in Shenandoah is 25.0 births per 1,000 women. Women in the age bracket of 20 to 34 years have the highest fertility rate with 38.0 births per 1,000 women. Women in the age bracket of 20 to 34 years acount for 60.0% of all women with births.
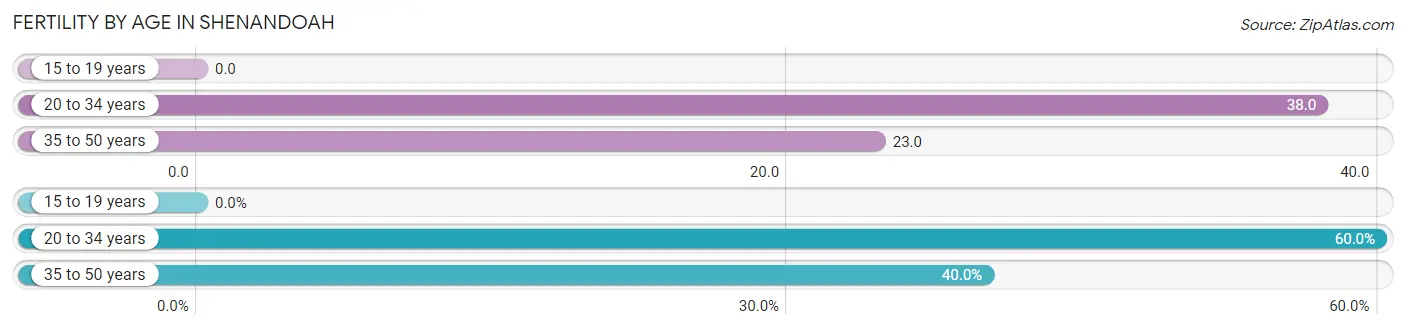
| Age Bracket | Women with Births | Births / 1,000 Women |
| 15 to 19 years | 0 (0.0%) | 0.0 |
| 20 to 34 years | 12 (60.0%) | 38.0 |
| 35 to 50 years | 8 (40.0%) | 23.0 |
| Total | 20 (100.0%) | 25.0 |
Fertility by Age by Marriage Status in Shenandoah
70.0% of women with births (20) in Shenandoah are married. The highest percentage of unmarried women with births falls into 20 to 34 years age bracket with 50.0% of them unmarried at the time of birth, while the lowest percentage of unmarried women with births belong to 35 to 50 years age bracket with 0.0% of them unmarried.
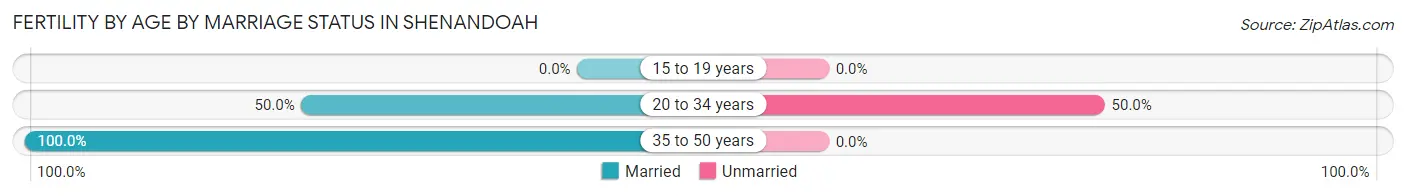
| Age Bracket | Married | Unmarried |
| 15 to 19 years | 0 (0.0%) | 0 (0.0%) |
| 20 to 34 years | 6 (50.0%) | 6 (50.0%) |
| 35 to 50 years | 8 (100.0%) | 0 (0.0%) |
| Total | 14 (70.0%) | 6 (30.0%) |
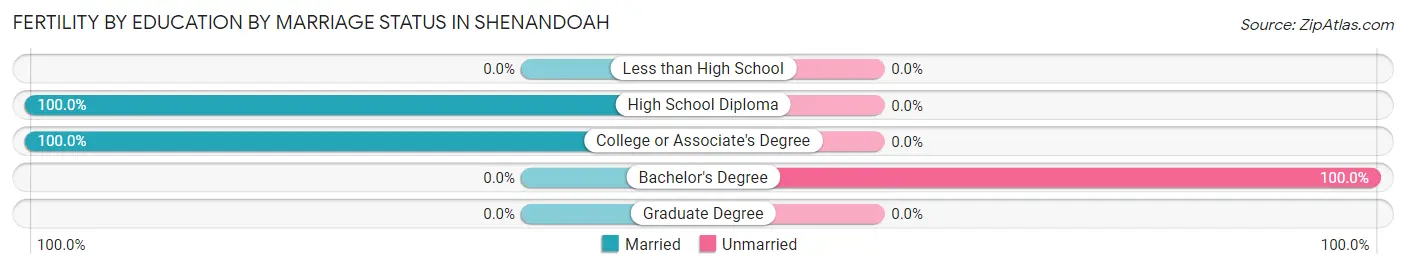
Fertility by Education in Shenandoah
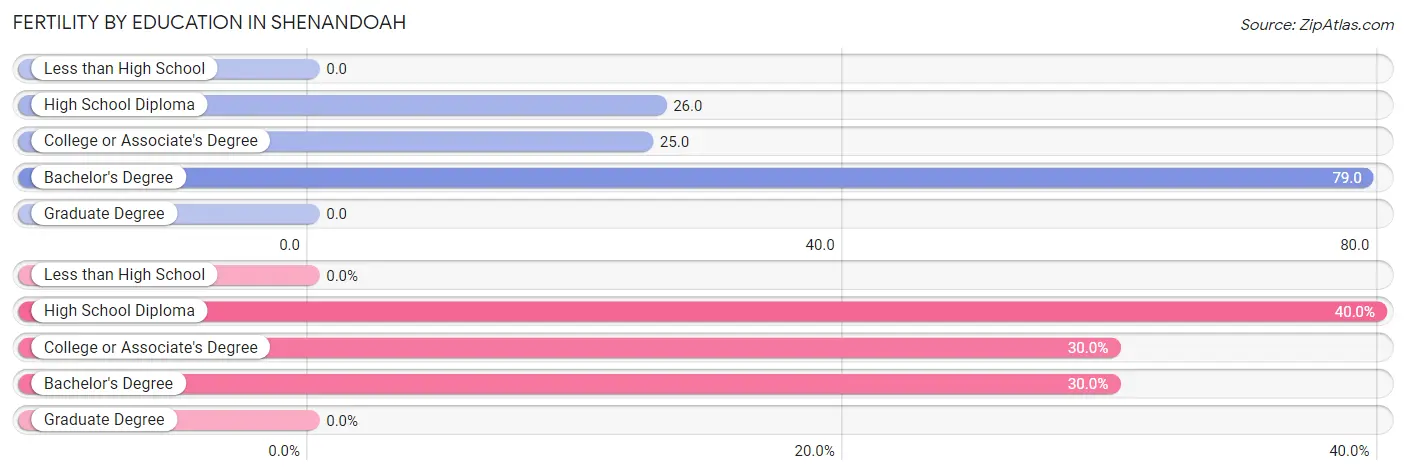
| Educational Attainment | Women with Births | Births / 1,000 Women |
| Less than High School | 0 (0.0%) | 0.0 |
| High School Diploma | 8 (40.0%) | 26.0 |
| College or Associate's Degree | 6 (30.0%) | 25.0 |
| Bachelor's Degree | 6 (30.0%) | 79.0 |
| Graduate Degree | 0 (0.0%) | 0.0 |
| Total | 20 (100.0%) | 25.0 |
Fertility by Education by Marriage Status in Shenandoah
30.0% of women with births in Shenandoah are unmarried. Women with the educational attainment of high school diploma are most likely to be married with 100.0% of them married at childbirth, while women with the educational attainment of bachelor's degree are least likely to be married with 100.0% of them unmarried at childbirth.
| Educational Attainment | Married | Unmarried |
| Less than High School | 0 (0.0%) | 0 (0.0%) |
| High School Diploma | 8 (100.0%) | 0 (0.0%) |
| College or Associate's Degree | 6 (100.0%) | 0 (0.0%) |
| Bachelor's Degree | 0 (0.0%) | 6 (100.0%) |
| Graduate Degree | 0 (0.0%) | 0 (0.0%) |
| Total | 14 (70.0%) | 6 (30.0%) |
Employment Characteristics in Shenandoah
Employment by Class of Employer in Shenandoah
Among the 1,214 employed individuals in Shenandoah, private company employees (866 | 71.3%), local government employees (96 | 7.9%), and self-employed (not incorporated) (62 | 5.1%) make up the most common classes of employment.
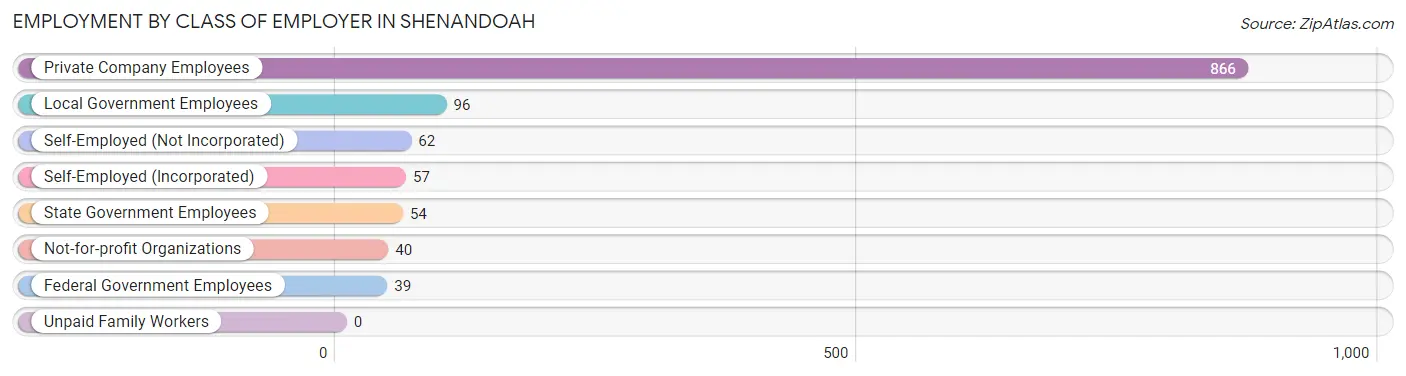
| Employer Class | # Employees | % Employees |
| Private Company Employees | 866 | 71.3% |
| Self-Employed (Incorporated) | 57 | 4.7% |
| Self-Employed (Not Incorporated) | 62 | 5.1% |
| Not-for-profit Organizations | 40 | 3.3% |
| Local Government Employees | 96 | 7.9% |
| State Government Employees | 54 | 4.4% |
| Federal Government Employees | 39 | 3.2% |
| Unpaid Family Workers | 0 | 0.0% |
| Total | 1,214 | 100.0% |
Employment Status by Age in Shenandoah
According to the labor force statistics for Shenandoah, out of the total population over 16 years of age (2,283), 61.1% or 1,395 individuals are in the labor force, with 3.5% or 49 of them unemployed. The age group with the highest labor force participation rate is 55 to 59 years, with 100.0% or 85 individuals in the labor force. Within the labor force, the 35 to 44 years age range has the highest percentage of unemployed individuals, with 9.5% or 30 of them being unemployed.
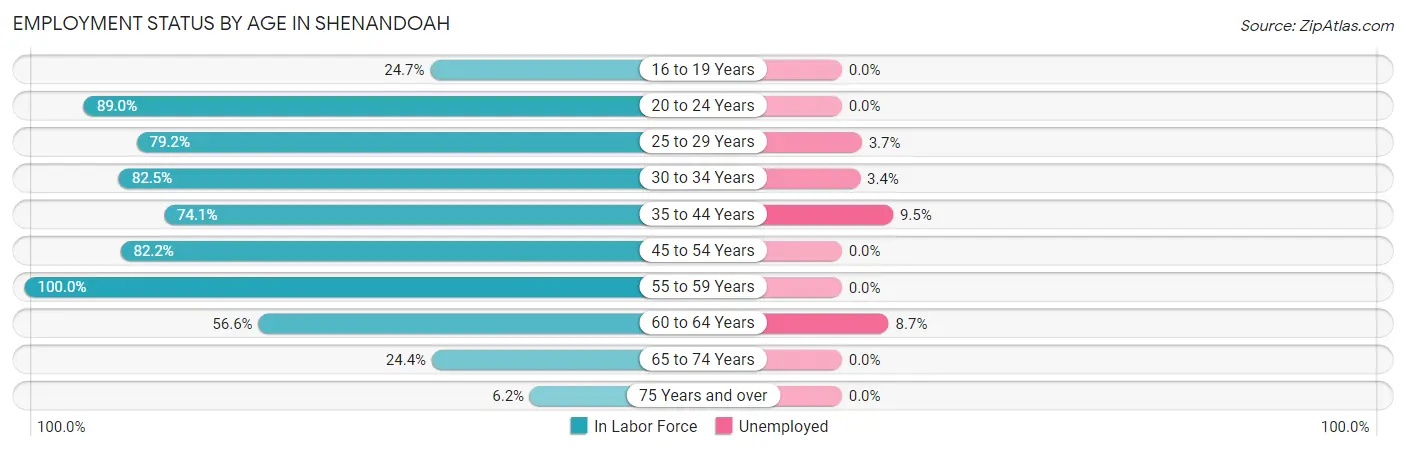
| Age Bracket | In Labor Force | Unemployed |
| 16 to 19 Years | 49 (24.7%) | 0 (0.0%) |
| 20 to 24 Years | 137 (89.0%) | 0 (0.0%) |
| 25 to 29 Years | 243 (79.2%) | 9 (3.7%) |
| 30 to 34 Years | 118 (82.5%) | 4 (3.4%) |
| 35 to 44 Years | 315 (74.1%) | 30 (9.5%) |
| 45 to 54 Years | 295 (82.2%) | 0 (0.0%) |
| 55 to 59 Years | 85 (100.0%) | 0 (0.0%) |
| 60 to 64 Years | 69 (56.6%) | 6 (8.7%) |
| 65 to 74 Years | 72 (24.4%) | 0 (0.0%) |
| 75 Years and over | 12 (6.2%) | 0 (0.0%) |
| Total | 1,395 (61.1%) | 49 (3.5%) |
Employment Status by Educational Attainment in Shenandoah
According to labor force statistics for Shenandoah, 78.1% of individuals (1,125) out of the total population between 25 and 64 years of age (1,441) are in the labor force, with 4.4% or 50 of them being unemployed. The group with the highest labor force participation rate are those with the educational attainment of bachelor's degree or higher, with 100.0% or 97 individuals in the labor force. Within the labor force, individuals with college / associate degree education have the highest percentage of unemployment, with 10.5% or 40 of them being unemployed.
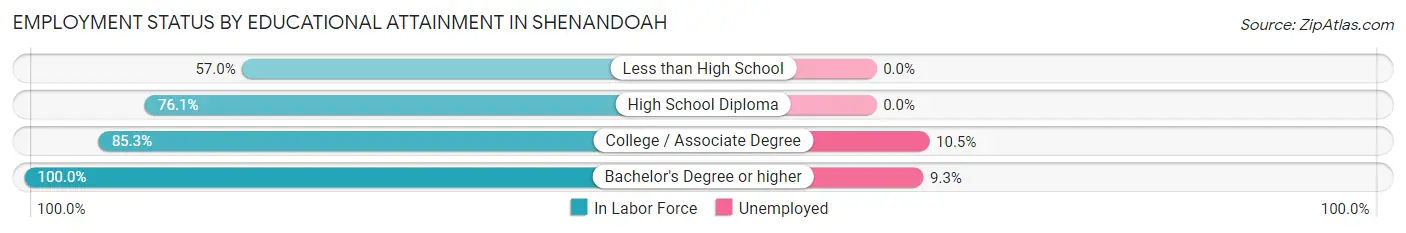
| Educational Attainment | In Labor Force | Unemployed |
| Less than High School | 106 (57.0%) | 0 (0.0%) |
| High School Diploma | 540 (76.1%) | 0 (0.0%) |
| College / Associate Degree | 382 (85.3%) | 47 (10.5%) |
| Bachelor's Degree or higher | 97 (100.0%) | 9 (9.3%) |
| Total | 1,125 (78.1%) | 63 (4.4%) |
Employment Occupations by Sex in Shenandoah
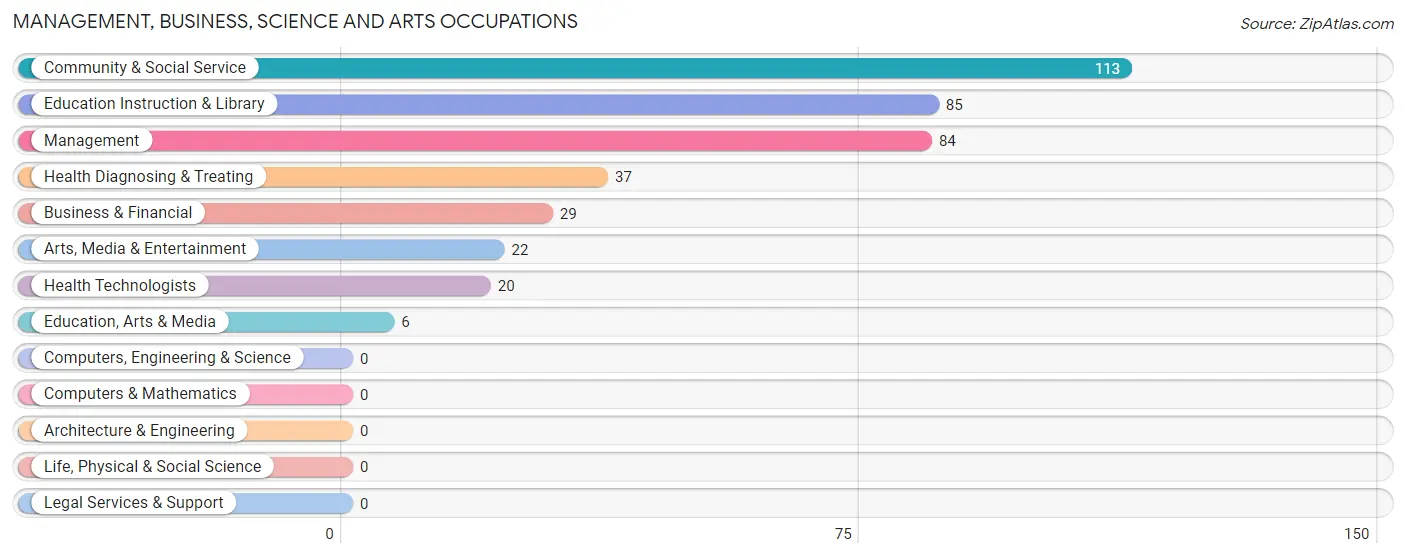
Management, Business, Science and Arts Occupations
The most common Management, Business, Science and Arts occupations in Shenandoah are Community & Social Service (113 | 8.4%), Education Instruction & Library (85 | 6.3%), Management (84 | 6.2%), Health Diagnosing & Treating (37 | 2.8%), and Business & Financial (29 | 2.1%).
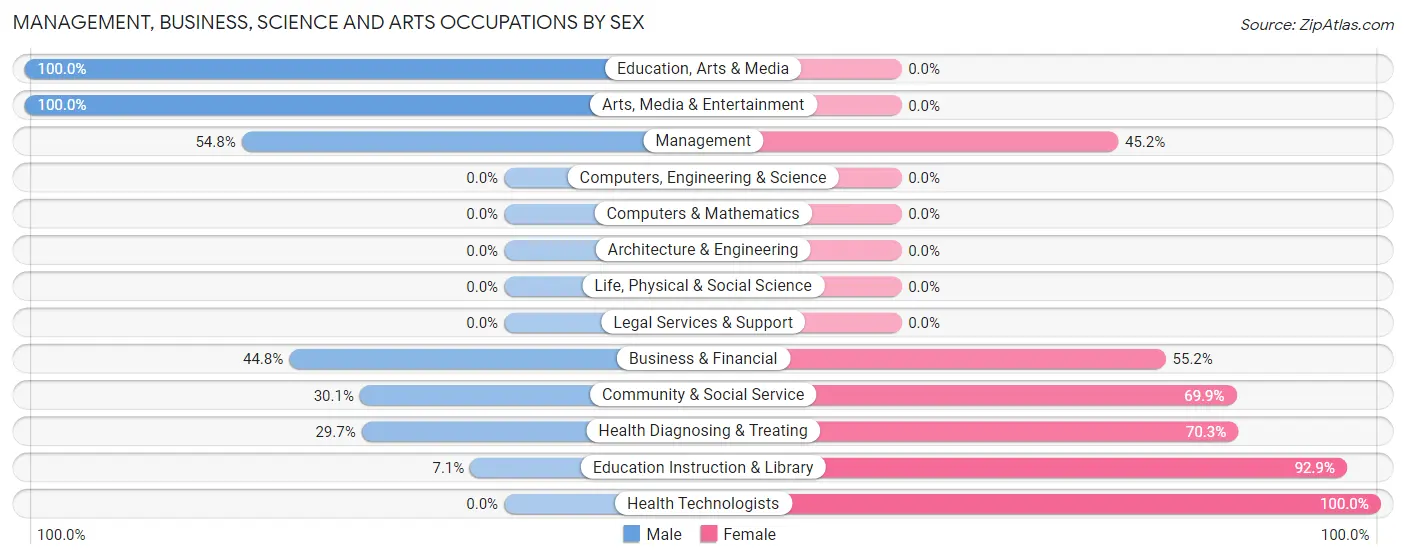
Management, Business, Science and Arts Occupations by Sex
Within the Management, Business, Science and Arts occupations in Shenandoah, the most male-oriented occupations are Education, Arts & Media (100.0%), Arts, Media & Entertainment (100.0%), and Management (54.8%), while the most female-oriented occupations are Health Technologists (100.0%), Education Instruction & Library (92.9%), and Health Diagnosing & Treating (70.3%).
| Occupation | Male | Female |
| Management | 46 (54.8%) | 38 (45.2%) |
| Business & Financial | 13 (44.8%) | 16 (55.2%) |
| Computers, Engineering & Science | 0 (0.0%) | 0 (0.0%) |
| Computers & Mathematics | 0 (0.0%) | 0 (0.0%) |
| Architecture & Engineering | 0 (0.0%) | 0 (0.0%) |
| Life, Physical & Social Science | 0 (0.0%) | 0 (0.0%) |
| Community & Social Service | 34 (30.1%) | 79 (69.9%) |
| Education, Arts & Media | 6 (100.0%) | 0 (0.0%) |
| Legal Services & Support | 0 (0.0%) | 0 (0.0%) |
| Education Instruction & Library | 6 (7.1%) | 79 (92.9%) |
| Arts, Media & Entertainment | 22 (100.0%) | 0 (0.0%) |
| Health Diagnosing & Treating | 11 (29.7%) | 26 (70.3%) |
| Health Technologists | 0 (0.0%) | 20 (100.0%) |
| Total (Category) | 104 (39.5%) | 159 (60.5%) |
| Total (Overall) | 780 (58.0%) | 566 (42.0%) |
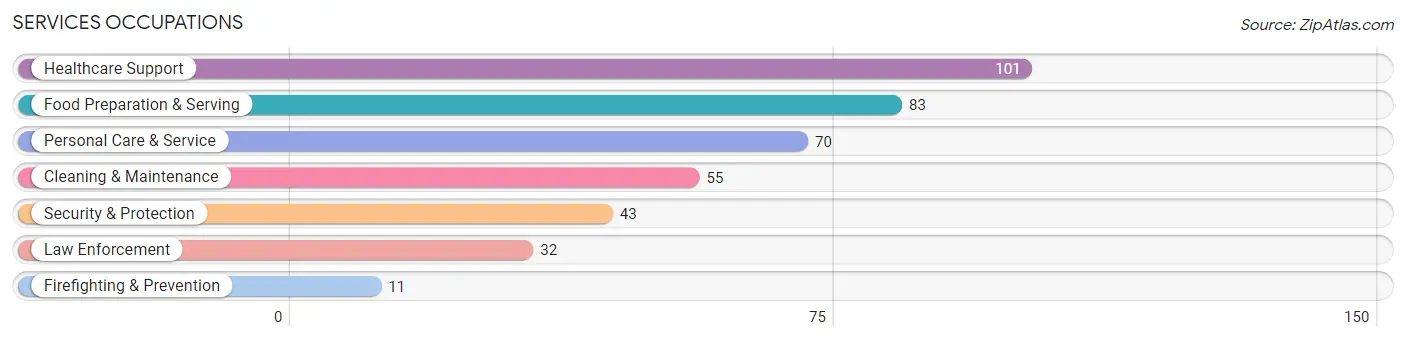
Services Occupations
The most common Services occupations in Shenandoah are Healthcare Support (101 | 7.5%), Food Preparation & Serving (83 | 6.2%), Personal Care & Service (70 | 5.2%), Cleaning & Maintenance (55 | 4.1%), and Security & Protection (43 | 3.2%).
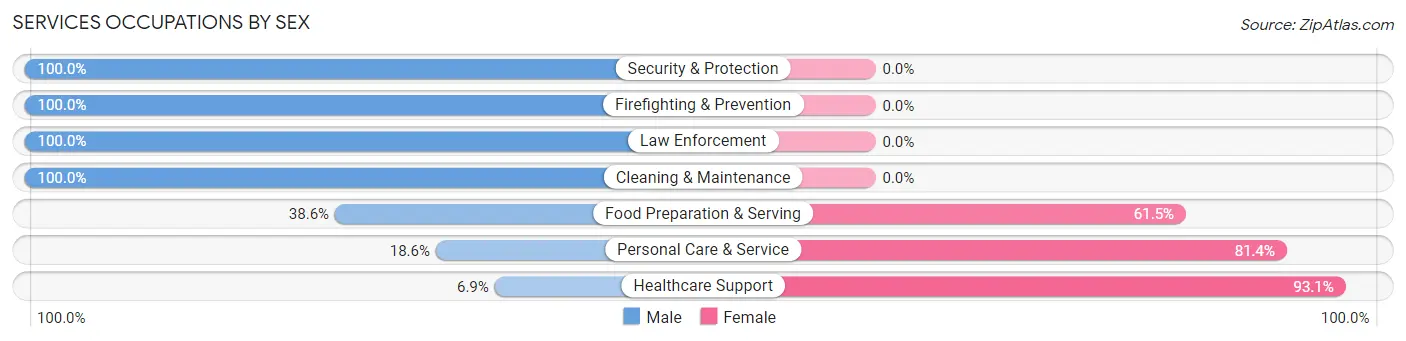
Services Occupations by Sex
Within the Services occupations in Shenandoah, the most male-oriented occupations are Security & Protection (100.0%), Firefighting & Prevention (100.0%), and Law Enforcement (100.0%), while the most female-oriented occupations are Healthcare Support (93.1%), Personal Care & Service (81.4%), and Food Preparation & Serving (61.5%).
| Occupation | Male | Female |
| Healthcare Support | 7 (6.9%) | 94 (93.1%) |
| Security & Protection | 43 (100.0%) | 0 (0.0%) |
| Firefighting & Prevention | 11 (100.0%) | 0 (0.0%) |
| Law Enforcement | 32 (100.0%) | 0 (0.0%) |
| Food Preparation & Serving | 32 (38.6%) | 51 (61.5%) |
| Cleaning & Maintenance | 55 (100.0%) | 0 (0.0%) |
| Personal Care & Service | 13 (18.6%) | 57 (81.4%) |
| Total (Category) | 150 (42.6%) | 202 (57.4%) |
| Total (Overall) | 780 (58.0%) | 566 (42.0%) |
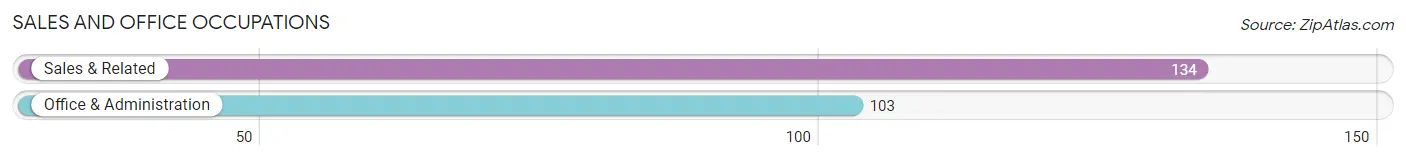
Sales and Office Occupations
The most common Sales and Office occupations in Shenandoah are Sales & Related (134 | 10.0%), and Office & Administration (103 | 7.6%).
Sales and Office Occupations by Sex
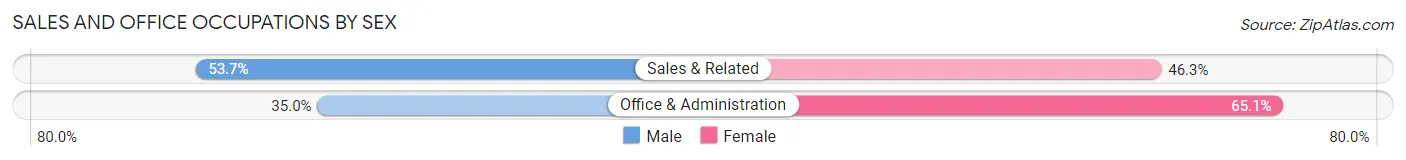
| Occupation | Male | Female |
| Sales & Related | 72 (53.7%) | 62 (46.3%) |
| Office & Administration | 36 (34.9%) | 67 (65.0%) |
| Total (Category) | 108 (45.6%) | 129 (54.4%) |
| Total (Overall) | 780 (58.0%) | 566 (42.0%) |
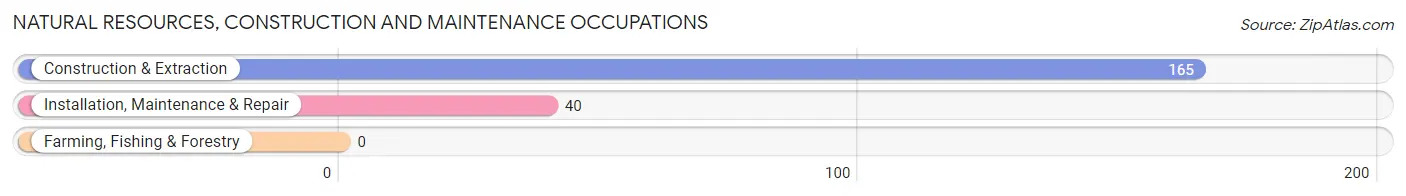
Natural Resources, Construction and Maintenance Occupations
The most common Natural Resources, Construction and Maintenance occupations in Shenandoah are Construction & Extraction (165 | 12.3%), and Installation, Maintenance & Repair (40 | 3.0%).
Natural Resources, Construction and Maintenance Occupations by Sex
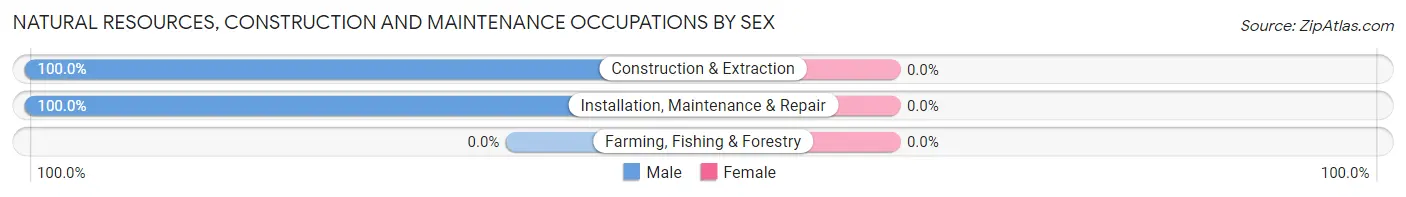
| Occupation | Male | Female |
| Farming, Fishing & Forestry | 0 (0.0%) | 0 (0.0%) |
| Construction & Extraction | 165 (100.0%) | 0 (0.0%) |
| Installation, Maintenance & Repair | 40 (100.0%) | 0 (0.0%) |
| Total (Category) | 205 (100.0%) | 0 (0.0%) |
| Total (Overall) | 780 (58.0%) | 566 (42.0%) |
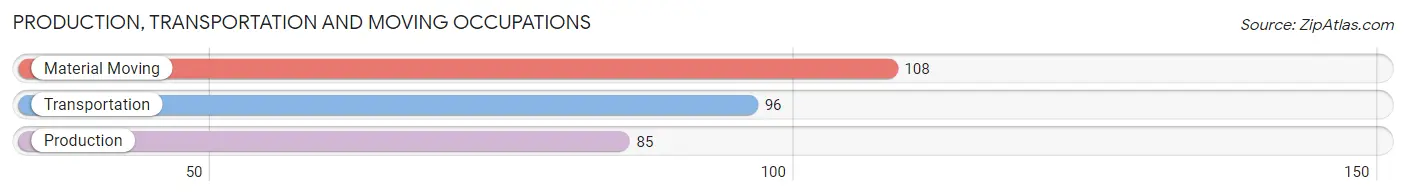
Production, Transportation and Moving Occupations
The most common Production, Transportation and Moving occupations in Shenandoah are Material Moving (108 | 8.0%), Transportation (96 | 7.1%), and Production (85 | 6.3%).
Production, Transportation and Moving Occupations by Sex
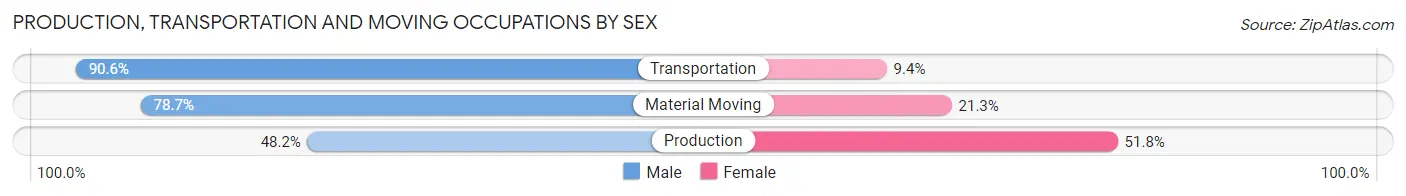
| Occupation | Male | Female |
| Production | 41 (48.2%) | 44 (51.8%) |
| Transportation | 87 (90.6%) | 9 (9.4%) |
| Material Moving | 85 (78.7%) | 23 (21.3%) |
| Total (Category) | 213 (73.7%) | 76 (26.3%) |
| Total (Overall) | 780 (58.0%) | 566 (42.0%) |
Employment Industries by Sex in Shenandoah
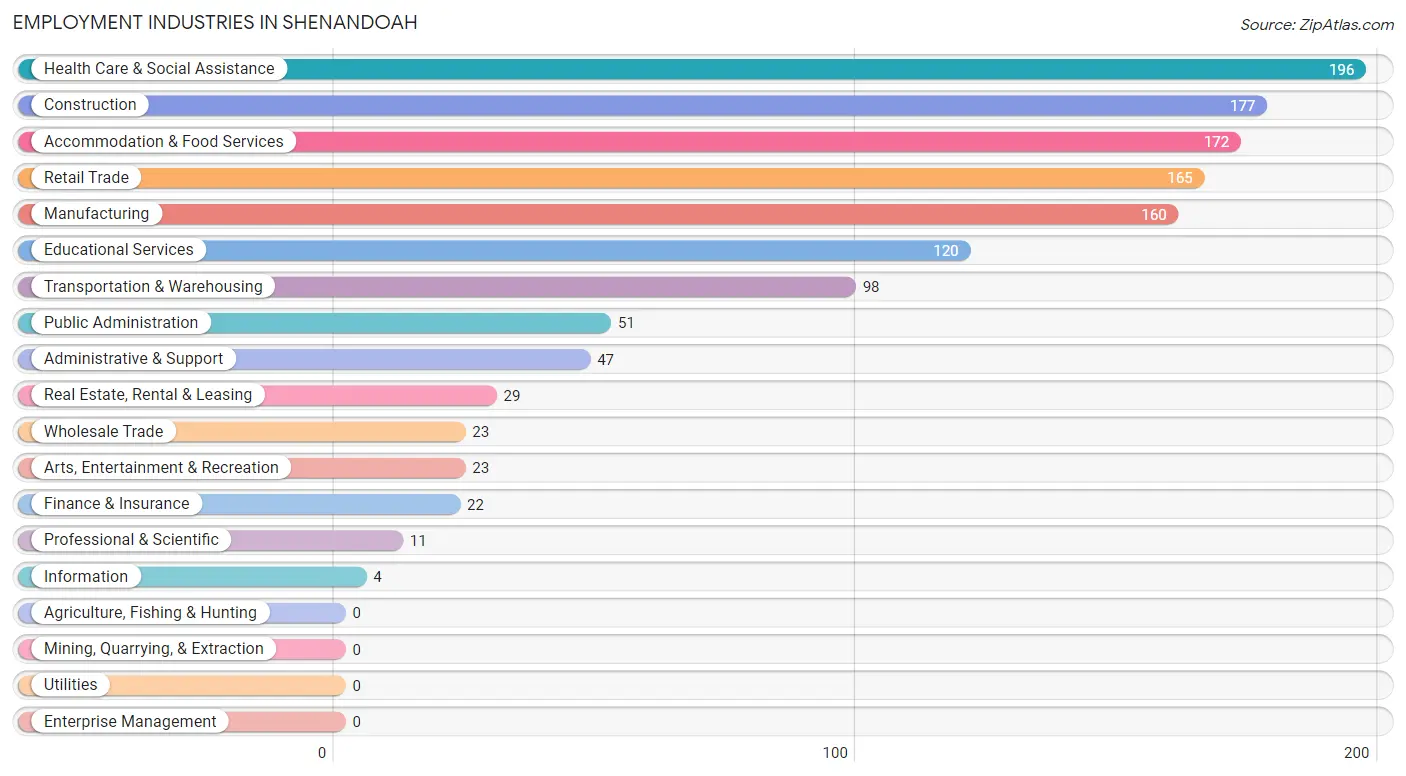
Employment Industries in Shenandoah
The major employment industries in Shenandoah include Health Care & Social Assistance (196 | 14.6%), Construction (177 | 13.2%), Accommodation & Food Services (172 | 12.8%), Retail Trade (165 | 12.3%), and Manufacturing (160 | 11.9%).
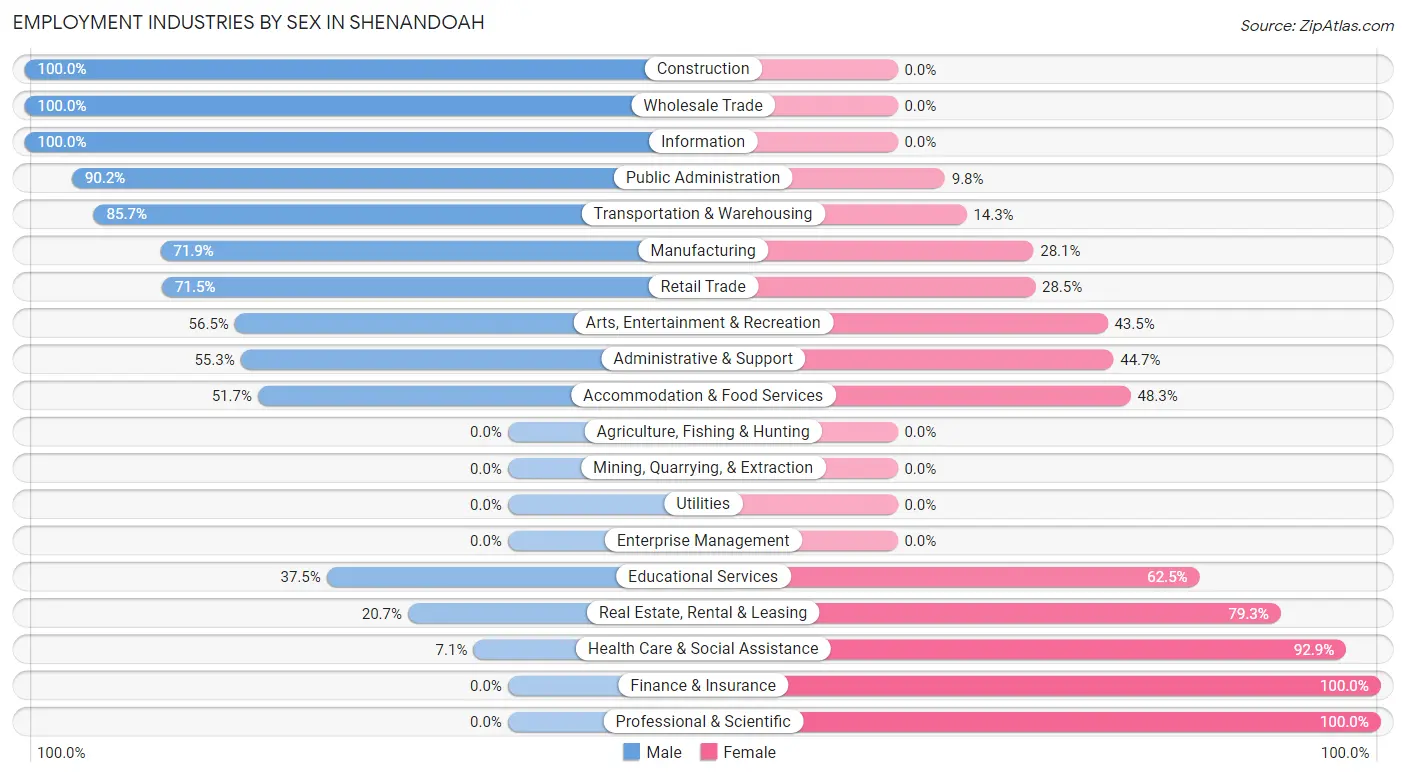
Employment Industries by Sex in Shenandoah
The Shenandoah industries that see more men than women are Construction (100.0%), Wholesale Trade (100.0%), and Information (100.0%), whereas the industries that tend to have a higher number of women are Finance & Insurance (100.0%), Professional & Scientific (100.0%), and Health Care & Social Assistance (92.9%).
| Industry | Male | Female |
| Agriculture, Fishing & Hunting | 0 (0.0%) | 0 (0.0%) |
| Mining, Quarrying, & Extraction | 0 (0.0%) | 0 (0.0%) |
| Construction | 177 (100.0%) | 0 (0.0%) |
| Manufacturing | 115 (71.9%) | 45 (28.1%) |
| Wholesale Trade | 23 (100.0%) | 0 (0.0%) |
| Retail Trade | 118 (71.5%) | 47 (28.5%) |
| Transportation & Warehousing | 84 (85.7%) | 14 (14.3%) |
| Utilities | 0 (0.0%) | 0 (0.0%) |
| Information | 4 (100.0%) | 0 (0.0%) |
| Finance & Insurance | 0 (0.0%) | 22 (100.0%) |
| Real Estate, Rental & Leasing | 6 (20.7%) | 23 (79.3%) |
| Professional & Scientific | 0 (0.0%) | 11 (100.0%) |
| Enterprise Management | 0 (0.0%) | 0 (0.0%) |
| Administrative & Support | 26 (55.3%) | 21 (44.7%) |
| Educational Services | 45 (37.5%) | 75 (62.5%) |
| Health Care & Social Assistance | 14 (7.1%) | 182 (92.9%) |
| Arts, Entertainment & Recreation | 13 (56.5%) | 10 (43.5%) |
| Accommodation & Food Services | 89 (51.7%) | 83 (48.3%) |
| Public Administration | 46 (90.2%) | 5 (9.8%) |
| Total | 780 (58.0%) | 566 (42.0%) |
Education in Shenandoah
School Enrollment in Shenandoah
The most common levels of schooling among the 913 students in Shenandoah are high school (339 | 37.1%), elementary school (216 | 23.7%), and middle school (193 | 21.1%).
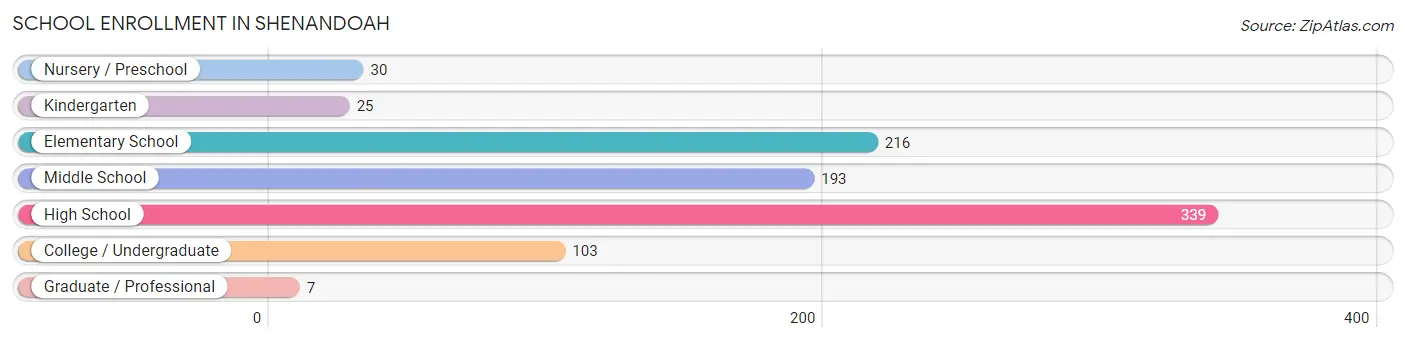
| School Level | # Students | % Students |
| Nursery / Preschool | 30 | 3.3% |
| Kindergarten | 25 | 2.7% |
| Elementary School | 216 | 23.7% |
| Middle School | 193 | 21.1% |
| High School | 339 | 37.1% |
| College / Undergraduate | 103 | 11.3% |
| Graduate / Professional | 7 | 0.8% |
| Total | 913 | 100.0% |
School Enrollment by Age by Funding Source in Shenandoah
Out of a total of 913 students who are enrolled in schools in Shenandoah, 95 (10.4%) attend a private institution, while the remaining 818 (89.6%) are enrolled in public schools. The age group of 3 to 4 year olds has the highest likelihood of being enrolled in private schools, with 21 (87.5% in the age bracket) enrolled. Conversely, the age group of 5 to 9 year old has the lowest likelihood of being enrolled in a private school, with 209 (100.0% in the age bracket) attending a public institution.
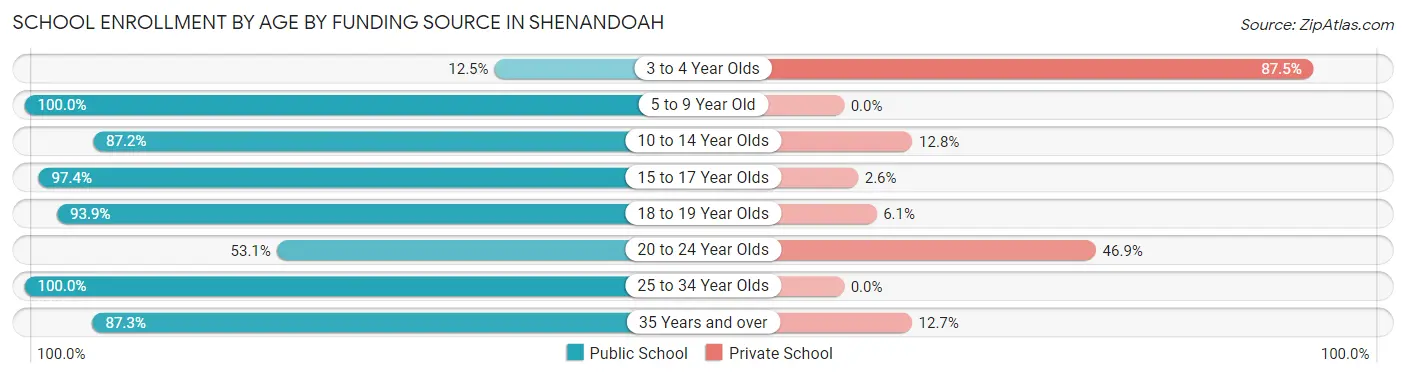
| Age Bracket | Public School | Private School |
| 3 to 4 Year Olds | 3 (12.5%) | 21 (87.5%) |
| 5 to 9 Year Old | 209 (100.0%) | 0 (0.0%) |
| 10 to 14 Year Olds | 212 (87.2%) | 31 (12.8%) |
| 15 to 17 Year Olds | 222 (97.4%) | 6 (2.6%) |
| 18 to 19 Year Olds | 62 (93.9%) | 4 (6.1%) |
| 20 to 24 Year Olds | 26 (53.1%) | 23 (46.9%) |
| 25 to 34 Year Olds | 15 (100.0%) | 0 (0.0%) |
| 35 Years and over | 69 (87.3%) | 10 (12.7%) |
| Total | 818 (89.6%) | 95 (10.4%) |
Educational Attainment by Field of Study in Shenandoah
Education (38 | 26.0%), business (35 | 24.0%), social sciences (31 | 21.2%), liberal arts & history (14 | 9.6%), and science & technology (11 | 7.5%) are the most common fields of study among 146 individuals in Shenandoah who have obtained a bachelor's degree or higher.
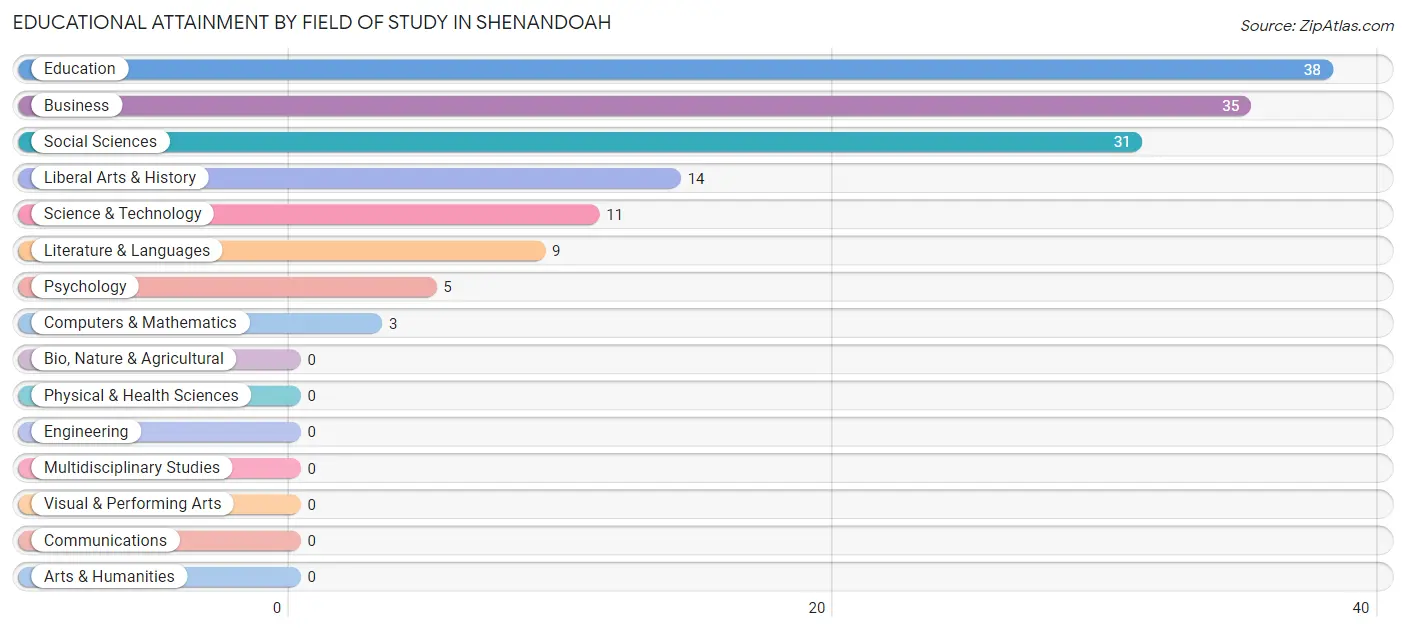
| Field of Study | # Graduates | % Graduates |
| Computers & Mathematics | 3 | 2.1% |
| Bio, Nature & Agricultural | 0 | 0.0% |
| Physical & Health Sciences | 0 | 0.0% |
| Psychology | 5 | 3.4% |
| Social Sciences | 31 | 21.2% |
| Engineering | 0 | 0.0% |
| Multidisciplinary Studies | 0 | 0.0% |
| Science & Technology | 11 | 7.5% |
| Business | 35 | 24.0% |
| Education | 38 | 26.0% |
| Literature & Languages | 9 | 6.2% |
| Liberal Arts & History | 14 | 9.6% |
| Visual & Performing Arts | 0 | 0.0% |
| Communications | 0 | 0.0% |
| Arts & Humanities | 0 | 0.0% |
| Total | 146 | 100.0% |
Transportation & Commute in Shenandoah
Vehicle Availability by Sex in Shenandoah
The most prevalent vehicle ownership categories in Shenandoah are males with 2 vehicles (235, accounting for 31.3%) and females with 2 vehicles (165, making up 50.8%).
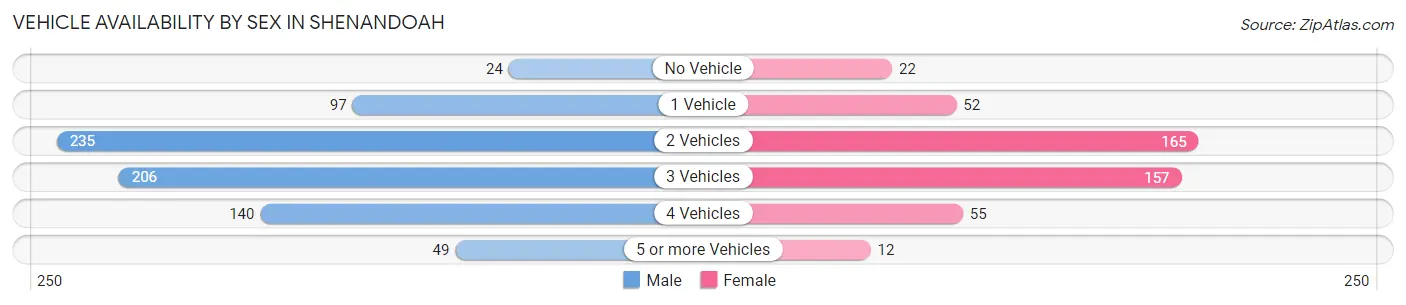
| Vehicles Available | Male | Female |
| No Vehicle | 24 (3.2%) | 22 (4.8%) |
| 1 Vehicle | 97 (12.9%) | 52 (11.2%) |
| 2 Vehicles | 235 (31.3%) | 165 (35.6%) |
| 3 Vehicles | 206 (27.4%) | 157 (33.9%) |
| 4 Vehicles | 140 (18.6%) | 55 (11.9%) |
| 5 or more Vehicles | 49 (6.5%) | 12 (2.6%) |
| Total | 751 (100.0%) | 463 (100.0%) |
Commute Time in Shenandoah
The most frequently occuring commute durations in Shenandoah are 30 to 34 minutes (218 commuters, 18.4%), 20 to 24 minutes (152 commuters, 12.9%), and 45 to 59 minutes (149 commuters, 12.6%).
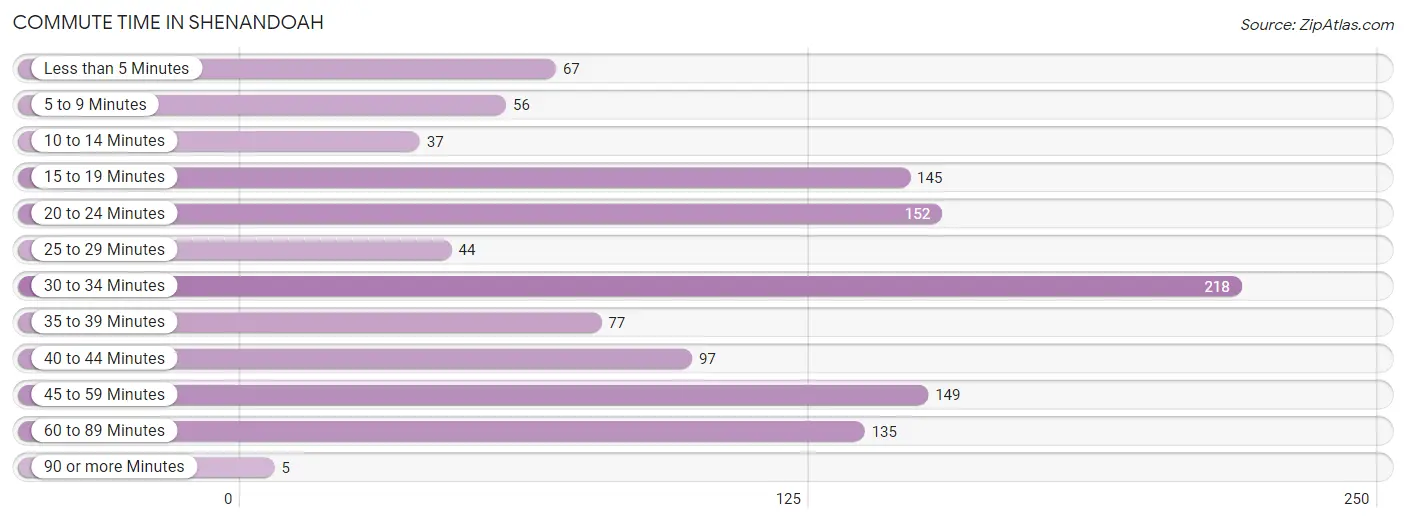
| Commute Time | # Commuters | % Commuters |
| Less than 5 Minutes | 67 | 5.7% |
| 5 to 9 Minutes | 56 | 4.7% |
| 10 to 14 Minutes | 37 | 3.1% |
| 15 to 19 Minutes | 145 | 12.3% |
| 20 to 24 Minutes | 152 | 12.9% |
| 25 to 29 Minutes | 44 | 3.7% |
| 30 to 34 Minutes | 218 | 18.4% |
| 35 to 39 Minutes | 77 | 6.5% |
| 40 to 44 Minutes | 97 | 8.2% |
| 45 to 59 Minutes | 149 | 12.6% |
| 60 to 89 Minutes | 135 | 11.4% |
| 90 or more Minutes | 5 | 0.4% |
Commute Time by Sex in Shenandoah
The most common commute times in Shenandoah are 30 to 34 minutes (162 commuters, 21.8%) for males and 30 to 34 minutes (56 commuters, 12.7%) for females.
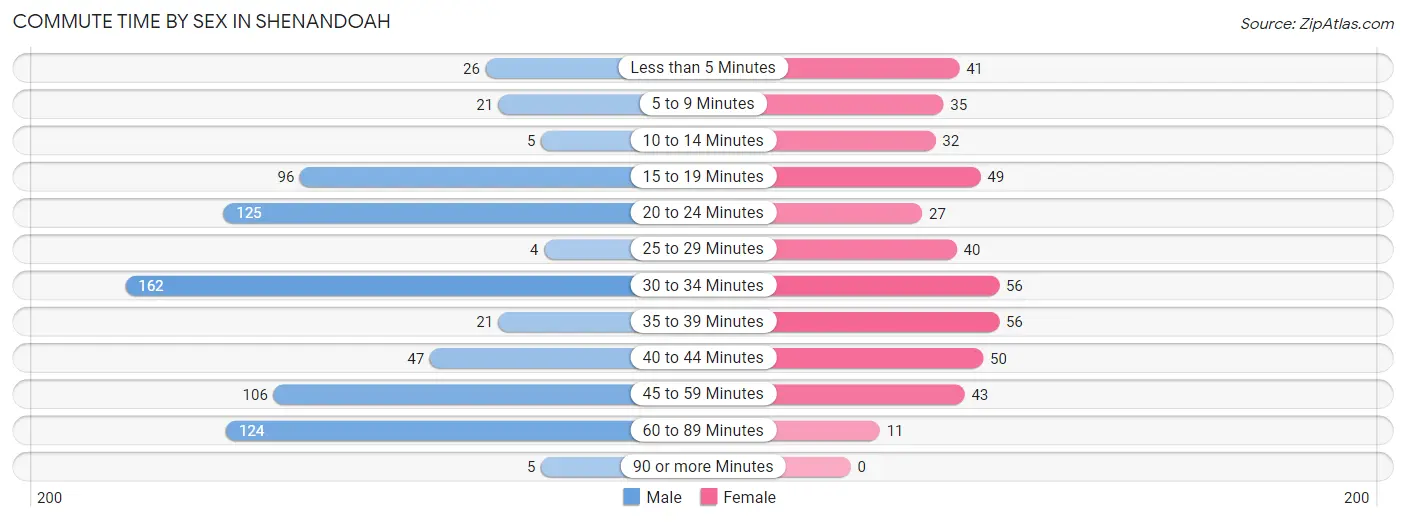
| Commute Time | Male | Female |
| Less than 5 Minutes | 26 (3.5%) | 41 (9.3%) |
| 5 to 9 Minutes | 21 (2.8%) | 35 (8.0%) |
| 10 to 14 Minutes | 5 (0.7%) | 32 (7.3%) |
| 15 to 19 Minutes | 96 (12.9%) | 49 (11.1%) |
| 20 to 24 Minutes | 125 (16.9%) | 27 (6.1%) |
| 25 to 29 Minutes | 4 (0.5%) | 40 (9.1%) |
| 30 to 34 Minutes | 162 (21.8%) | 56 (12.7%) |
| 35 to 39 Minutes | 21 (2.8%) | 56 (12.7%) |
| 40 to 44 Minutes | 47 (6.3%) | 50 (11.4%) |
| 45 to 59 Minutes | 106 (14.3%) | 43 (9.8%) |
| 60 to 89 Minutes | 124 (16.7%) | 11 (2.5%) |
| 90 or more Minutes | 5 (0.7%) | 0 (0.0%) |
Time of Departure to Work by Sex in Shenandoah
The most frequent times of departure to work in Shenandoah are 5:00 AM to 5:29 AM (122, 16.4%) for males and 7:00 AM to 7:29 AM (90, 20.4%) for females.
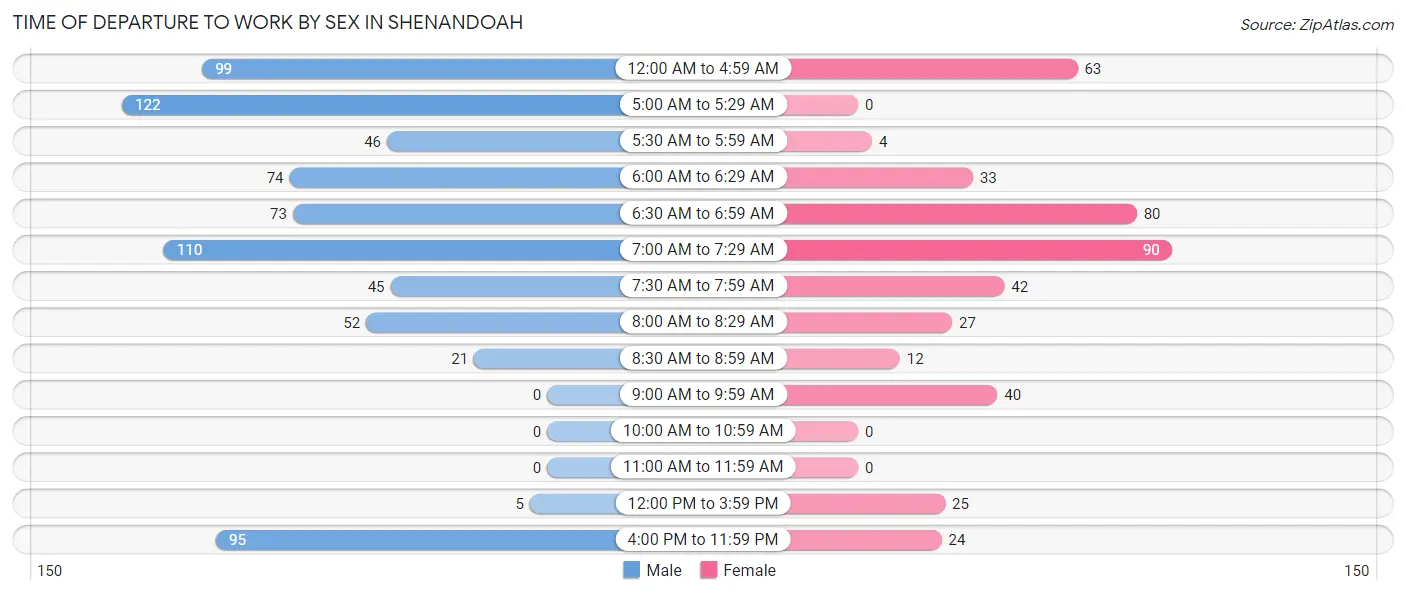
| Time of Departure | Male | Female |
| 12:00 AM to 4:59 AM | 99 (13.3%) | 63 (14.3%) |
| 5:00 AM to 5:29 AM | 122 (16.4%) | 0 (0.0%) |
| 5:30 AM to 5:59 AM | 46 (6.2%) | 4 (0.9%) |
| 6:00 AM to 6:29 AM | 74 (10.0%) | 33 (7.5%) |
| 6:30 AM to 6:59 AM | 73 (9.8%) | 80 (18.2%) |
| 7:00 AM to 7:29 AM | 110 (14.8%) | 90 (20.4%) |
| 7:30 AM to 7:59 AM | 45 (6.1%) | 42 (9.6%) |
| 8:00 AM to 8:29 AM | 52 (7.0%) | 27 (6.1%) |
| 8:30 AM to 8:59 AM | 21 (2.8%) | 12 (2.7%) |
| 9:00 AM to 9:59 AM | 0 (0.0%) | 40 (9.1%) |
| 10:00 AM to 10:59 AM | 0 (0.0%) | 0 (0.0%) |
| 11:00 AM to 11:59 AM | 0 (0.0%) | 0 (0.0%) |
| 12:00 PM to 3:59 PM | 5 (0.7%) | 25 (5.7%) |
| 4:00 PM to 11:59 PM | 95 (12.8%) | 24 (5.4%) |
| Total | 742 (100.0%) | 440 (100.0%) |
Housing Occupancy in Shenandoah
Occupancy by Ownership in Shenandoah
Of the total 976 dwellings in Shenandoah, owner-occupied units account for 706 (72.3%), while renter-occupied units make up 270 (27.7%).
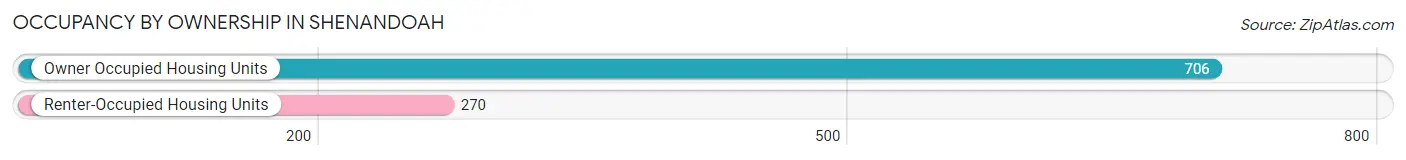
| Occupancy | # Housing Units | % Housing Units |
| Owner Occupied Housing Units | 706 | 72.3% |
| Renter-Occupied Housing Units | 270 | 27.7% |
| Total Occupied Housing Units | 976 | 100.0% |
Occupancy by Household Size in Shenandoah
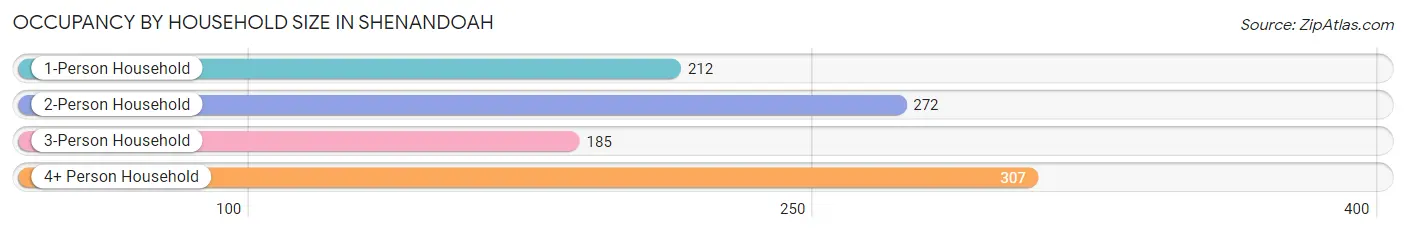
| Household Size | # Housing Units | % Housing Units |
| 1-Person Household | 212 | 21.7% |
| 2-Person Household | 272 | 27.9% |
| 3-Person Household | 185 | 19.0% |
| 4+ Person Household | 307 | 31.5% |
| Total Housing Units | 976 | 100.0% |
Occupancy by Ownership by Household Size in Shenandoah
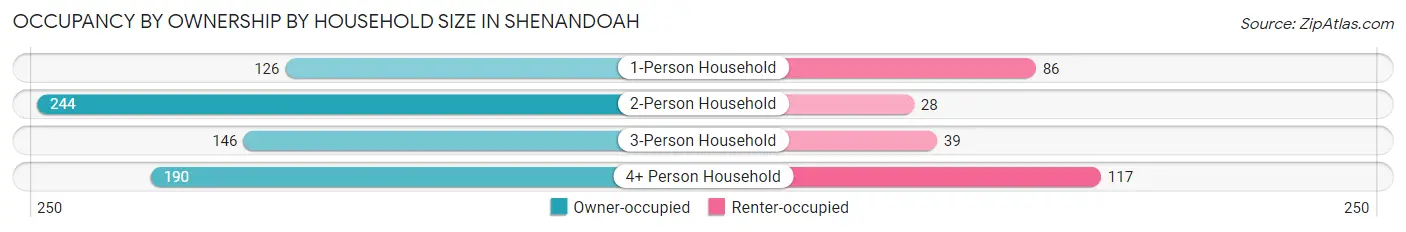
| Household Size | Owner-occupied | Renter-occupied |
| 1-Person Household | 126 (59.4%) | 86 (40.6%) |
| 2-Person Household | 244 (89.7%) | 28 (10.3%) |
| 3-Person Household | 146 (78.9%) | 39 (21.1%) |
| 4+ Person Household | 190 (61.9%) | 117 (38.1%) |
| Total Housing Units | 706 (72.3%) | 270 (27.7%) |
Occupancy by Educational Attainment in Shenandoah
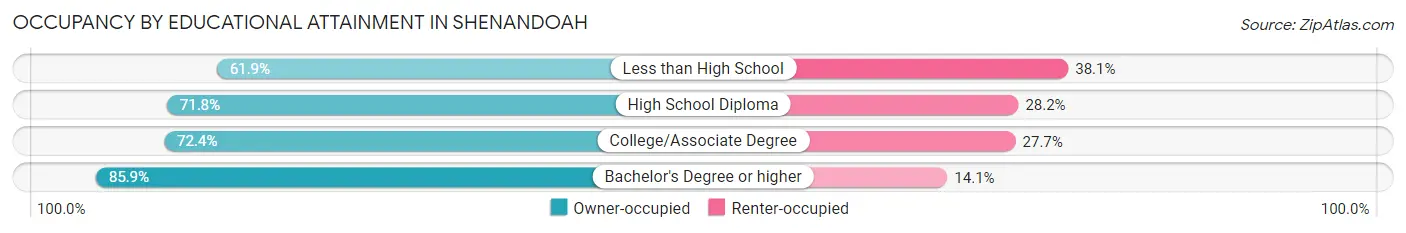
| Household Size | Owner-occupied | Renter-occupied |
| Less than High School | 52 (61.9%) | 32 (38.1%) |
| High School Diploma | 369 (71.8%) | 145 (28.2%) |
| College/Associate Degree | 212 (72.4%) | 81 (27.7%) |
| Bachelor's Degree or higher | 73 (85.9%) | 12 (14.1%) |
Occupancy by Age of Householder in Shenandoah
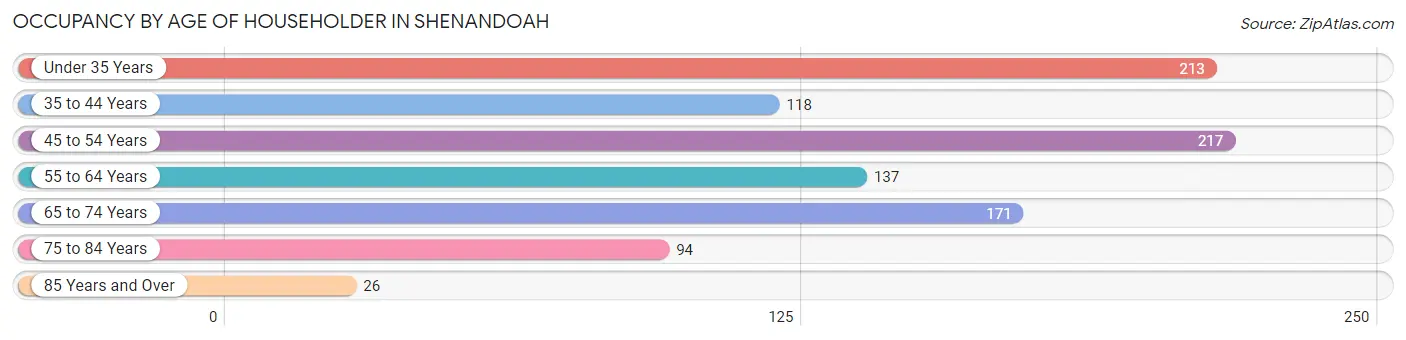
| Age Bracket | # Households | % Households |
| Under 35 Years | 213 | 21.8% |
| 35 to 44 Years | 118 | 12.1% |
| 45 to 54 Years | 217 | 22.2% |
| 55 to 64 Years | 137 | 14.0% |
| 65 to 74 Years | 171 | 17.5% |
| 75 to 84 Years | 94 | 9.6% |
| 85 Years and Over | 26 | 2.7% |
| Total | 976 | 100.0% |
Housing Finances in Shenandoah
Median Income by Occupancy in Shenandoah
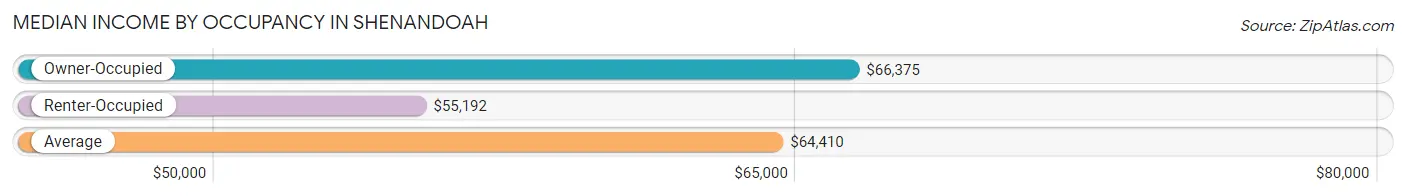
| Occupancy Type | # Households | Median Income |
| Owner-Occupied | 706 (72.3%) | $66,375 |
| Renter-Occupied | 270 (27.7%) | $55,192 |
| Average | 976 (100.0%) | $64,410 |
Occupancy by Householder Income Bracket in Shenandoah
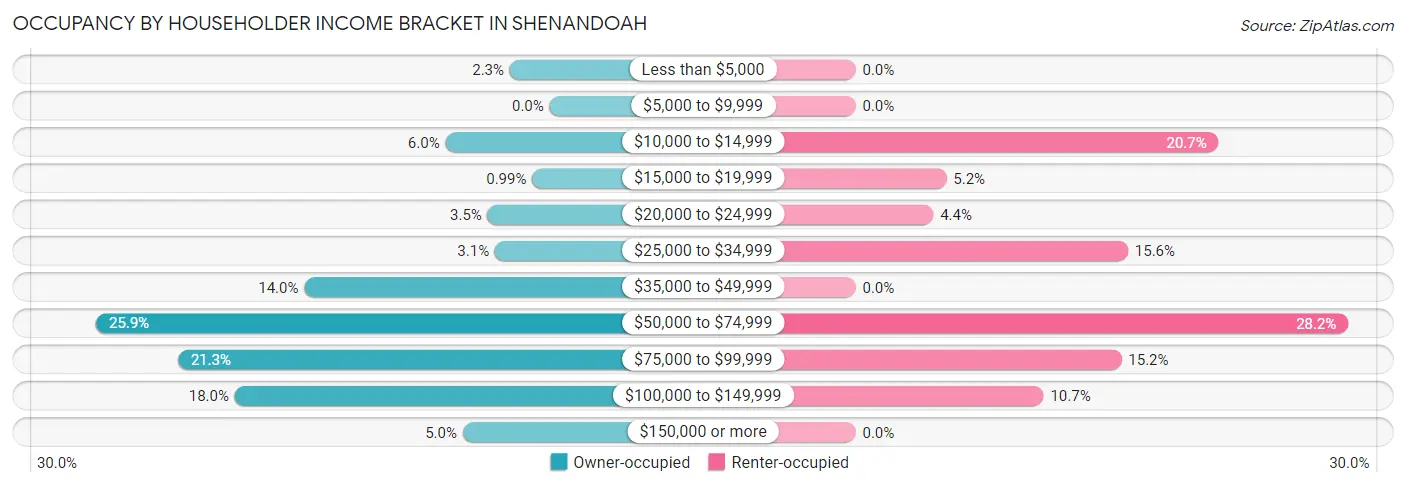
| Income Bracket | Owner-occupied | Renter-occupied |
| Less than $5,000 | 16 (2.3%) | 0 (0.0%) |
| $5,000 to $9,999 | 0 (0.0%) | 0 (0.0%) |
| $10,000 to $14,999 | 42 (5.9%) | 56 (20.7%) |
| $15,000 to $19,999 | 7 (1.0%) | 14 (5.2%) |
| $20,000 to $24,999 | 25 (3.5%) | 12 (4.4%) |
| $25,000 to $34,999 | 22 (3.1%) | 42 (15.6%) |
| $35,000 to $49,999 | 99 (14.0%) | 0 (0.0%) |
| $50,000 to $74,999 | 183 (25.9%) | 76 (28.1%) |
| $75,000 to $99,999 | 150 (21.2%) | 41 (15.2%) |
| $100,000 to $149,999 | 127 (18.0%) | 29 (10.7%) |
| $150,000 or more | 35 (5.0%) | 0 (0.0%) |
| Total | 706 (100.0%) | 270 (100.0%) |
Monthly Housing Cost Tiers in Shenandoah
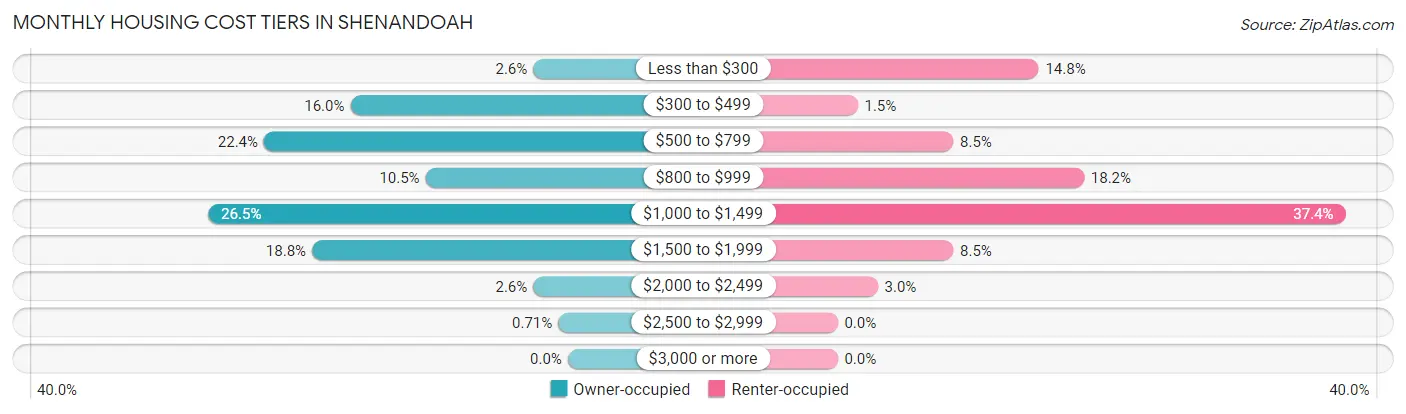
| Monthly Cost | Owner-occupied | Renter-occupied |
| Less than $300 | 18 (2.5%) | 40 (14.8%) |
| $300 to $499 | 113 (16.0%) | 4 (1.5%) |
| $500 to $799 | 158 (22.4%) | 23 (8.5%) |
| $800 to $999 | 74 (10.5%) | 49 (18.1%) |
| $1,000 to $1,499 | 187 (26.5%) | 101 (37.4%) |
| $1,500 to $1,999 | 133 (18.8%) | 23 (8.5%) |
| $2,000 to $2,499 | 18 (2.5%) | 8 (3.0%) |
| $2,500 to $2,999 | 5 (0.7%) | 0 (0.0%) |
| $3,000 or more | 0 (0.0%) | 0 (0.0%) |
| Total | 706 (100.0%) | 270 (100.0%) |
Physical Housing Characteristics in Shenandoah
Housing Structures in Shenandoah
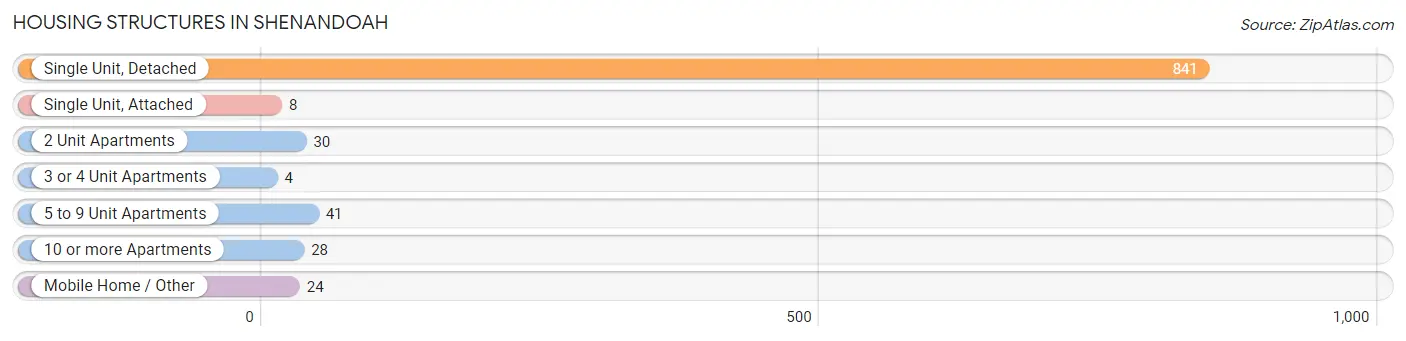
| Structure Type | # Housing Units | % Housing Units |
| Single Unit, Detached | 841 | 86.2% |
| Single Unit, Attached | 8 | 0.8% |
| 2 Unit Apartments | 30 | 3.1% |
| 3 or 4 Unit Apartments | 4 | 0.4% |
| 5 to 9 Unit Apartments | 41 | 4.2% |
| 10 or more Apartments | 28 | 2.9% |
| Mobile Home / Other | 24 | 2.5% |
| Total | 976 | 100.0% |
Housing Structures by Occupancy in Shenandoah
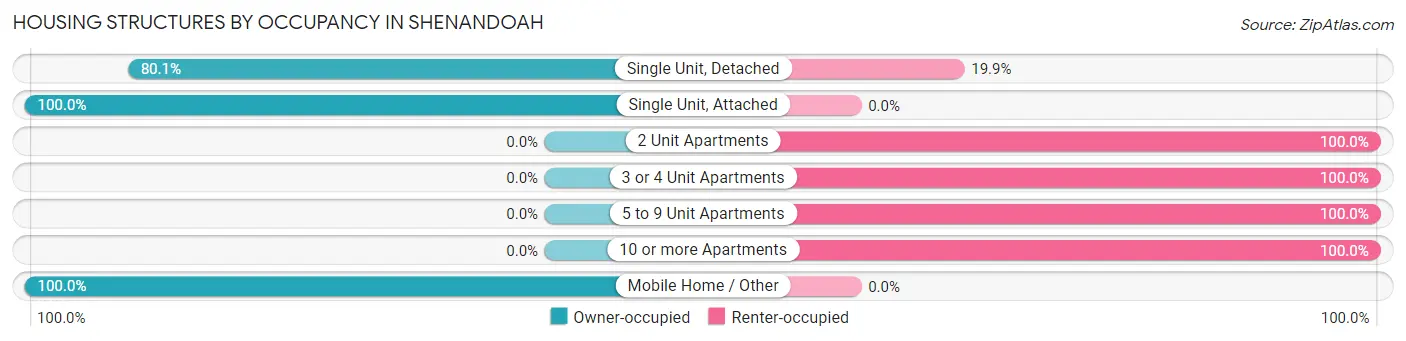
| Structure Type | Owner-occupied | Renter-occupied |
| Single Unit, Detached | 674 (80.1%) | 167 (19.9%) |
| Single Unit, Attached | 8 (100.0%) | 0 (0.0%) |
| 2 Unit Apartments | 0 (0.0%) | 30 (100.0%) |
| 3 or 4 Unit Apartments | 0 (0.0%) | 4 (100.0%) |
| 5 to 9 Unit Apartments | 0 (0.0%) | 41 (100.0%) |
| 10 or more Apartments | 0 (0.0%) | 28 (100.0%) |
| Mobile Home / Other | 24 (100.0%) | 0 (0.0%) |
| Total | 706 (72.3%) | 270 (27.7%) |
Housing Structures by Number of Rooms in Shenandoah
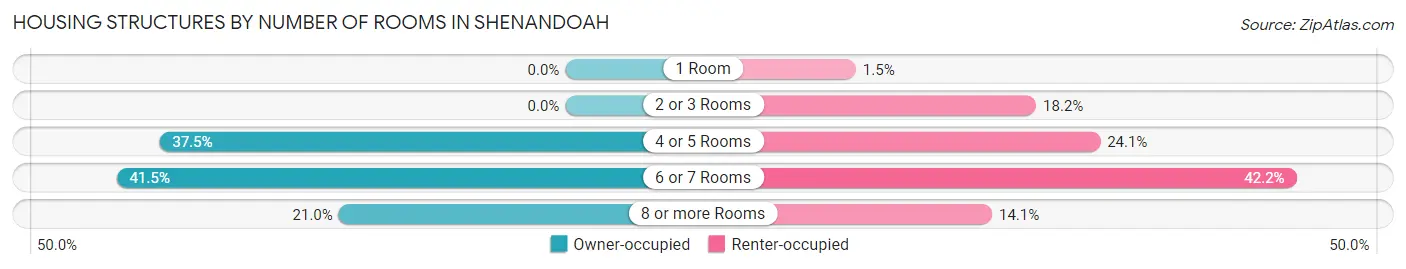
| Number of Rooms | Owner-occupied | Renter-occupied |
| 1 Room | 0 (0.0%) | 4 (1.5%) |
| 2 or 3 Rooms | 0 (0.0%) | 49 (18.1%) |
| 4 or 5 Rooms | 265 (37.5%) | 65 (24.1%) |
| 6 or 7 Rooms | 293 (41.5%) | 114 (42.2%) |
| 8 or more Rooms | 148 (21.0%) | 38 (14.1%) |
| Total | 706 (100.0%) | 270 (100.0%) |
Housing Structure by Heating Type in Shenandoah
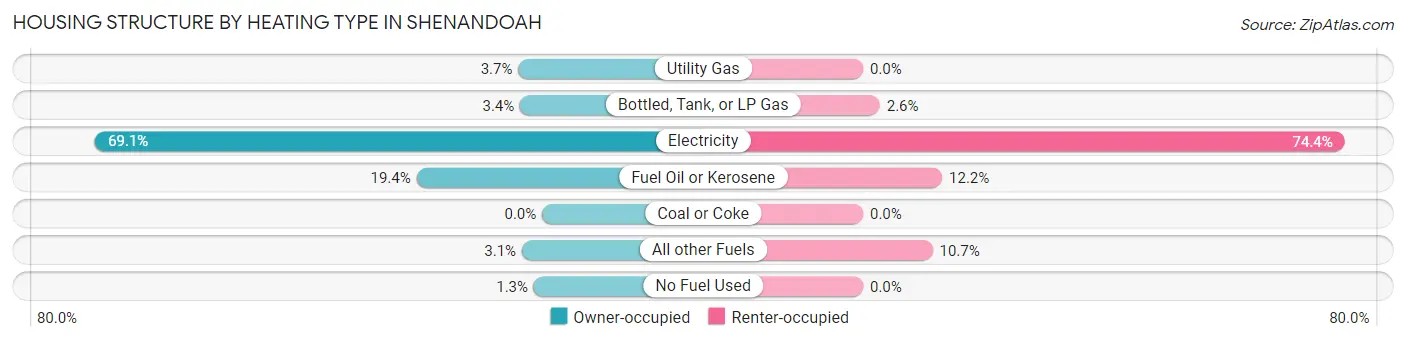
| Heating Type | Owner-occupied | Renter-occupied |
| Utility Gas | 26 (3.7%) | 0 (0.0%) |
| Bottled, Tank, or LP Gas | 24 (3.4%) | 7 (2.6%) |
| Electricity | 488 (69.1%) | 201 (74.4%) |
| Fuel Oil or Kerosene | 137 (19.4%) | 33 (12.2%) |
| Coal or Coke | 0 (0.0%) | 0 (0.0%) |
| All other Fuels | 22 (3.1%) | 29 (10.7%) |
| No Fuel Used | 9 (1.3%) | 0 (0.0%) |
| Total | 706 (100.0%) | 270 (100.0%) |
Household Vehicle Usage in Shenandoah
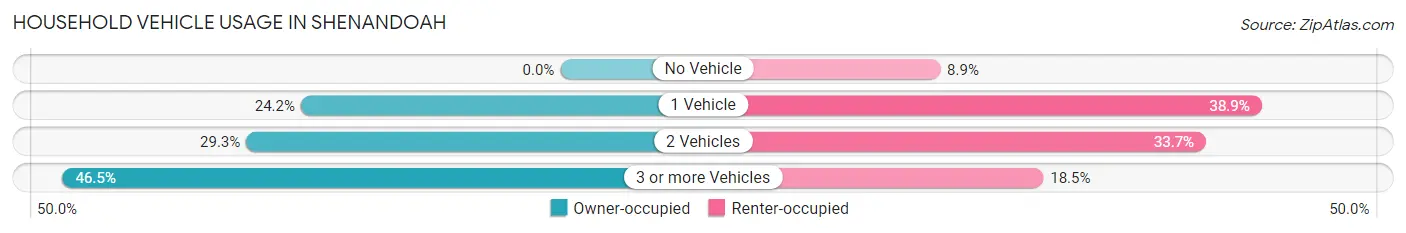
| Vehicles per Household | Owner-occupied | Renter-occupied |
| No Vehicle | 0 (0.0%) | 24 (8.9%) |
| 1 Vehicle | 171 (24.2%) | 105 (38.9%) |
| 2 Vehicles | 207 (29.3%) | 91 (33.7%) |
| 3 or more Vehicles | 328 (46.5%) | 50 (18.5%) |
| Total | 706 (100.0%) | 270 (100.0%) |
Real Estate & Mortgages in Shenandoah
Real Estate and Mortgage Overview in Shenandoah
| Characteristic | Without Mortgage | With Mortgage |
| Housing Units | 271 | 435 |
| Median Property Value | $163,500 | $181,800 |
| Median Household Income | $61,719 | $35 |
| Monthly Housing Costs | $507 | $0 |
| Real Estate Taxes | $1,407 | $43 |
Property Value by Mortgage Status in Shenandoah
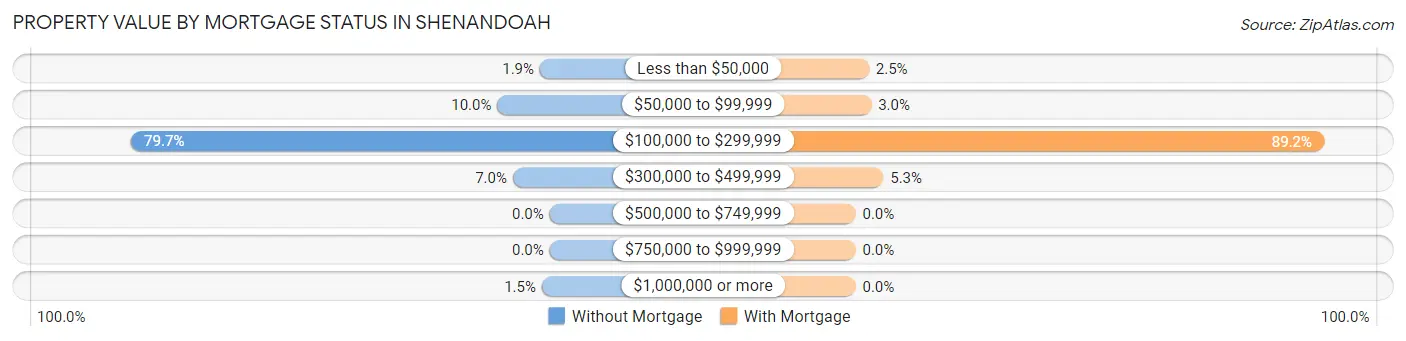
| Property Value | Without Mortgage | With Mortgage |
| Less than $50,000 | 5 (1.8%) | 11 (2.5%) |
| $50,000 to $99,999 | 27 (10.0%) | 13 (3.0%) |
| $100,000 to $299,999 | 216 (79.7%) | 388 (89.2%) |
| $300,000 to $499,999 | 19 (7.0%) | 23 (5.3%) |
| $500,000 to $749,999 | 0 (0.0%) | 0 (0.0%) |
| $750,000 to $999,999 | 0 (0.0%) | 0 (0.0%) |
| $1,000,000 or more | 4 (1.5%) | 0 (0.0%) |
| Total | 271 (100.0%) | 435 (100.0%) |
Household Income by Mortgage Status in Shenandoah
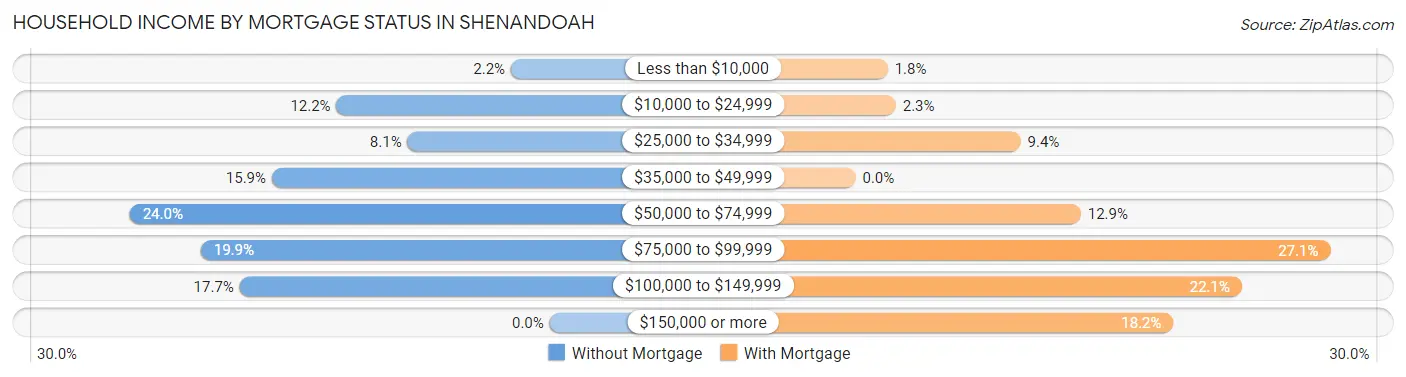
| Household Income | Without Mortgage | With Mortgage |
| Less than $10,000 | 6 (2.2%) | 8 (1.8%) |
| $10,000 to $24,999 | 33 (12.2%) | 10 (2.3%) |
| $25,000 to $34,999 | 22 (8.1%) | 41 (9.4%) |
| $35,000 to $49,999 | 43 (15.9%) | 0 (0.0%) |
| $50,000 to $74,999 | 65 (24.0%) | 56 (12.9%) |
| $75,000 to $99,999 | 54 (19.9%) | 118 (27.1%) |
| $100,000 to $149,999 | 48 (17.7%) | 96 (22.1%) |
| $150,000 or more | 0 (0.0%) | 79 (18.2%) |
| Total | 271 (100.0%) | 435 (100.0%) |
Property Value to Household Income Ratio in Shenandoah
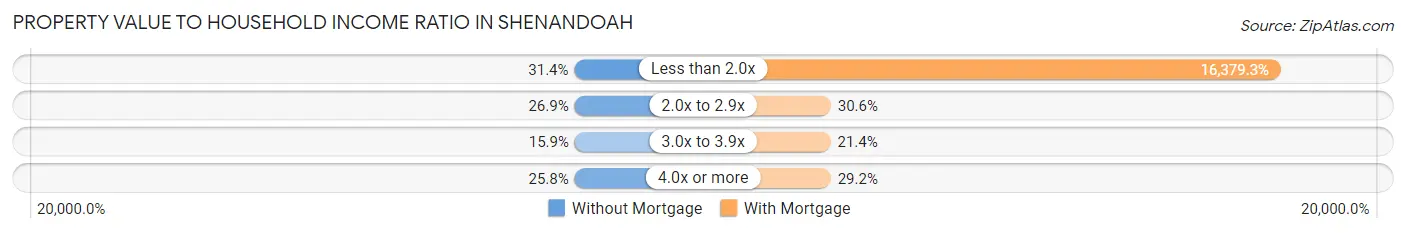
| Value-to-Income Ratio | Without Mortgage | With Mortgage |
| Less than 2.0x | 85 (31.4%) | 71,250 (16,379.3%) |
| 2.0x to 2.9x | 73 (26.9%) | 133 (30.6%) |
| 3.0x to 3.9x | 43 (15.9%) | 93 (21.4%) |
| 4.0x or more | 70 (25.8%) | 127 (29.2%) |
| Total | 271 (100.0%) | 435 (100.0%) |
Real Estate Taxes by Mortgage Status in Shenandoah
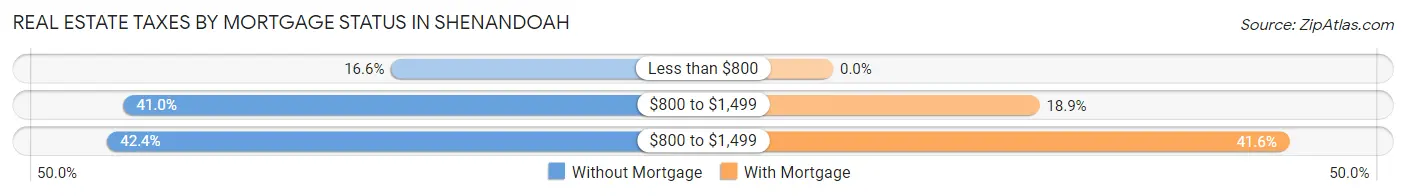
| Property Taxes | Without Mortgage | With Mortgage |
| Less than $800 | 45 (16.6%) | 0 (0.0%) |
| $800 to $1,499 | 111 (41.0%) | 82 (18.9%) |
| $800 to $1,499 | 115 (42.4%) | 181 (41.6%) |
| Total | 271 (100.0%) | 435 (100.0%) |
Health & Disability in Shenandoah
Health Insurance Coverage by Age in Shenandoah
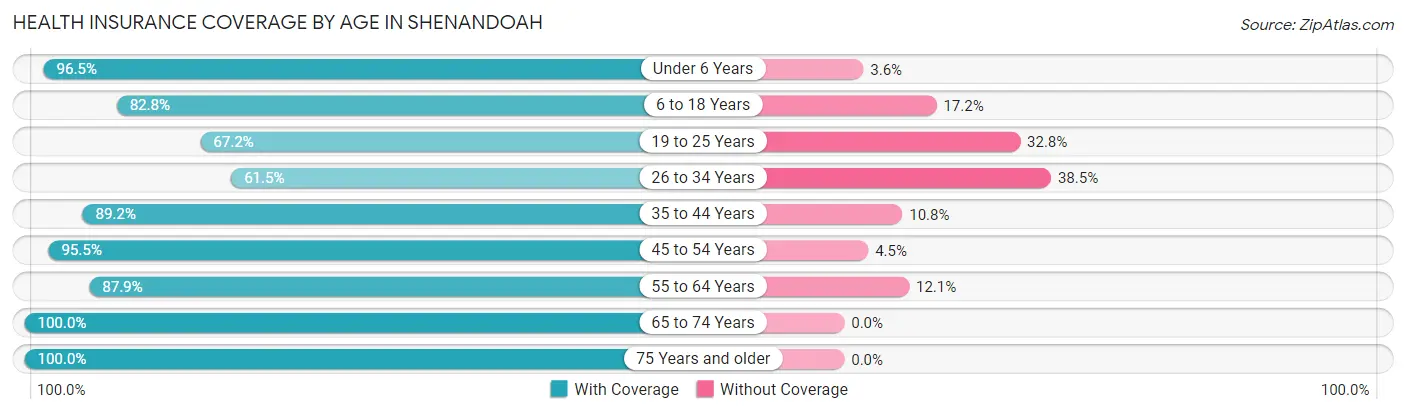
| Age Bracket | With Coverage | Without Coverage |
| Under 6 Years | 163 (96.5%) | 6 (3.5%) |
| 6 to 18 Years | 612 (82.8%) | 127 (17.2%) |
| 19 to 25 Years | 166 (67.2%) | 81 (32.8%) |
| 26 to 34 Years | 236 (61.5%) | 148 (38.5%) |
| 35 to 44 Years | 379 (89.2%) | 46 (10.8%) |
| 45 to 54 Years | 343 (95.5%) | 16 (4.5%) |
| 55 to 64 Years | 182 (87.9%) | 25 (12.1%) |
| 65 to 74 Years | 295 (100.0%) | 0 (0.0%) |
| 75 Years and older | 195 (100.0%) | 0 (0.0%) |
| Total | 2,571 (85.1%) | 449 (14.9%) |
Health Insurance Coverage by Citizenship Status in Shenandoah
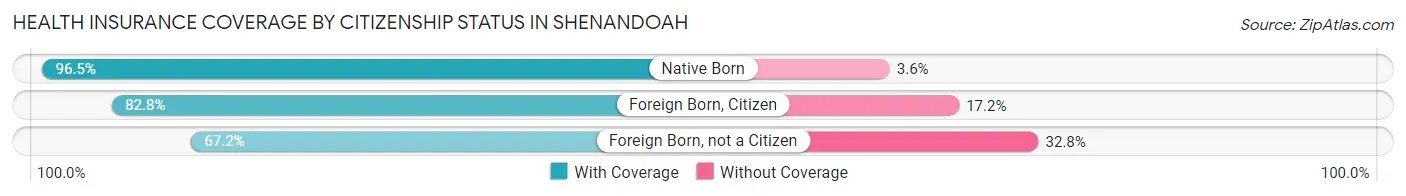
| Citizenship Status | With Coverage | Without Coverage |
| Native Born | 163 (96.5%) | 6 (3.5%) |
| Foreign Born, Citizen | 612 (82.8%) | 127 (17.2%) |
| Foreign Born, not a Citizen | 166 (67.2%) | 81 (32.8%) |
Health Insurance Coverage by Household Income in Shenandoah
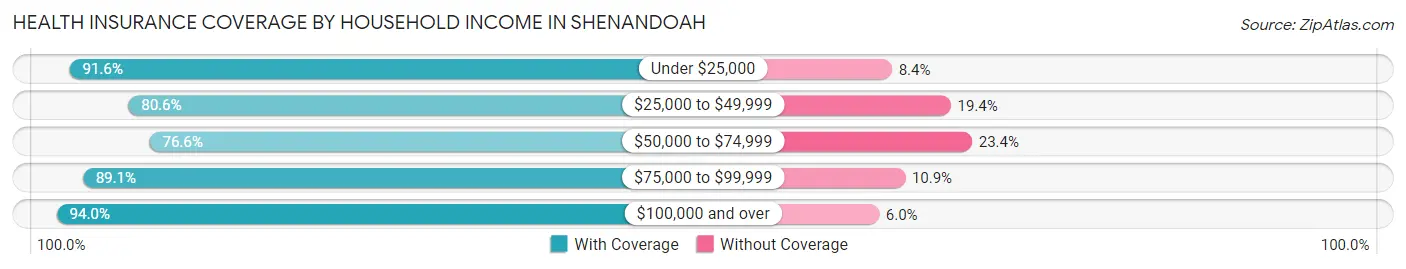
| Household Income | With Coverage | Without Coverage |
| Under $25,000 | 272 (91.6%) | 25 (8.4%) |
| $25,000 to $49,999 | 464 (80.6%) | 112 (19.4%) |
| $50,000 to $74,999 | 667 (76.6%) | 204 (23.4%) |
| $75,000 to $99,999 | 573 (89.1%) | 70 (10.9%) |
| $100,000 and over | 595 (94.0%) | 38 (6.0%) |
Public vs Private Health Insurance Coverage by Age in Shenandoah
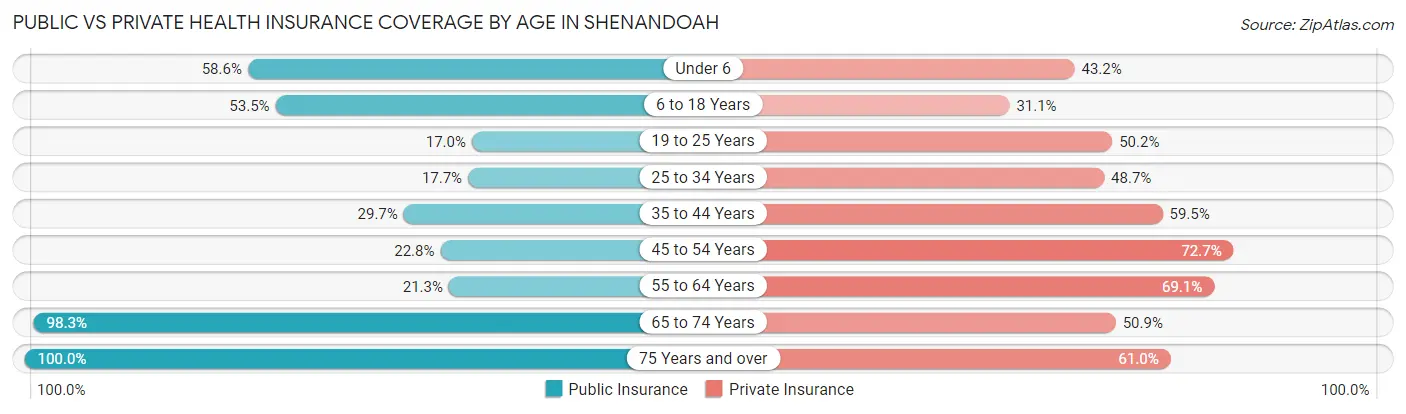
| Age Bracket | Public Insurance | Private Insurance |
| Under 6 | 99 (58.6%) | 73 (43.2%) |
| 6 to 18 Years | 395 (53.4%) | 230 (31.1%) |
| 19 to 25 Years | 42 (17.0%) | 124 (50.2%) |
| 25 to 34 Years | 68 (17.7%) | 187 (48.7%) |
| 35 to 44 Years | 126 (29.6%) | 253 (59.5%) |
| 45 to 54 Years | 82 (22.8%) | 261 (72.7%) |
| 55 to 64 Years | 44 (21.3%) | 143 (69.1%) |
| 65 to 74 Years | 290 (98.3%) | 150 (50.8%) |
| 75 Years and over | 195 (100.0%) | 119 (61.0%) |
| Total | 1,341 (44.4%) | 1,540 (51.0%) |
Disability Status by Sex by Age in Shenandoah
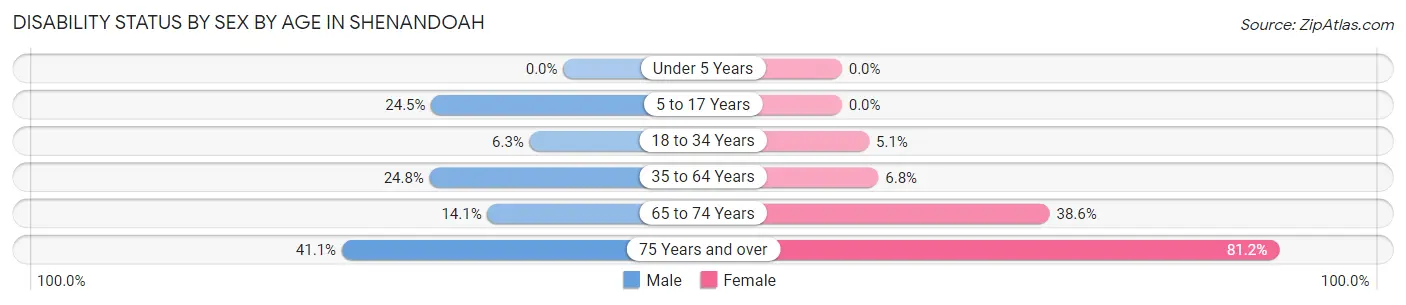
| Age Bracket | Male | Female |
| Under 5 Years | 0 (0.0%) | 0 (0.0%) |
| 5 to 17 Years | 86 (24.5%) | 0 (0.0%) |
| 18 to 34 Years | 22 (6.2%) | 17 (5.1%) |
| 35 to 64 Years | 129 (24.8%) | 32 (6.8%) |
| 65 to 74 Years | 20 (14.1%) | 59 (38.6%) |
| 75 Years and over | 30 (41.1%) | 99 (81.1%) |
Disability Class by Sex by Age in Shenandoah
Disability Class: Hearing Difficulty
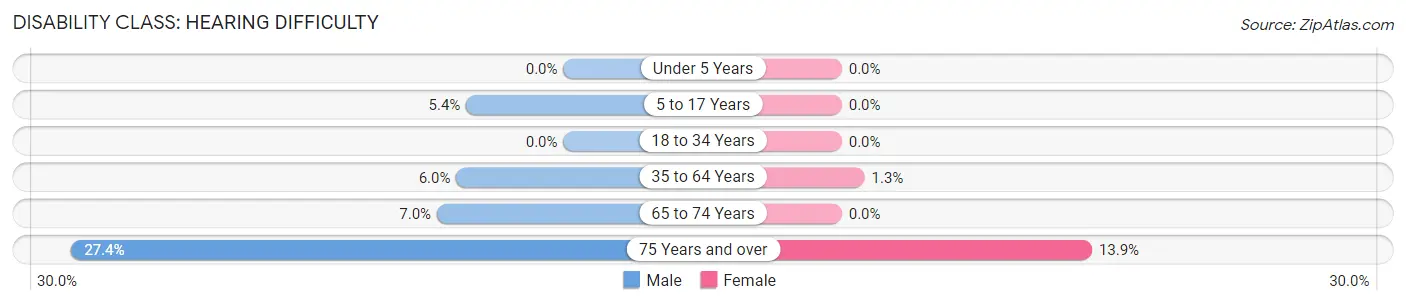
| Age Bracket | Male | Female |
| Under 5 Years | 0 (0.0%) | 0 (0.0%) |
| 5 to 17 Years | 19 (5.4%) | 0 (0.0%) |
| 18 to 34 Years | 0 (0.0%) | 0 (0.0%) |
| 35 to 64 Years | 31 (6.0%) | 6 (1.3%) |
| 65 to 74 Years | 10 (7.0%) | 0 (0.0%) |
| 75 Years and over | 20 (27.4%) | 17 (13.9%) |
Disability Class: Vision Difficulty
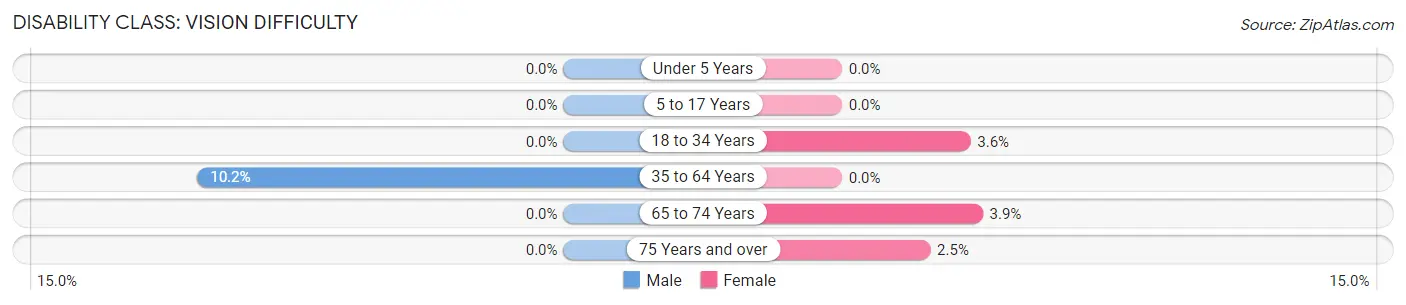
| Age Bracket | Male | Female |
| Under 5 Years | 0 (0.0%) | 0 (0.0%) |
| 5 to 17 Years | 0 (0.0%) | 0 (0.0%) |
| 18 to 34 Years | 0 (0.0%) | 12 (3.6%) |
| 35 to 64 Years | 53 (10.2%) | 0 (0.0%) |
| 65 to 74 Years | 0 (0.0%) | 6 (3.9%) |
| 75 Years and over | 0 (0.0%) | 3 (2.5%) |
Disability Class: Cognitive Difficulty
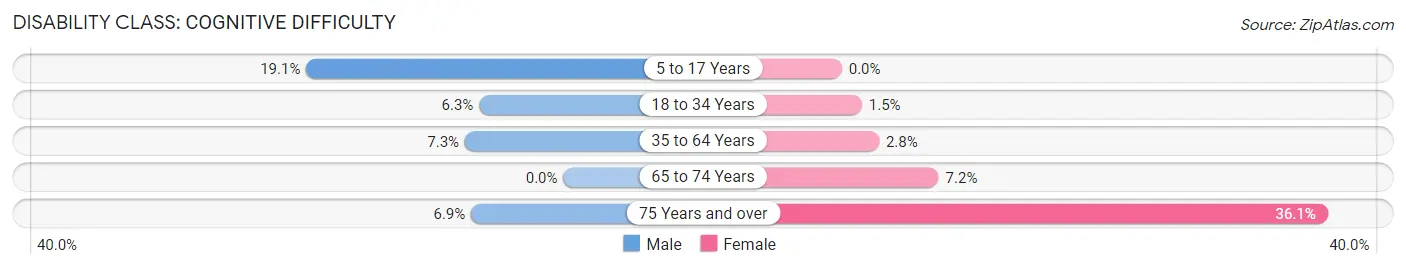
| Age Bracket | Male | Female |
| 5 to 17 Years | 67 (19.1%) | 0 (0.0%) |
| 18 to 34 Years | 22 (6.2%) | 5 (1.5%) |
| 35 to 64 Years | 38 (7.3%) | 13 (2.8%) |
| 65 to 74 Years | 0 (0.0%) | 11 (7.2%) |
| 75 Years and over | 5 (6.9%) | 44 (36.1%) |
Disability Class: Ambulatory Difficulty
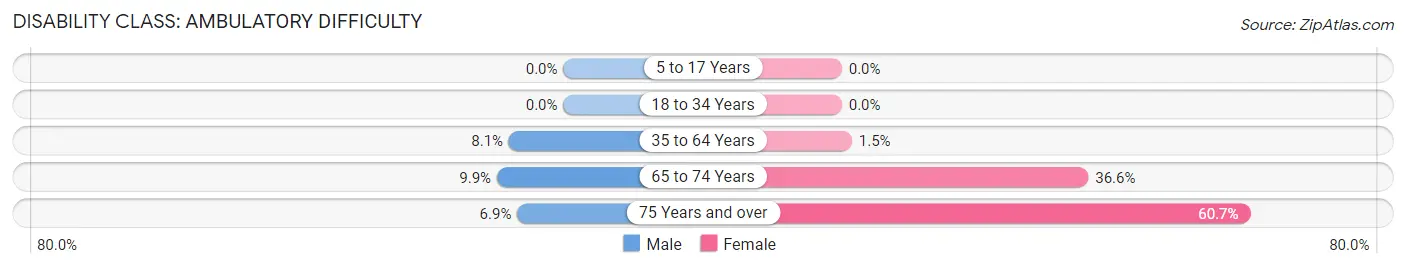
| Age Bracket | Male | Female |
| 5 to 17 Years | 0 (0.0%) | 0 (0.0%) |
| 18 to 34 Years | 0 (0.0%) | 0 (0.0%) |
| 35 to 64 Years | 42 (8.1%) | 7 (1.5%) |
| 65 to 74 Years | 14 (9.9%) | 56 (36.6%) |
| 75 Years and over | 5 (6.9%) | 74 (60.7%) |
Disability Class: Self-Care Difficulty
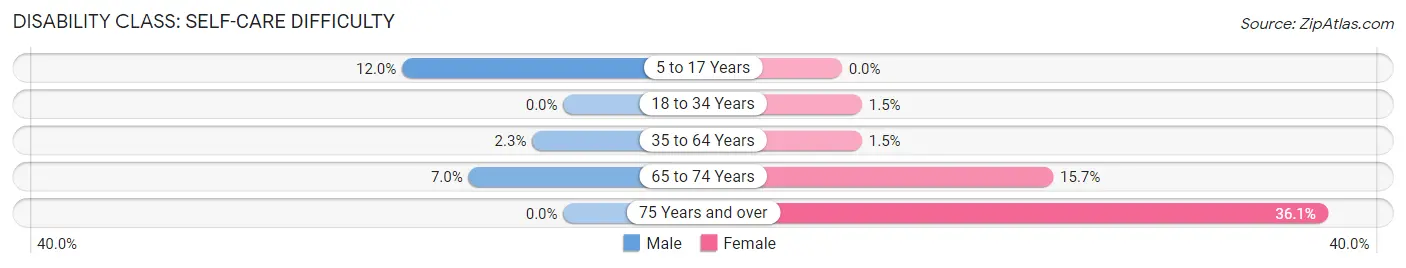
| Age Bracket | Male | Female |
| 5 to 17 Years | 42 (12.0%) | 0 (0.0%) |
| 18 to 34 Years | 0 (0.0%) | 5 (1.5%) |
| 35 to 64 Years | 12 (2.3%) | 7 (1.5%) |
| 65 to 74 Years | 10 (7.0%) | 24 (15.7%) |
| 75 Years and over | 0 (0.0%) | 44 (36.1%) |
Technology Access in Shenandoah
Computing Device Access in Shenandoah
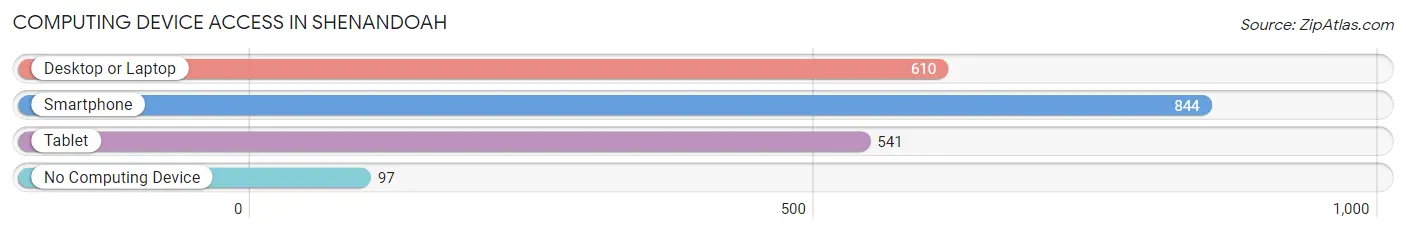
| Device Type | # Households | % Households |
| Desktop or Laptop | 610 | 62.5% |
| Smartphone | 844 | 86.5% |
| Tablet | 541 | 55.4% |
| No Computing Device | 97 | 9.9% |
| Total | 976 | 100.0% |
Internet Access in Shenandoah
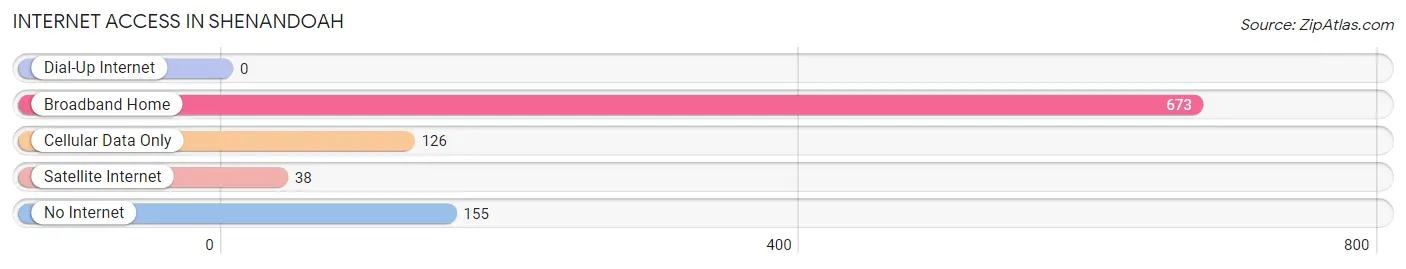
| Internet Type | # Households | % Households |
| Dial-Up Internet | 0 | 0.0% |
| Broadband Home | 673 | 69.0% |
| Cellular Data Only | 126 | 12.9% |
| Satellite Internet | 38 | 3.9% |
| No Internet | 155 | 15.9% |
| Total | 976 | 100.0% |
Shenandoah Summary
Shenandoah, Virginia is a small town located in the Shenandoah Valley of Virginia, approximately 75 miles west of Washington, D.C. The town is situated in the foothills of the Blue Ridge Mountains and is surrounded by the George Washington National Forest. The town is home to a population of approximately 1,500 people and is the county seat of Shenandoah County.
History
Shenandoah was first settled in 1732 by German immigrants who were attracted to the area by its fertile soil and abundant natural resources. The town was originally known as St. Mark’s Church and was the first German settlement in the Shenandoah Valley. The town was officially incorporated in 1831 and was named after the nearby Shenandoah River.
During the Civil War, Shenandoah was the site of several battles, including the Battle of New Market in 1864. The town was also the site of the Battle of Cedar Creek in October 1864, which was a decisive victory for the Union forces.
Geography
Shenandoah is located in the Shenandoah Valley of Virginia, approximately 75 miles west of Washington, D.C. The town is situated in the foothills of the Blue Ridge Mountains and is surrounded by the George Washington National Forest. The town is located at the intersection of U.S. Route 11 and U.S. Route 340.
The climate in Shenandoah is humid subtropical, with hot, humid summers and mild winters. The average annual temperature is 57°F, with an average high of 79°F in July and an average low of 35°F in January. The average annual precipitation is 43 inches.
Economy
Shenandoah’s economy is largely based on agriculture and tourism. The town is home to several farms, including apple orchards, vineyards, and livestock farms. The town is also home to several wineries, including the Shenandoah Vineyards and the Shenandoah Valley Winery.
Tourism is also an important part of the local economy. The town is home to several historic sites, including the Shenandoah Valley Battlefields National Historic District, which includes the sites of several Civil War battles. The town is also home to several museums, including the Shenandoah Valley Museum of Natural History and the Shenandoah Valley Civil War Museum.
Demographics
As of the 2010 census, Shenandoah had a population of 1,521 people. The racial makeup of the town was 95.3% White, 1.2% African American, 0.3% Native American, 0.7% Asian, 0.1% Pacific Islander, 0.7% from other races, and 1.8% from two or more races. Hispanic or Latino of any race were 2.2% of the population.
The median household income in Shenandoah was $41,250, and the median family income was $50,000. The per capita income for the town was $20,945. About 11.2% of families and 14.2% of the population were below the poverty line, including 18.2% of those under age 18 and 8.3% of those age 65 or over.
Common Questions
What is Per Capita Income in Shenandoah?
Per Capita income in Shenandoah is $23,323.
What is the Median Family Income in Shenandoah?
Median Family Income in Shenandoah is $67,857.
What is the Median Household income in Shenandoah?
Median Household Income in Shenandoah is $64,410.
What is Income or Wage Gap in Shenandoah?
Income or Wage Gap in Shenandoah is 35.0%.
Women in Shenandoah earn 65.0 cents for every dollar earned by a man.
What is Inequality or Gini Index in Shenandoah?
Inequality or Gini Index in Shenandoah is 0.33.
What is the Total Population of Shenandoah?
Total Population of Shenandoah is 3,020.
What is the Total Male Population of Shenandoah?
Total Male Population of Shenandoah is 1,538.
What is the Total Female Population of Shenandoah?
Total Female Population of Shenandoah is 1,482.
What is the Ratio of Males per 100 Females in Shenandoah?
There are 103.78 Males per 100 Females in Shenandoah.
What is the Ratio of Females per 100 Males in Shenandoah?
There are 96.36 Females per 100 Males in Shenandoah.
What is the Median Population Age in Shenandoah?
Median Population Age in Shenandoah is 33.7 Years.
What is the Average Family Size in Shenandoah
Average Family Size in Shenandoah is 3.6 People.
What is the Average Household Size in Shenandoah
Average Household Size in Shenandoah is 3.1 People.
How Large is the Labor Force in Shenandoah?
There are 1,395 People in the Labor Forcein in Shenandoah.
What is the Percentage of People in the Labor Force in Shenandoah?
61.1% of People are in the Labor Force in Shenandoah.
What is the Unemployment Rate in Shenandoah?
Unemployment Rate in Shenandoah is 3.5%.