Lovettsville, VA Map & Demographics
Lovettsville Map
Lovettsville Overview
$41,930
PER CAPITA INCOME
$149,500
AVG FAMILY INCOME
$137,411
AVG HOUSEHOLD INCOME
43.0%
WAGE / INCOME GAP [ % ]
57.0¢/ $1
WAGE / INCOME GAP [ $ ]
0.32
INEQUALITY / GINI INDEX
2,666
TOTAL POPULATION
1,298
MALE POPULATION
1,368
FEMALE POPULATION
94.88
MALES / 100 FEMALES
105.39
FEMALES / 100 MALES
31.1
MEDIAN AGE
3.8
AVG FAMILY SIZE
3.6
AVG HOUSEHOLD SIZE
1,323
LABOR FORCE [ PEOPLE ]
74.8%
PERCENT IN LABOR FORCE
1.3%
UNEMPLOYMENT RATE
Lovettsville Zip Codes
Lovettsville Area Codes
Income in Lovettsville
Income Overview in Lovettsville
Per Capita Income in Lovettsville is $41,930, while median incomes of families and households are $149,500 and $137,411 respectively.
| Characteristic | Number | Measure |
| Per Capita Income | 2,666 | $41,930 |
| Median Family Income | 614 | $149,500 |
| Mean Family Income | 614 | $154,027 |
| Median Household Income | 747 | $137,411 |
| Mean Household Income | 747 | $142,895 |
| Income Deficit | 614 | $0 |
| Wage / Income Gap (%) | 2,666 | 42.96% |
| Wage / Income Gap ($) | 2,666 | 57.04¢ per $1 |
| Gini / Inequality Index | 2,666 | 0.32 |
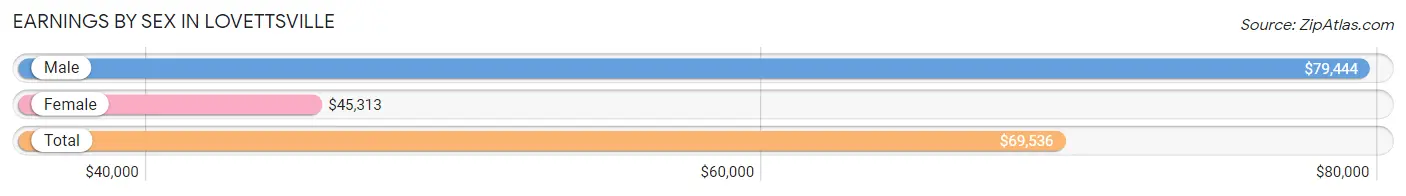
Earnings by Sex in Lovettsville
Average Earnings in Lovettsville are $69,536, $79,444 for men and $45,313 for women, a difference of 43.0%.
| Sex | Number | Average Earnings |
| Male | 750 (54.9%) | $79,444 |
| Female | 617 (45.1%) | $45,313 |
| Total | 1,367 (100.0%) | $69,536 |
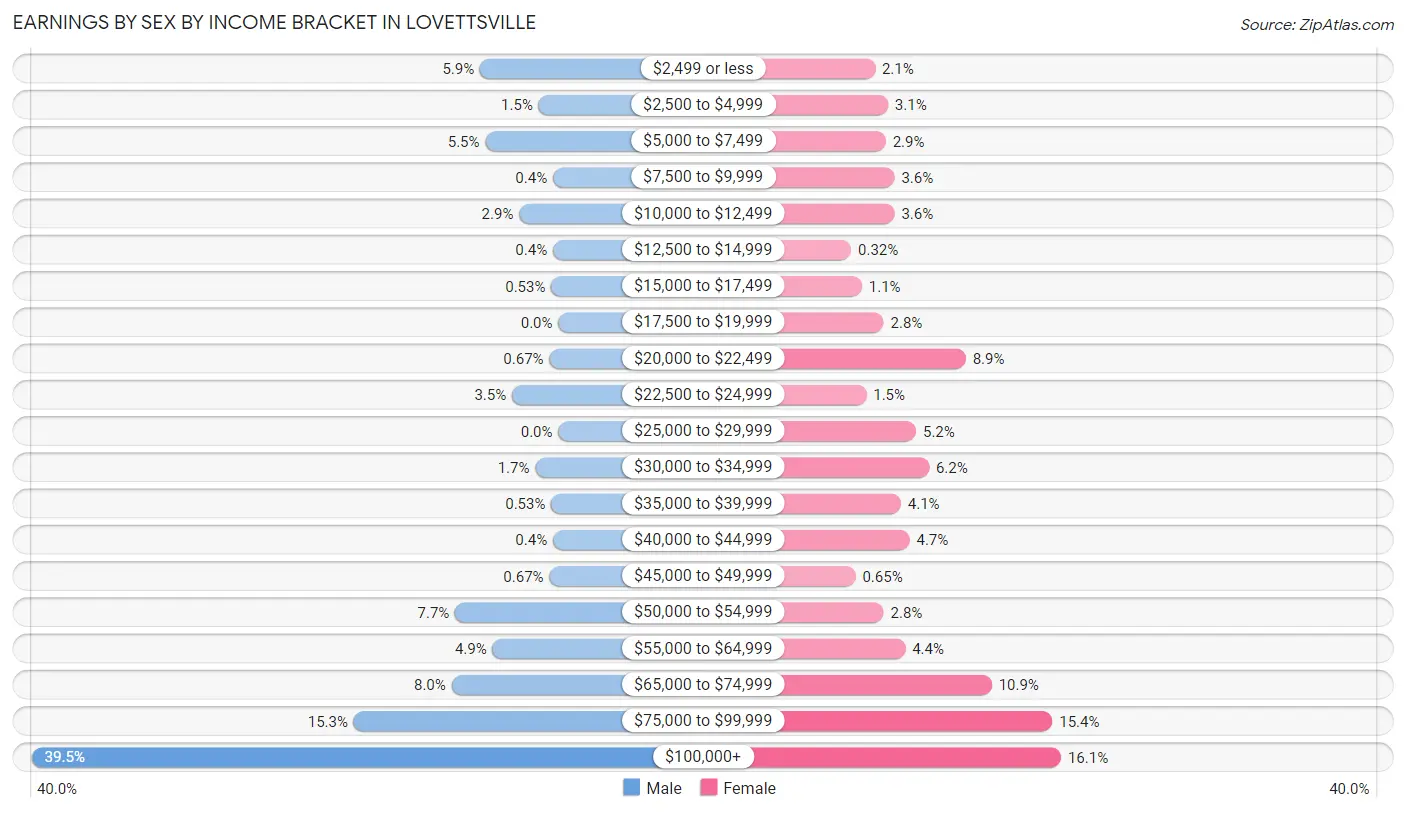
Earnings by Sex by Income Bracket in Lovettsville
The most common earnings brackets in Lovettsville are $100,000+ for men (296 | 39.5%) and $100,000+ for women (99 | 16.1%).
| Income | Male | Female |
| $2,499 or less | 44 (5.9%) | 13 (2.1%) |
| $2,500 to $4,999 | 11 (1.5%) | 19 (3.1%) |
| $5,000 to $7,499 | 41 (5.5%) | 18 (2.9%) |
| $7,500 to $9,999 | 3 (0.4%) | 22 (3.6%) |
| $10,000 to $12,499 | 22 (2.9%) | 22 (3.6%) |
| $12,500 to $14,999 | 3 (0.4%) | 2 (0.3%) |
| $15,000 to $17,499 | 4 (0.5%) | 7 (1.1%) |
| $17,500 to $19,999 | 0 (0.0%) | 17 (2.8%) |
| $20,000 to $22,499 | 5 (0.7%) | 55 (8.9%) |
| $22,500 to $24,999 | 26 (3.5%) | 9 (1.5%) |
| $25,000 to $29,999 | 0 (0.0%) | 32 (5.2%) |
| $30,000 to $34,999 | 13 (1.7%) | 38 (6.2%) |
| $35,000 to $39,999 | 4 (0.5%) | 25 (4.1%) |
| $40,000 to $44,999 | 3 (0.4%) | 29 (4.7%) |
| $45,000 to $49,999 | 5 (0.7%) | 4 (0.6%) |
| $50,000 to $54,999 | 58 (7.7%) | 17 (2.8%) |
| $55,000 to $64,999 | 37 (4.9%) | 27 (4.4%) |
| $65,000 to $74,999 | 60 (8.0%) | 67 (10.9%) |
| $75,000 to $99,999 | 115 (15.3%) | 95 (15.4%) |
| $100,000+ | 296 (39.5%) | 99 (16.1%) |
| Total | 750 (100.0%) | 617 (100.0%) |
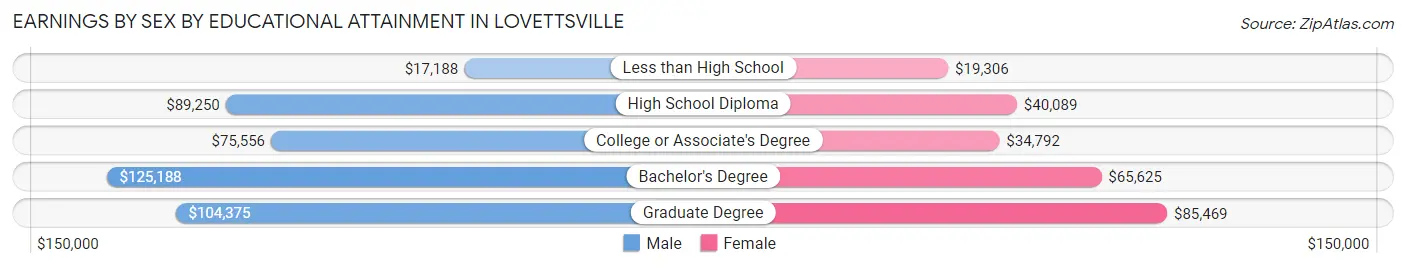
Earnings by Sex by Educational Attainment in Lovettsville
Average earnings in Lovettsville are $92,188 for men and $57,679 for women, a difference of 37.4%. Men with an educational attainment of bachelor's degree enjoy the highest average annual earnings of $125,188, while those with less than high school education earn the least with $17,188. Women with an educational attainment of graduate degree earn the most with the average annual earnings of $85,469, while those with less than high school education have the smallest earnings of $19,306.
| Educational Attainment | Male Income | Female Income |
| Less than High School | $17,188 | $19,306 |
| High School Diploma | $89,250 | $40,089 |
| College or Associate's Degree | $75,556 | $34,792 |
| Bachelor's Degree | $125,188 | $65,625 |
| Graduate Degree | $104,375 | $85,469 |
| Total | $92,188 | $57,679 |
Family Income in Lovettsville
Family Income Brackets in Lovettsville
According to the Lovettsville family income data, there are 155 families falling into the $200,000+ income range, which is the most common income bracket and makes up 25.2% of all families. Conversely, the less than $10,000 income bracket is the least frequent group with only 2 families (0.3%) belonging to this category.
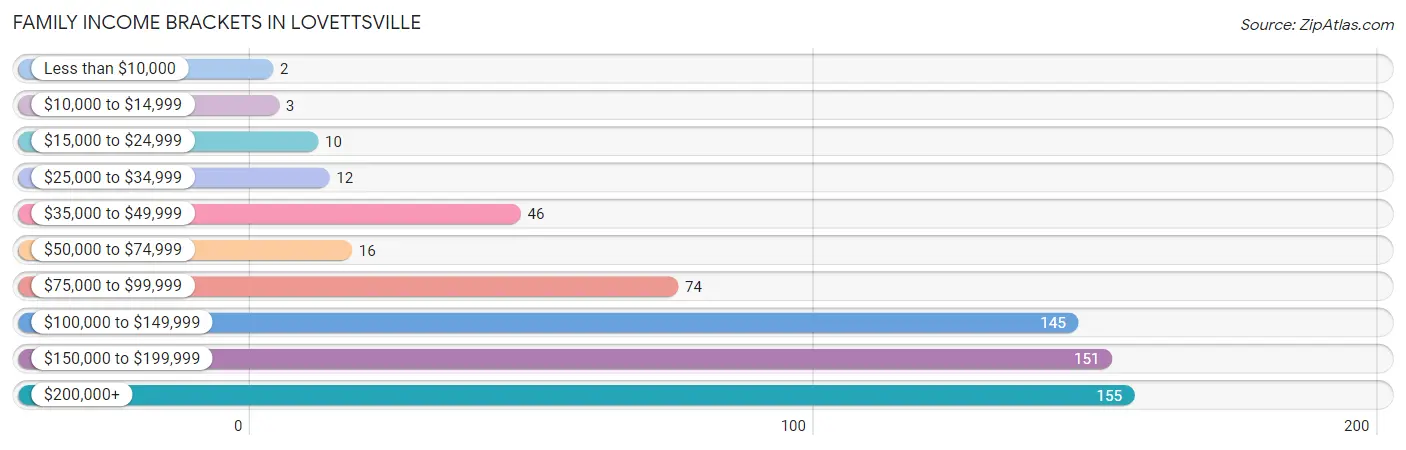
| Income Bracket | # Families | % Families |
| Less than $10,000 | 2 | 0.3% |
| $10,000 to $14,999 | 3 | 0.5% |
| $15,000 to $24,999 | 10 | 1.6% |
| $25,000 to $34,999 | 12 | 2.0% |
| $35,000 to $49,999 | 46 | 7.5% |
| $50,000 to $74,999 | 16 | 2.6% |
| $75,000 to $99,999 | 74 | 12.1% |
| $100,000 to $149,999 | 145 | 23.6% |
| $150,000 to $199,999 | 151 | 24.6% |
| $200,000+ | 155 | 25.2% |
Family Income by Famaliy Size in Lovettsville
4-person families (150 | 24.4%) account for the highest median family income in Lovettsville with $161,667 per family, while 2-person families (168 | 27.4%) have the highest median income of $75,000 per family member.
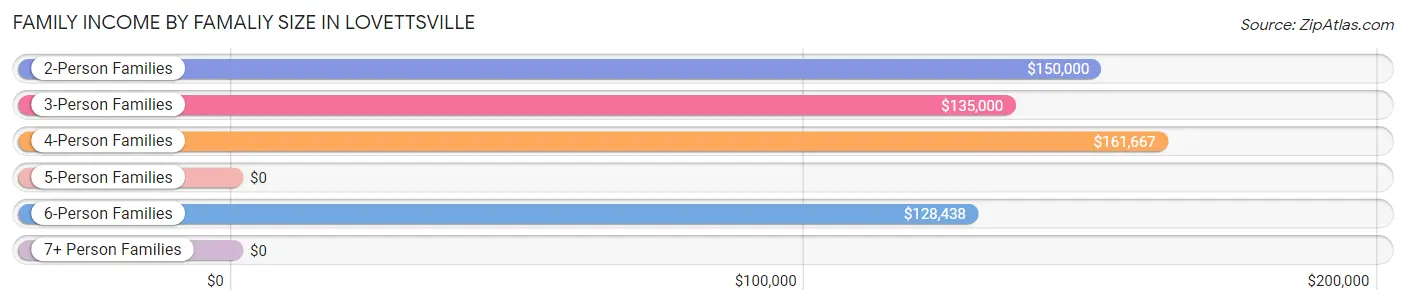
| Income Bracket | # Families | Median Income |
| 2-Person Families | 168 (27.4%) | $150,000 |
| 3-Person Families | 118 (19.2%) | $135,000 |
| 4-Person Families | 150 (24.4%) | $161,667 |
| 5-Person Families | 88 (14.3%) | $0 |
| 6-Person Families | 77 (12.5%) | $128,438 |
| 7+ Person Families | 13 (2.1%) | $0 |
| Total | 614 (100.0%) | $149,500 |
Family Income by Number of Earners in Lovettsville
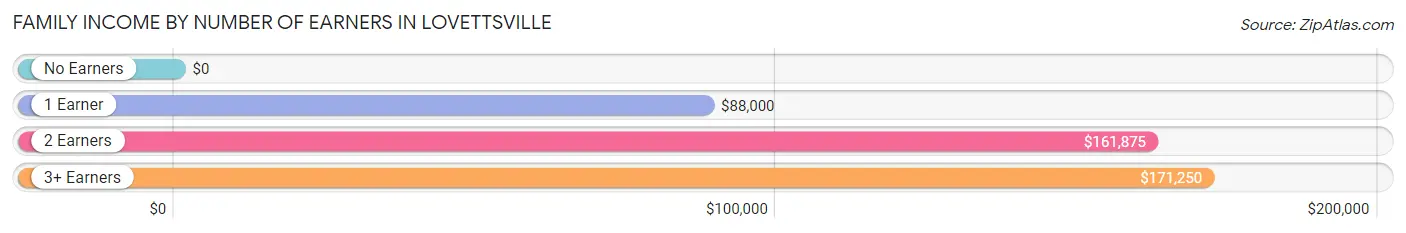
| Number of Earners | # Families | Median Income |
| No Earners | 27 (4.4%) | $0 |
| 1 Earner | 138 (22.5%) | $88,000 |
| 2 Earners | 368 (59.9%) | $161,875 |
| 3+ Earners | 81 (13.2%) | $171,250 |
| Total | 614 (100.0%) | $149,500 |
Household Income in Lovettsville
Household Income Brackets in Lovettsville
With 175 households falling in the category, the $100,000 to $149,999 income range is the most frequent in Lovettsville, accounting for 23.4% of all households. In contrast, only 8 households (1.1%) fall into the less than $10,000 income bracket, making it the least populous group.
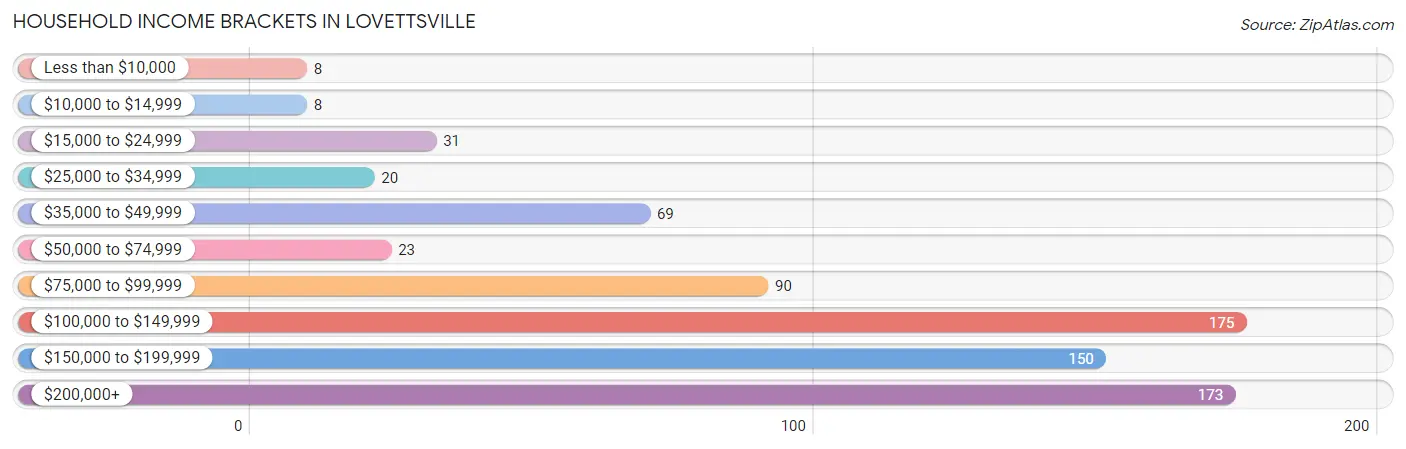
| Income Bracket | # Households | % Households |
| Less than $10,000 | 8 | 1.1% |
| $10,000 to $14,999 | 8 | 1.1% |
| $15,000 to $24,999 | 31 | 4.1% |
| $25,000 to $34,999 | 20 | 2.7% |
| $35,000 to $49,999 | 69 | 9.2% |
| $50,000 to $74,999 | 23 | 3.1% |
| $75,000 to $99,999 | 90 | 12.0% |
| $100,000 to $149,999 | 175 | 23.4% |
| $150,000 to $199,999 | 150 | 20.1% |
| $200,000+ | 173 | 23.2% |
Household Income by Householder Age in Lovettsville
The median household income in Lovettsville is $137,411, with the highest median household income of $158,125 found in the 45 to 64 years age bracket for the primary householder. A total of 235 households (31.5%) fall into this category. Meanwhile, the 15 to 24 years age bracket for the primary householder has the lowest median household income of $0, with 9 households (1.2%) in this group.
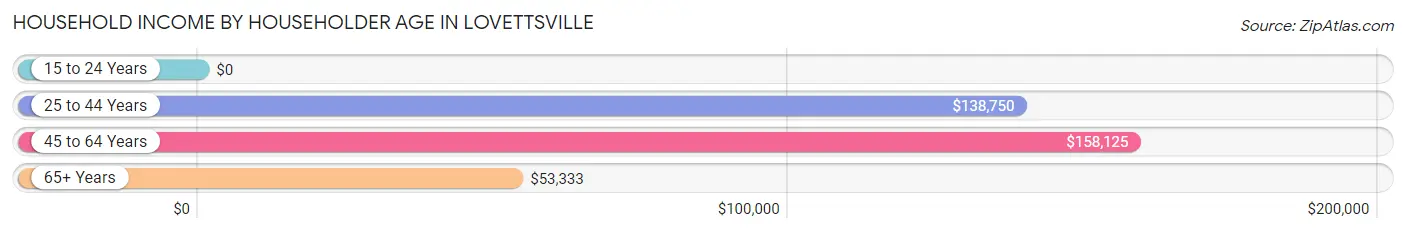
| Income Bracket | # Households | Median Income |
| 15 to 24 Years | 9 (1.2%) | $0 |
| 25 to 44 Years | 373 (49.9%) | $138,750 |
| 45 to 64 Years | 235 (31.5%) | $158,125 |
| 65+ Years | 130 (17.4%) | $53,333 |
| Total | 747 (100.0%) | $137,411 |
Poverty in Lovettsville
Income Below Poverty by Sex and Age in Lovettsville
With 3.3% poverty level for males and 5.5% for females among the residents of Lovettsville, 5 year old males and 16 and 17 year old females are the most vulnerable to poverty, with 3 males (33.3%) and 16 females (19.8%) in their respective age groups living below the poverty level.
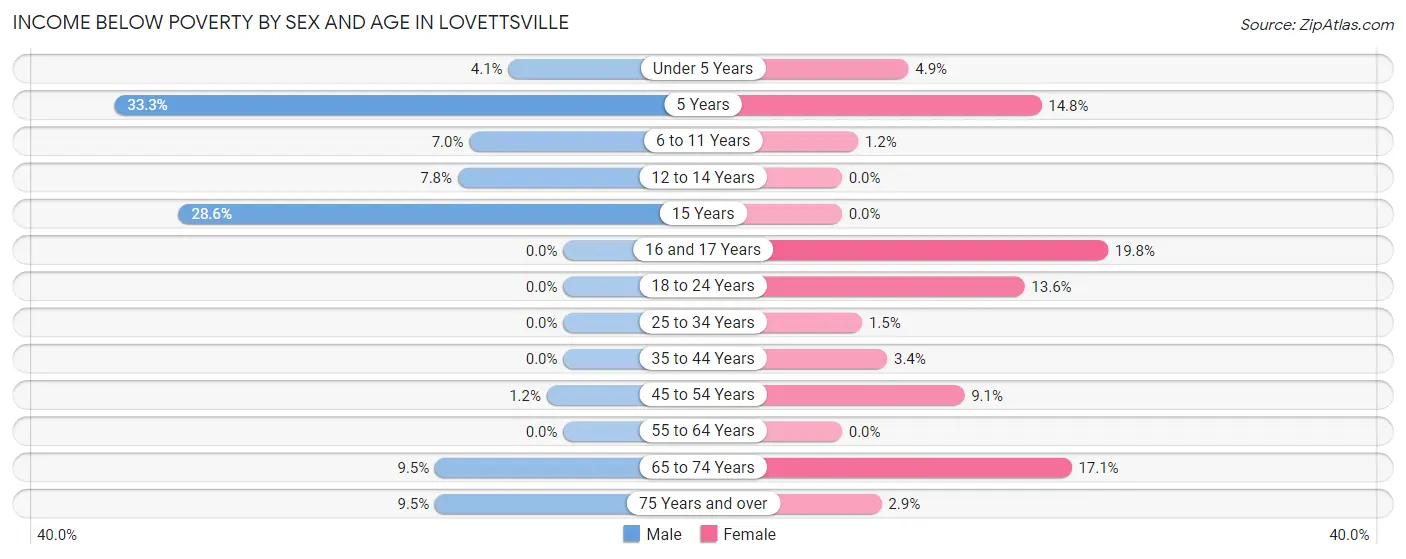
| Age Bracket | Male | Female |
| Under 5 Years | 6 (4.1%) | 4 (4.9%) |
| 5 Years | 3 (33.3%) | 4 (14.8%) |
| 6 to 11 Years | 12 (7.0%) | 2 (1.2%) |
| 12 to 14 Years | 9 (7.8%) | 0 (0.0%) |
| 15 Years | 4 (28.6%) | 0 (0.0%) |
| 16 and 17 Years | 0 (0.0%) | 16 (19.8%) |
| 18 to 24 Years | 0 (0.0%) | 8 (13.6%) |
| 25 to 34 Years | 0 (0.0%) | 3 (1.5%) |
| 35 to 44 Years | 0 (0.0%) | 8 (3.4%) |
| 45 to 54 Years | 2 (1.2%) | 9 (9.1%) |
| 55 to 64 Years | 0 (0.0%) | 0 (0.0%) |
| 65 to 74 Years | 4 (9.5%) | 15 (17.1%) |
| 75 Years and over | 2 (9.5%) | 2 (2.9%) |
| Total | 42 (3.3%) | 71 (5.5%) |
Income Above Poverty by Sex and Age in Lovettsville
According to the poverty statistics in Lovettsville, males aged 16 and 17 years and females aged 12 to 14 years are the age groups that are most secure financially, with 100.0% of males and 100.0% of females in these age groups living above the poverty line.
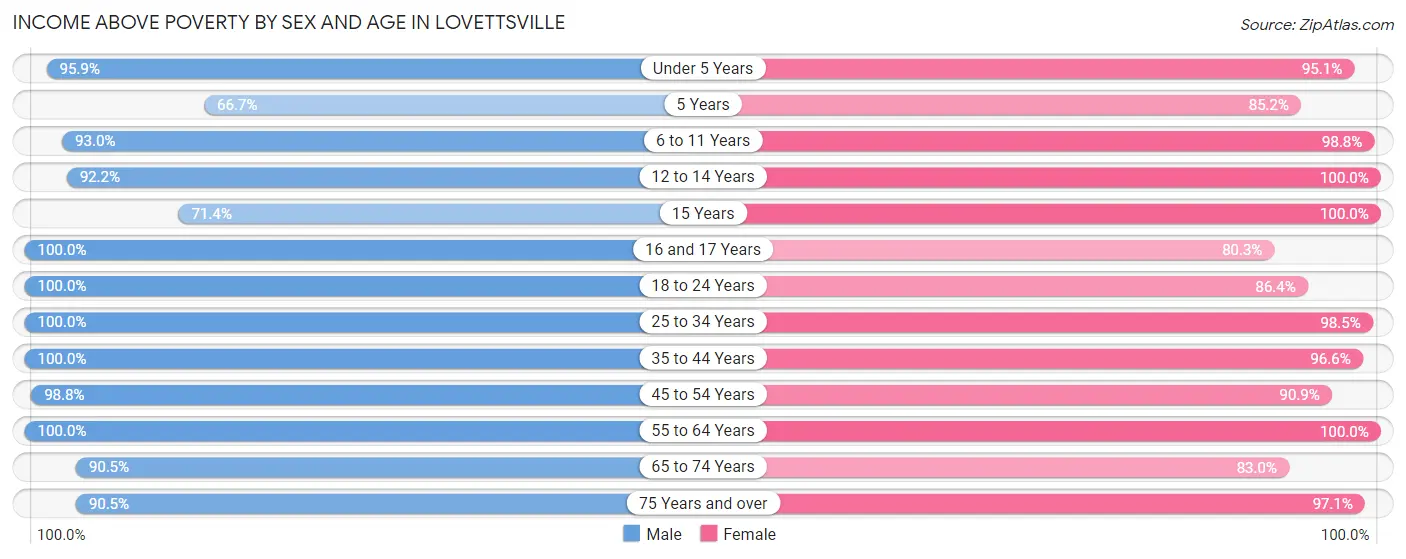
| Age Bracket | Male | Female |
| Under 5 Years | 141 (95.9%) | 77 (95.1%) |
| 5 Years | 6 (66.7%) | 23 (85.2%) |
| 6 to 11 Years | 160 (93.0%) | 164 (98.8%) |
| 12 to 14 Years | 106 (92.2%) | 58 (100.0%) |
| 15 Years | 10 (71.4%) | 6 (100.0%) |
| 16 and 17 Years | 29 (100.0%) | 65 (80.2%) |
| 18 to 24 Years | 79 (100.0%) | 51 (86.4%) |
| 25 to 34 Years | 152 (100.0%) | 197 (98.5%) |
| 35 to 44 Years | 250 (100.0%) | 230 (96.6%) |
| 45 to 54 Years | 161 (98.8%) | 90 (90.9%) |
| 55 to 64 Years | 79 (100.0%) | 121 (100.0%) |
| 65 to 74 Years | 38 (90.5%) | 73 (83.0%) |
| 75 Years and over | 19 (90.5%) | 66 (97.1%) |
| Total | 1,230 (96.7%) | 1,221 (94.5%) |
Income Below Poverty Among Married-Couple Families in Lovettsville
The poverty statistics for married-couple families in Lovettsville show that 0.8% or 4 of the total 509 families live below the poverty line. Families with 3 or 4 children have the highest poverty rate of 4.3%, comprising of 4 families. On the other hand, families with no children have the lowest poverty rate of 0.0%, which includes 0 families.
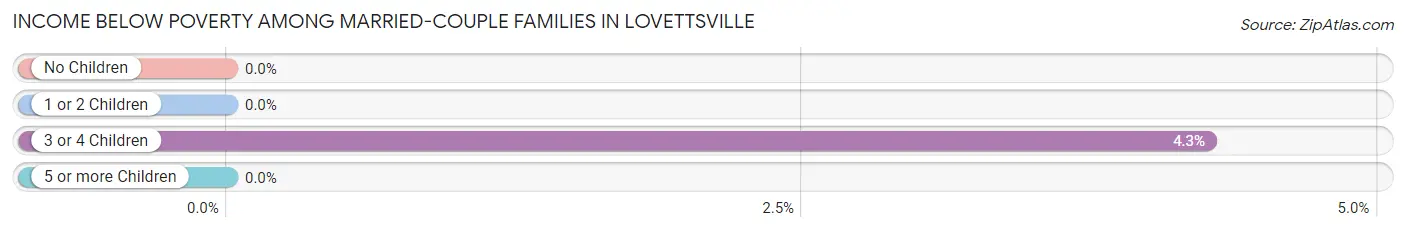
| Children | Above Poverty | Below Poverty |
| No Children | 160 (100.0%) | 0 (0.0%) |
| 1 or 2 Children | 252 (100.0%) | 0 (0.0%) |
| 3 or 4 Children | 90 (95.7%) | 4 (4.3%) |
| 5 or more Children | 3 (100.0%) | 0 (0.0%) |
| Total | 505 (99.2%) | 4 (0.8%) |
Income Below Poverty Among Single-Parent Households in Lovettsville
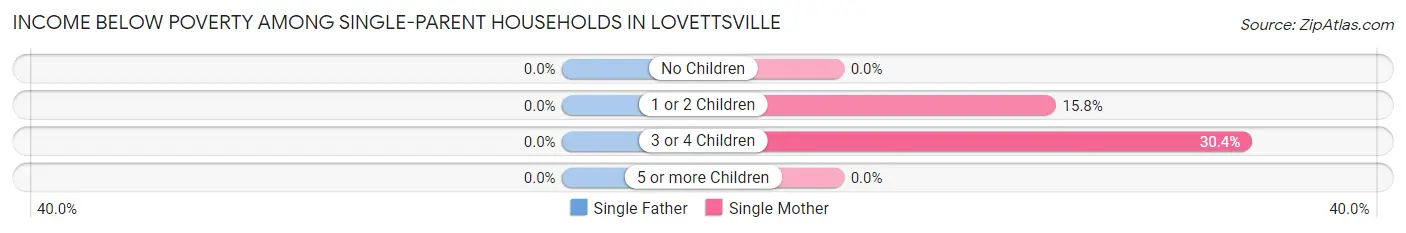
| Children | Single Father | Single Mother |
| No Children | 0 (0.0%) | 0 (0.0%) |
| 1 or 2 Children | 0 (0.0%) | 3 (15.8%) |
| 3 or 4 Children | 0 (0.0%) | 7 (30.4%) |
| 5 or more Children | 0 (0.0%) | 0 (0.0%) |
| Total | 0 (0.0%) | 10 (14.7%) |
Income Below Poverty Among Married-Couple vs Single-Parent Households in Lovettsville
The poverty data for Lovettsville shows that 4 of the married-couple family households (0.8%) and 10 of the single-parent households (9.5%) are living below the poverty level. Within the married-couple family households, those with 3 or 4 children have the highest poverty rate, with 4 households (4.3%) falling below the poverty line. Among the single-parent households, those with 3 or 4 children have the highest poverty rate, with 7 household (30.4%) living below poverty.
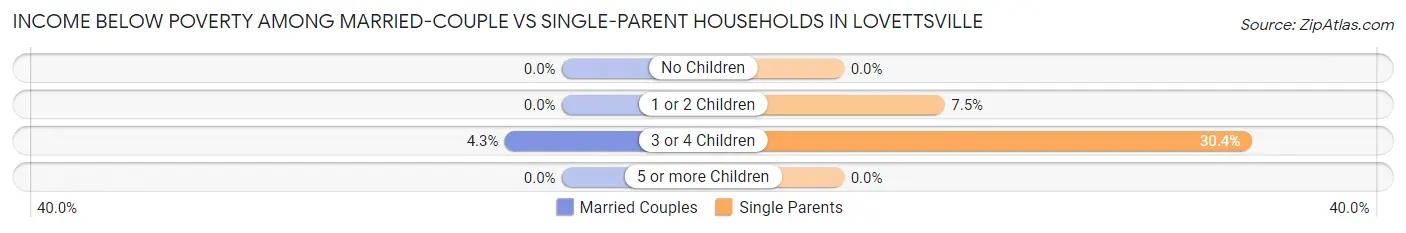
| Children | Married-Couple Families | Single-Parent Households |
| No Children | 0 (0.0%) | 0 (0.0%) |
| 1 or 2 Children | 0 (0.0%) | 3 (7.5%) |
| 3 or 4 Children | 4 (4.3%) | 7 (30.4%) |
| 5 or more Children | 0 (0.0%) | 0 (0.0%) |
| Total | 4 (0.8%) | 10 (9.5%) |
Race in Lovettsville
The most populous races in Lovettsville are White / Caucasian (1,918 | 71.9%), Black / African American (306 | 11.5%), and Hispanic or Latino (302 | 11.3%).
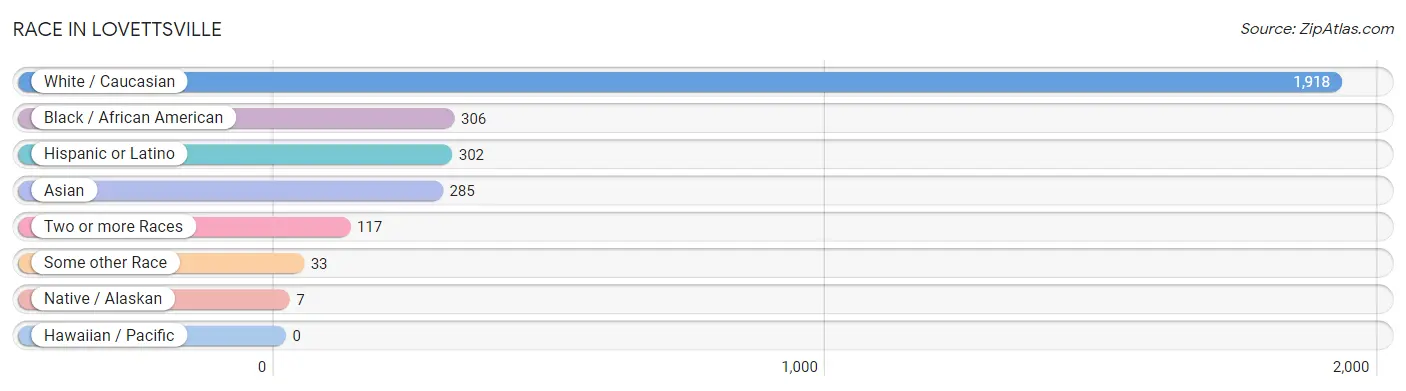
| Race | # Population | % Population |
| Asian | 285 | 10.7% |
| Black / African American | 306 | 11.5% |
| Hawaiian / Pacific | 0 | 0.0% |
| Hispanic or Latino | 302 | 11.3% |
| Native / Alaskan | 7 | 0.3% |
| White / Caucasian | 1,918 | 71.9% |
| Two or more Races | 117 | 4.4% |
| Some other Race | 33 | 1.2% |
| Total | 2,666 | 100.0% |
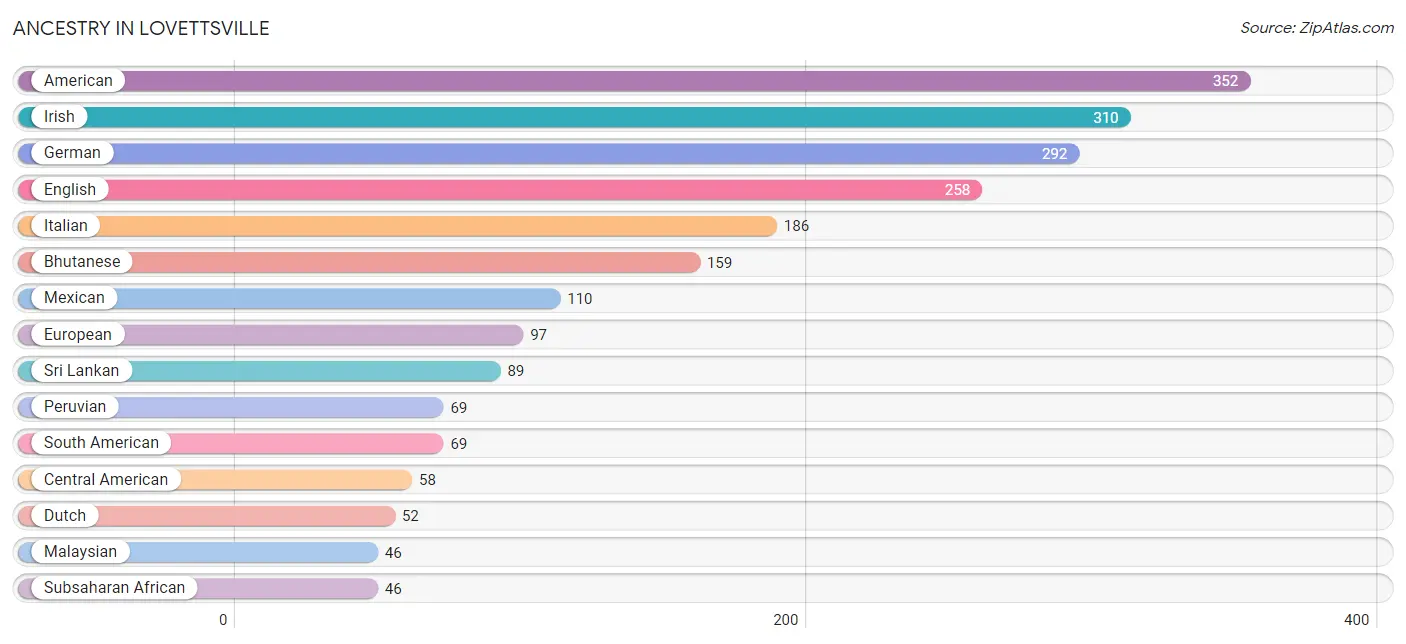
Ancestry in Lovettsville
The most populous ancestries reported in Lovettsville are American (352 | 13.2%), Irish (310 | 11.6%), German (292 | 11.0%), English (258 | 9.7%), and Italian (186 | 7.0%), together accounting for 52.4% of all Lovettsville residents.
| Ancestry | # Population | % Population |
| African | 30 | 1.1% |
| Albanian | 16 | 0.6% |
| American | 352 | 13.2% |
| Arab | 19 | 0.7% |
| Austrian | 14 | 0.5% |
| Bhutanese | 159 | 6.0% |
| Blackfeet | 10 | 0.4% |
| British | 41 | 1.5% |
| Burmese | 13 | 0.5% |
| Central American | 58 | 2.2% |
| Cherokee | 13 | 0.5% |
| Costa Rican | 2 | 0.1% |
| Czech | 6 | 0.2% |
| Dominican | 20 | 0.7% |
| Dutch | 52 | 1.9% |
| Eastern European | 3 | 0.1% |
| English | 258 | 9.7% |
| European | 97 | 3.6% |
| Finnish | 5 | 0.2% |
| French | 31 | 1.2% |
| French Canadian | 10 | 0.4% |
| German | 292 | 11.0% |
| Greek | 7 | 0.3% |
| Guatemalan | 16 | 0.6% |
| Hungarian | 22 | 0.8% |
| Indian (Asian) | 5 | 0.2% |
| Iranian | 30 | 1.1% |
| Irish | 310 | 11.6% |
| Iroquois | 10 | 0.4% |
| Italian | 186 | 7.0% |
| Korean | 35 | 1.3% |
| Latvian | 9 | 0.3% |
| Lebanese | 15 | 0.6% |
| Malaysian | 46 | 1.7% |
| Mexican | 110 | 4.1% |
| Nicaraguan | 30 | 1.1% |
| Northern European | 8 | 0.3% |
| Norwegian | 32 | 1.2% |
| Pakistani | 12 | 0.4% |
| Palestinian | 4 | 0.2% |
| Peruvian | 69 | 2.6% |
| Polish | 16 | 0.6% |
| Portuguese | 2 | 0.1% |
| Puerto Rican | 45 | 1.7% |
| Salvadoran | 10 | 0.4% |
| Scandinavian | 6 | 0.2% |
| Scotch-Irish | 13 | 0.5% |
| Scottish | 30 | 1.1% |
| Serbian | 24 | 0.9% |
| Sierra Leonean | 16 | 0.6% |
| Slovak | 22 | 0.8% |
| South American | 69 | 2.6% |
| Sri Lankan | 89 | 3.3% |
| Subsaharan African | 46 | 1.7% |
| Swedish | 29 | 1.1% |
| Turkish | 3 | 0.1% |
| Ukrainian | 10 | 0.4% |
| Welsh | 13 | 0.5% | View All 58 Rows |
Immigrants in Lovettsville
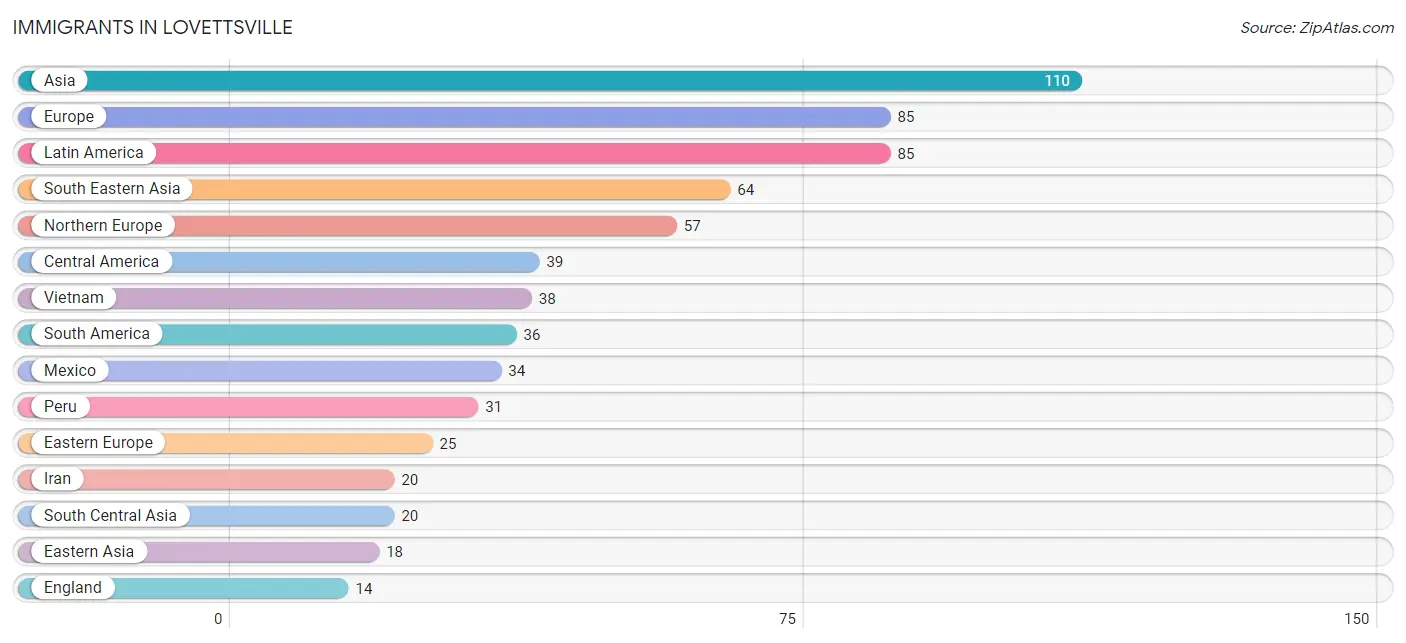
The most numerous immigrant groups reported in Lovettsville came from Asia (110 | 4.1%), Europe (85 | 3.2%), Latin America (85 | 3.2%), South Eastern Asia (64 | 2.4%), and Northern Europe (57 | 2.1%), together accounting for 15.0% of all Lovettsville residents.
| Immigration Origin | # Population | % Population |
| Africa | 9 | 0.3% |
| Albania | 11 | 0.4% |
| Asia | 110 | 4.1% |
| Canada | 3 | 0.1% |
| Caribbean | 10 | 0.4% |
| Central America | 39 | 1.5% |
| China | 5 | 0.2% |
| Dominican Republic | 10 | 0.4% |
| Eastern Africa | 5 | 0.2% |
| Eastern Asia | 18 | 0.7% |
| Eastern Europe | 25 | 0.9% |
| El Salvador | 5 | 0.2% |
| England | 14 | 0.5% |
| Europe | 85 | 3.2% |
| France | 3 | 0.1% |
| Indonesia | 2 | 0.1% |
| Iran | 20 | 0.7% |
| Korea | 13 | 0.5% |
| Latin America | 85 | 3.2% |
| Latvia | 9 | 0.3% |
| Lebanon | 4 | 0.2% |
| Mexico | 34 | 1.3% |
| Northern Europe | 57 | 2.1% |
| Peru | 31 | 1.2% |
| Philippines | 12 | 0.4% |
| Sierra Leone | 4 | 0.2% |
| South America | 36 | 1.3% |
| South Central Asia | 20 | 0.7% |
| South Eastern Asia | 64 | 2.4% |
| Taiwan | 3 | 0.1% |
| Thailand | 12 | 0.4% |
| Ukraine | 5 | 0.2% |
| Venezuela | 5 | 0.2% |
| Vietnam | 38 | 1.4% |
| Western Africa | 4 | 0.2% |
| Western Asia | 4 | 0.2% |
| Western Europe | 3 | 0.1% |
| Zimbabwe | 5 | 0.2% | View All 38 Rows |
Sex and Age in Lovettsville
Sex and Age in Lovettsville
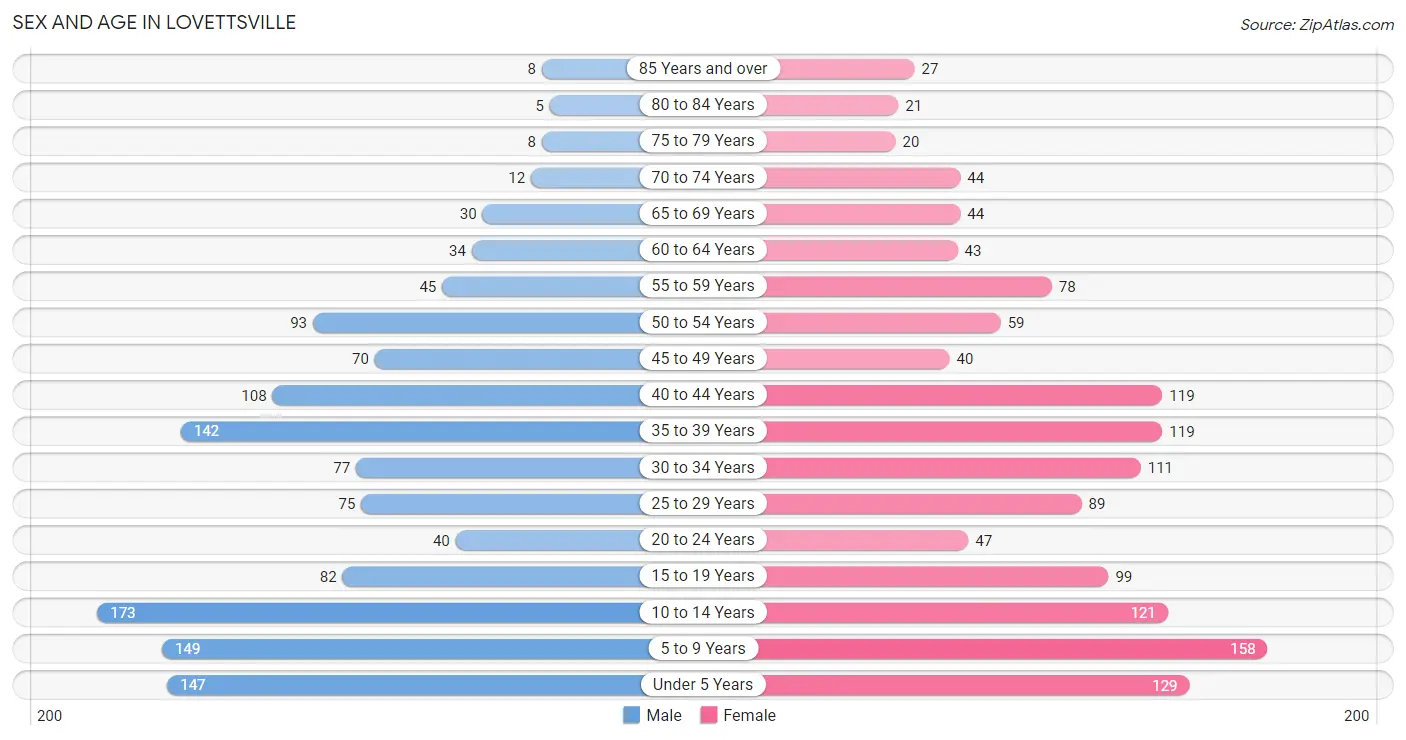
The most populous age groups in Lovettsville are 10 to 14 Years (173 | 13.3%) for men and 5 to 9 Years (158 | 11.6%) for women.
| Age Bracket | Male | Female |
| Under 5 Years | 147 (11.3%) | 129 (9.4%) |
| 5 to 9 Years | 149 (11.5%) | 158 (11.6%) |
| 10 to 14 Years | 173 (13.3%) | 121 (8.8%) |
| 15 to 19 Years | 82 (6.3%) | 99 (7.2%) |
| 20 to 24 Years | 40 (3.1%) | 47 (3.4%) |
| 25 to 29 Years | 75 (5.8%) | 89 (6.5%) |
| 30 to 34 Years | 77 (5.9%) | 111 (8.1%) |
| 35 to 39 Years | 142 (10.9%) | 119 (8.7%) |
| 40 to 44 Years | 108 (8.3%) | 119 (8.7%) |
| 45 to 49 Years | 70 (5.4%) | 40 (2.9%) |
| 50 to 54 Years | 93 (7.2%) | 59 (4.3%) |
| 55 to 59 Years | 45 (3.5%) | 78 (5.7%) |
| 60 to 64 Years | 34 (2.6%) | 43 (3.1%) |
| 65 to 69 Years | 30 (2.3%) | 44 (3.2%) |
| 70 to 74 Years | 12 (0.9%) | 44 (3.2%) |
| 75 to 79 Years | 8 (0.6%) | 20 (1.5%) |
| 80 to 84 Years | 5 (0.4%) | 21 (1.5%) |
| 85 Years and over | 8 (0.6%) | 27 (2.0%) |
| Total | 1,298 (100.0%) | 1,368 (100.0%) |
Families and Households in Lovettsville
Median Family Size in Lovettsville
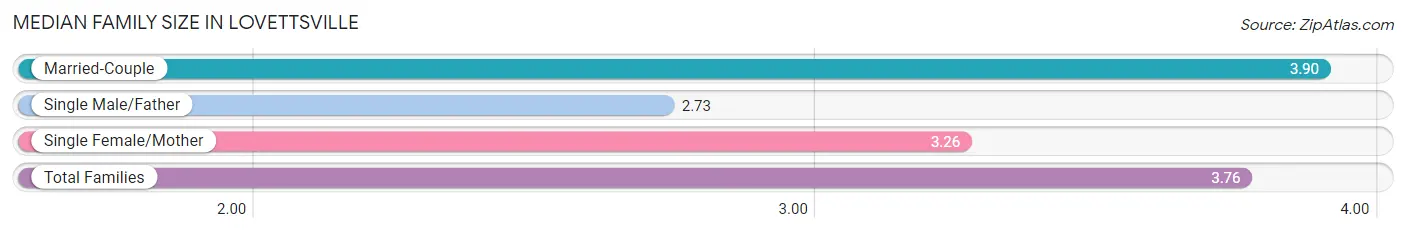
The median family size in Lovettsville is 3.76 persons per family, with married-couple families (509 | 82.9%) accounting for the largest median family size of 3.9 persons per family. On the other hand, single male/father families (37 | 6.0%) represent the smallest median family size with 2.73 persons per family.
| Family Type | # Families | Family Size |
| Married-Couple | 509 (82.9%) | 3.90 |
| Single Male/Father | 37 (6.0%) | 2.73 |
| Single Female/Mother | 68 (11.1%) | 3.26 |
| Total Families | 614 (100.0%) | 3.76 |
Median Household Size in Lovettsville
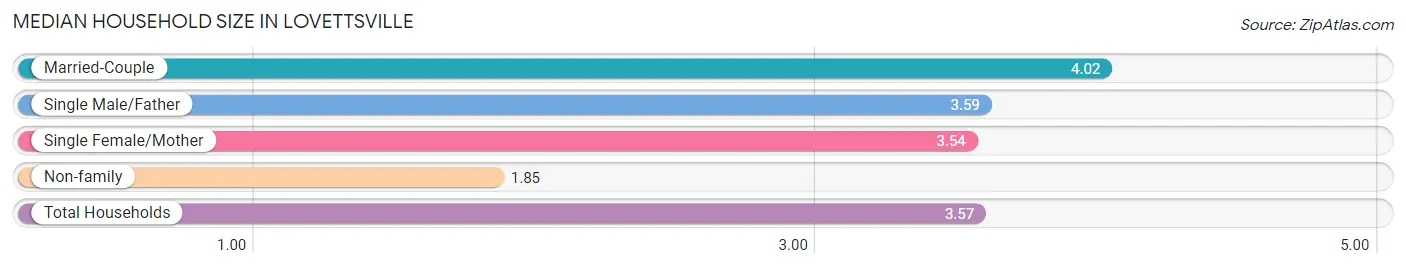
The median household size in Lovettsville is 3.57 persons per household, with married-couple households (509 | 68.1%) accounting for the largest median household size of 4.02 persons per household. non-family households (133 | 17.8%) represent the smallest median household size with 1.85 persons per household.
| Household Type | # Households | Household Size |
| Married-Couple | 509 (68.1%) | 4.02 |
| Single Male/Father | 37 (5.0%) | 3.59 |
| Single Female/Mother | 68 (9.1%) | 3.54 |
| Non-family | 133 (17.8%) | 1.85 |
| Total Households | 747 (100.0%) | 3.57 |
Household Size by Marriage Status in Lovettsville
Out of a total of 747 households in Lovettsville, 614 (82.2%) are family households, while 133 (17.8%) are nonfamily households. The most numerous type of family households are 4-person households, comprising 172, and the most common type of nonfamily households are 1-person households, comprising 118.
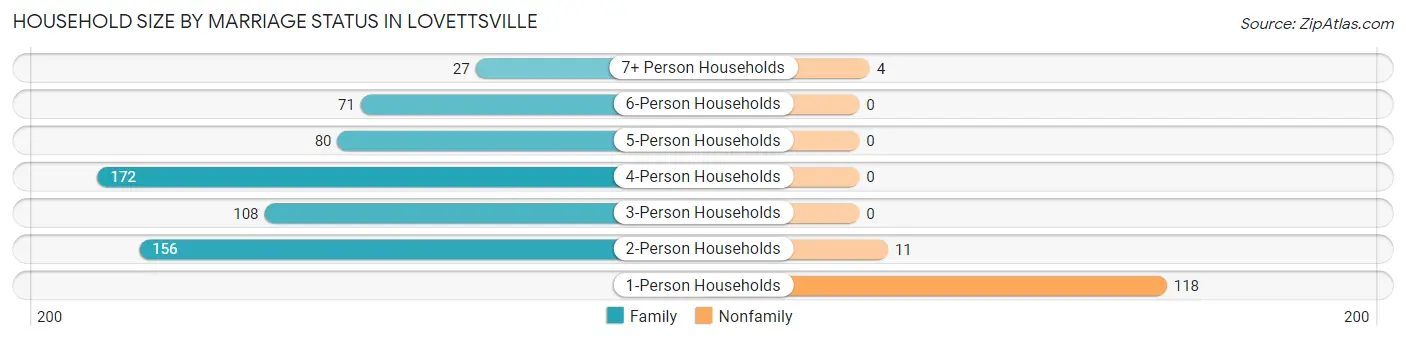
| Household Size | Family Households | Nonfamily Households |
| 1-Person Households | - | 118 (15.8%) |
| 2-Person Households | 156 (20.9%) | 11 (1.5%) |
| 3-Person Households | 108 (14.5%) | 0 (0.0%) |
| 4-Person Households | 172 (23.0%) | 0 (0.0%) |
| 5-Person Households | 80 (10.7%) | 0 (0.0%) |
| 6-Person Households | 71 (9.5%) | 0 (0.0%) |
| 7+ Person Households | 27 (3.6%) | 4 (0.5%) |
| Total | 614 (82.2%) | 133 (17.8%) |
Female Fertility in Lovettsville
Fertility by Age in Lovettsville
Average fertility rate in Lovettsville is 86.0 births per 1,000 women. Women in the age bracket of 20 to 34 years have the highest fertility rate with 178.0 births per 1,000 women. Women in the age bracket of 20 to 34 years acount for 80.0% of all women with births.
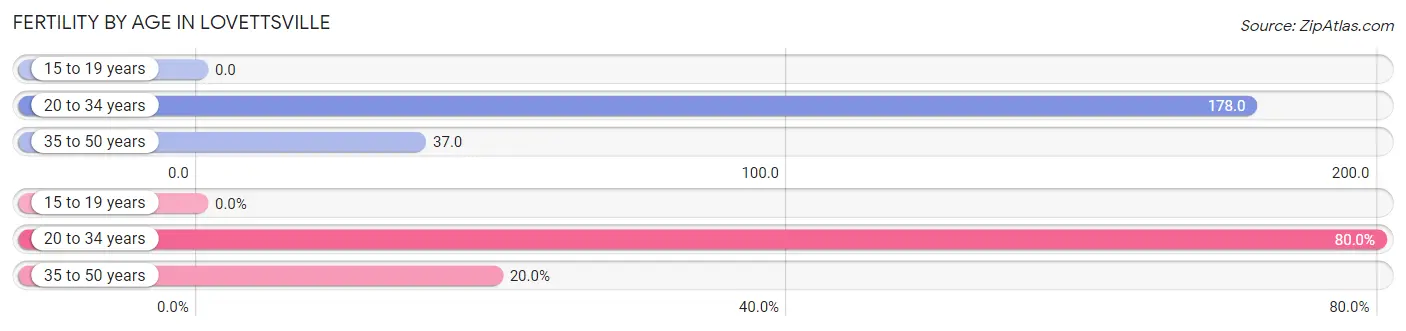
| Age Bracket | Women with Births | Births / 1,000 Women |
| 15 to 19 years | 0 (0.0%) | 0.0 |
| 20 to 34 years | 44 (80.0%) | 178.0 |
| 35 to 50 years | 11 (20.0%) | 37.0 |
| Total | 55 (100.0%) | 86.0 |
Fertility by Age by Marriage Status in Lovettsville
67.3% of women with births (55) in Lovettsville are married. The highest percentage of unmarried women with births falls into 20 to 34 years age bracket with 40.9% of them unmarried at the time of birth, while the lowest percentage of unmarried women with births belong to 35 to 50 years age bracket with 0.0% of them unmarried.
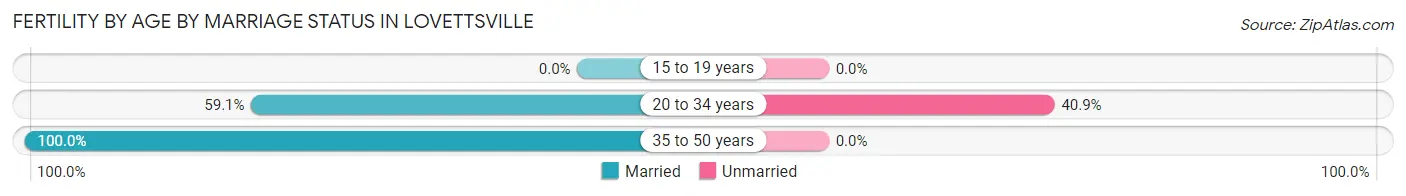
| Age Bracket | Married | Unmarried |
| 15 to 19 years | 0 (0.0%) | 0 (0.0%) |
| 20 to 34 years | 26 (59.1%) | 18 (40.9%) |
| 35 to 50 years | 11 (100.0%) | 0 (0.0%) |
| Total | 37 (67.3%) | 18 (32.7%) |
Fertility by Education in Lovettsville
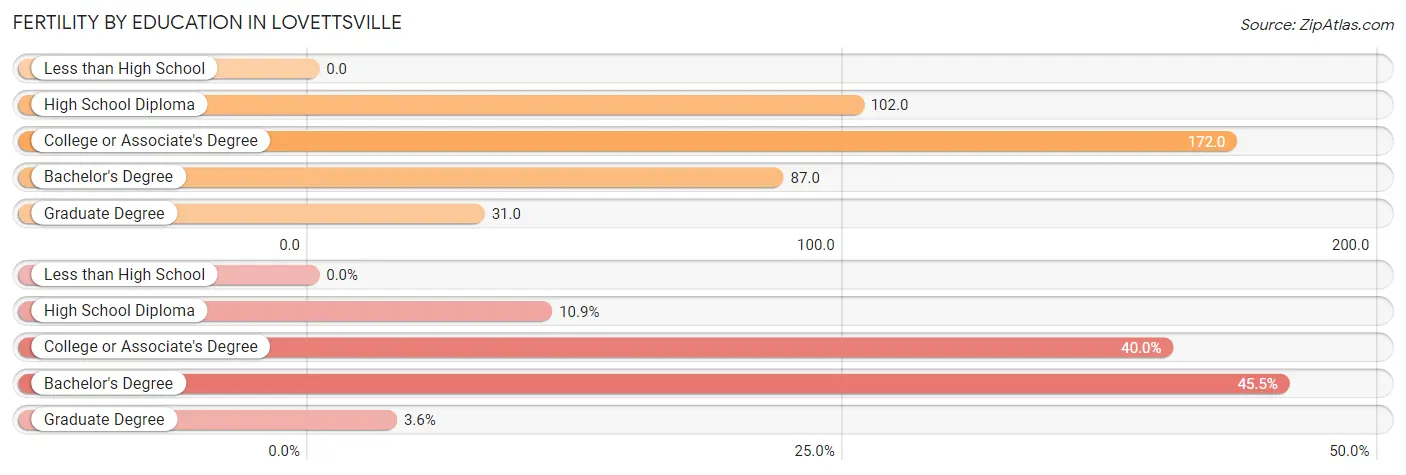
| Educational Attainment | Women with Births | Births / 1,000 Women |
| Less than High School | 0 (0.0%) | 0.0 |
| High School Diploma | 6 (10.9%) | 102.0 |
| College or Associate's Degree | 22 (40.0%) | 172.0 |
| Bachelor's Degree | 25 (45.5%) | 87.0 |
| Graduate Degree | 2 (3.6%) | 31.0 |
| Total | 55 (100.0%) | 86.0 |
Fertility by Education by Marriage Status in Lovettsville
32.7% of women with births in Lovettsville are unmarried. Women with the educational attainment of high school diploma are most likely to be married with 100.0% of them married at childbirth, while women with the educational attainment of college or associate's degree are least likely to be married with 81.8% of them unmarried at childbirth.
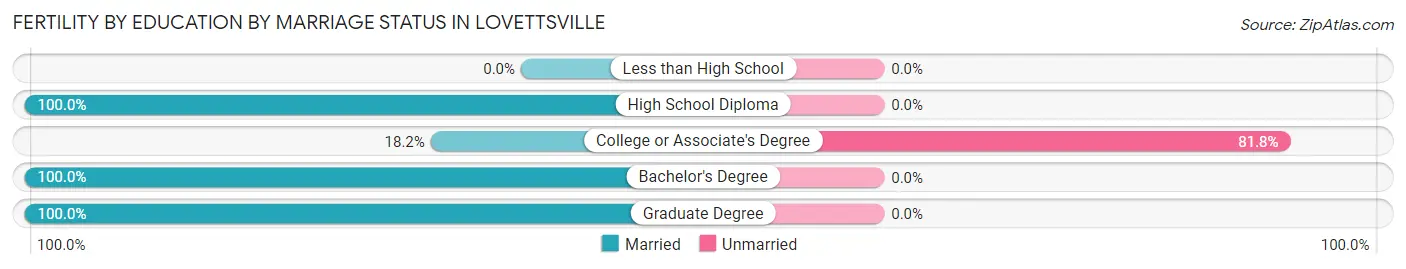
| Educational Attainment | Married | Unmarried |
| Less than High School | 0 (0.0%) | 0 (0.0%) |
| High School Diploma | 6 (100.0%) | 0 (0.0%) |
| College or Associate's Degree | 4 (18.2%) | 18 (81.8%) |
| Bachelor's Degree | 25 (100.0%) | 0 (0.0%) |
| Graduate Degree | 2 (100.0%) | 0 (0.0%) |
| Total | 37 (67.3%) | 18 (32.7%) |
Employment Characteristics in Lovettsville
Employment by Class of Employer in Lovettsville
Among the 1,274 employed individuals in Lovettsville, private company employees (824 | 64.7%), not-for-profit organizations (154 | 12.1%), and local government employees (129 | 10.1%) make up the most common classes of employment.
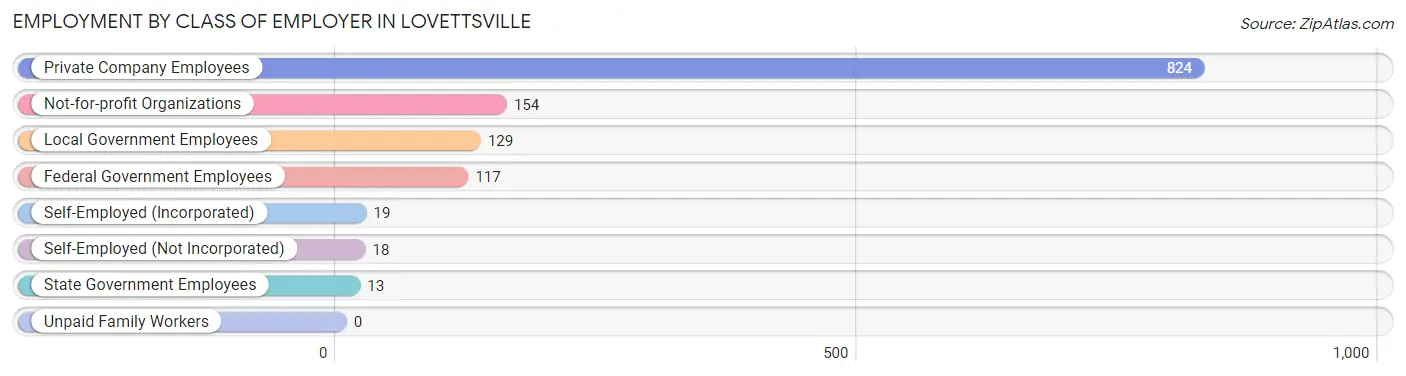
| Employer Class | # Employees | % Employees |
| Private Company Employees | 824 | 64.7% |
| Self-Employed (Incorporated) | 19 | 1.5% |
| Self-Employed (Not Incorporated) | 18 | 1.4% |
| Not-for-profit Organizations | 154 | 12.1% |
| Local Government Employees | 129 | 10.1% |
| State Government Employees | 13 | 1.0% |
| Federal Government Employees | 117 | 9.2% |
| Unpaid Family Workers | 0 | 0.0% |
| Total | 1,274 | 100.0% |
Employment Status by Age in Lovettsville
According to the labor force statistics for Lovettsville, out of the total population over 16 years of age (1,769), 74.8% or 1,323 individuals are in the labor force, with 1.3% or 17 of them unemployed. The age group with the highest labor force participation rate is 35 to 44 years, with 94.1% or 459 individuals in the labor force. Within the labor force, the 20 to 24 years age range has the highest percentage of unemployed individuals, with 8.1% or 6 of them being unemployed.
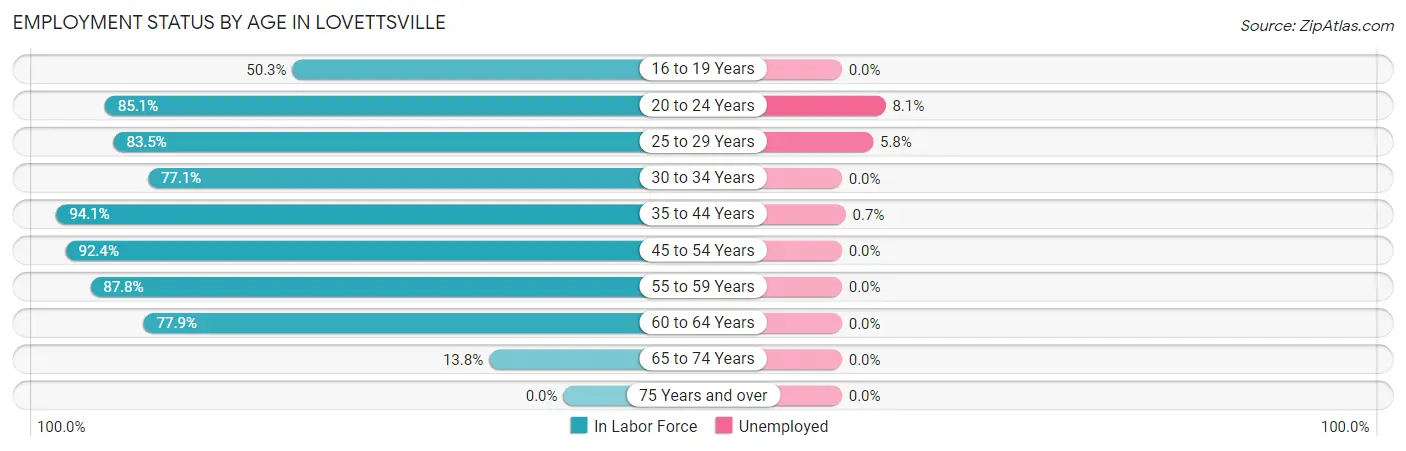
| Age Bracket | In Labor Force | Unemployed |
| 16 to 19 Years | 81 (50.3%) | 0 (0.0%) |
| 20 to 24 Years | 74 (85.1%) | 6 (8.1%) |
| 25 to 29 Years | 137 (83.5%) | 8 (5.8%) |
| 30 to 34 Years | 145 (77.1%) | 0 (0.0%) |
| 35 to 44 Years | 459 (94.1%) | 3 (0.7%) |
| 45 to 54 Years | 242 (92.4%) | 0 (0.0%) |
| 55 to 59 Years | 108 (87.8%) | 0 (0.0%) |
| 60 to 64 Years | 60 (77.9%) | 0 (0.0%) |
| 65 to 74 Years | 18 (13.8%) | 0 (0.0%) |
| 75 Years and over | 0 (0.0%) | 0 (0.0%) |
| Total | 1,323 (74.8%) | 17 (1.3%) |
Employment Status by Educational Attainment in Lovettsville
According to labor force statistics for Lovettsville, 88.4% of individuals (1,151) out of the total population between 25 and 64 years of age (1,302) are in the labor force, with 1.0% or 12 of them being unemployed. The group with the highest labor force participation rate are those with the educational attainment of less than high school, with 100.0% or 66 individuals in the labor force. Within the labor force, individuals with high school diploma education have the highest percentage of unemployment, with 1.4% or 3 of them being unemployed.
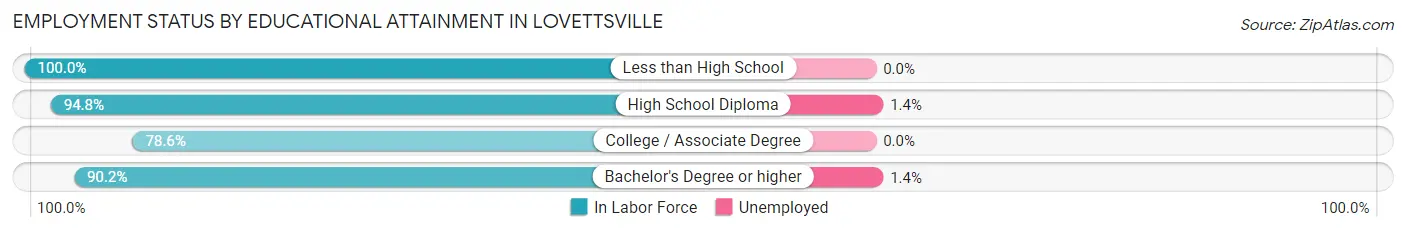
| Educational Attainment | In Labor Force | Unemployed |
| Less than High School | 66 (100.0%) | 0 (0.0%) |
| High School Diploma | 220 (94.8%) | 3 (1.4%) |
| College / Associate Degree | 275 (78.6%) | 0 (0.0%) |
| Bachelor's Degree or higher | 590 (90.2%) | 9 (1.4%) |
| Total | 1,151 (88.4%) | 13 (1.0%) |
Employment Occupations by Sex in Lovettsville
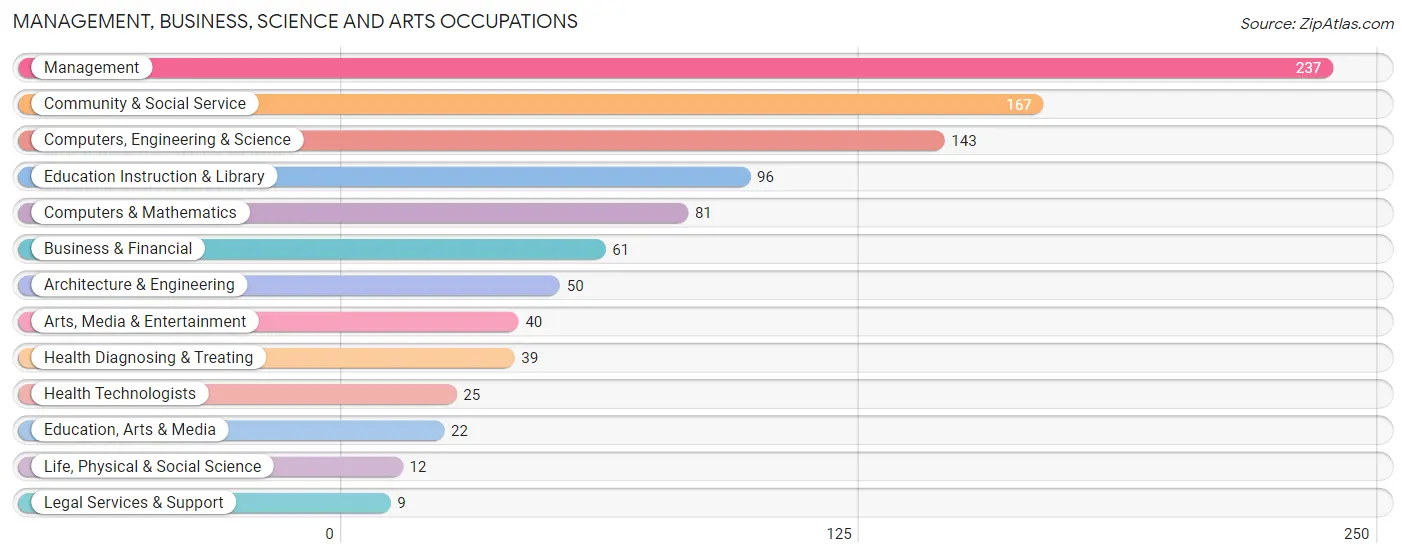
Management, Business, Science and Arts Occupations
The most common Management, Business, Science and Arts occupations in Lovettsville are Management (237 | 18.1%), Community & Social Service (167 | 12.8%), Computers, Engineering & Science (143 | 10.9%), Education Instruction & Library (96 | 7.3%), and Computers & Mathematics (81 | 6.2%).
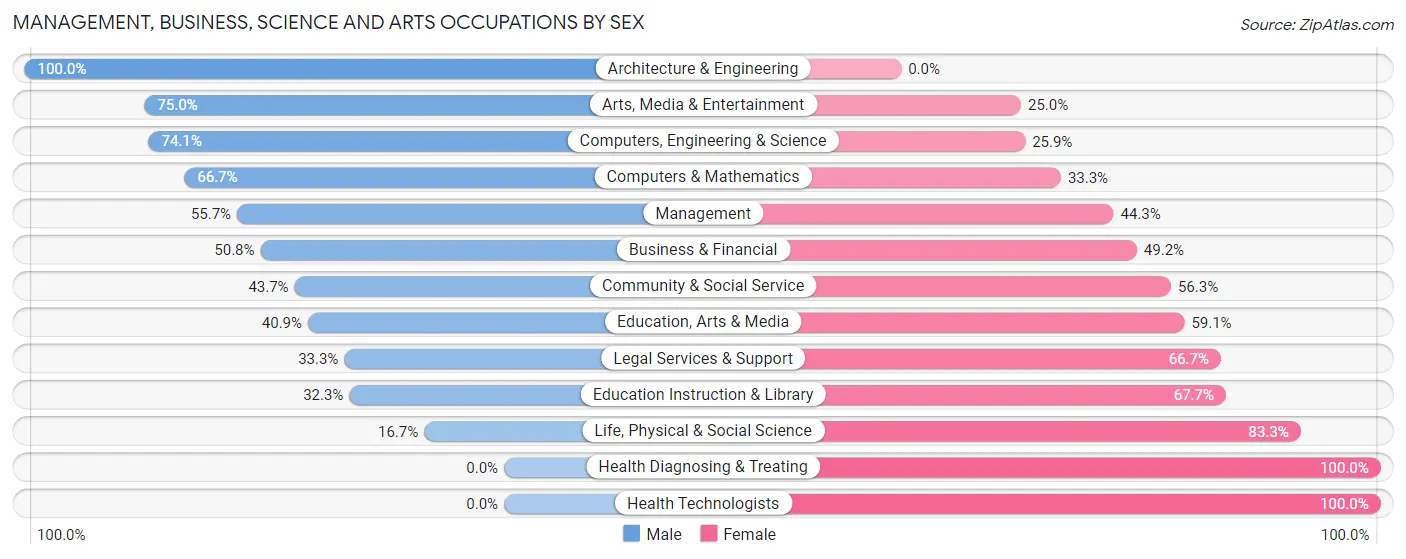
Management, Business, Science and Arts Occupations by Sex
Within the Management, Business, Science and Arts occupations in Lovettsville, the most male-oriented occupations are Architecture & Engineering (100.0%), Arts, Media & Entertainment (75.0%), and Computers, Engineering & Science (74.1%), while the most female-oriented occupations are Health Diagnosing & Treating (100.0%), Health Technologists (100.0%), and Life, Physical & Social Science (83.3%).
| Occupation | Male | Female |
| Management | 132 (55.7%) | 105 (44.3%) |
| Business & Financial | 31 (50.8%) | 30 (49.2%) |
| Computers, Engineering & Science | 106 (74.1%) | 37 (25.9%) |
| Computers & Mathematics | 54 (66.7%) | 27 (33.3%) |
| Architecture & Engineering | 50 (100.0%) | 0 (0.0%) |
| Life, Physical & Social Science | 2 (16.7%) | 10 (83.3%) |
| Community & Social Service | 73 (43.7%) | 94 (56.3%) |
| Education, Arts & Media | 9 (40.9%) | 13 (59.1%) |
| Legal Services & Support | 3 (33.3%) | 6 (66.7%) |
| Education Instruction & Library | 31 (32.3%) | 65 (67.7%) |
| Arts, Media & Entertainment | 30 (75.0%) | 10 (25.0%) |
| Health Diagnosing & Treating | 0 (0.0%) | 39 (100.0%) |
| Health Technologists | 0 (0.0%) | 25 (100.0%) |
| Total (Category) | 342 (52.9%) | 305 (47.1%) |
| Total (Overall) | 718 (54.9%) | 589 (45.1%) |
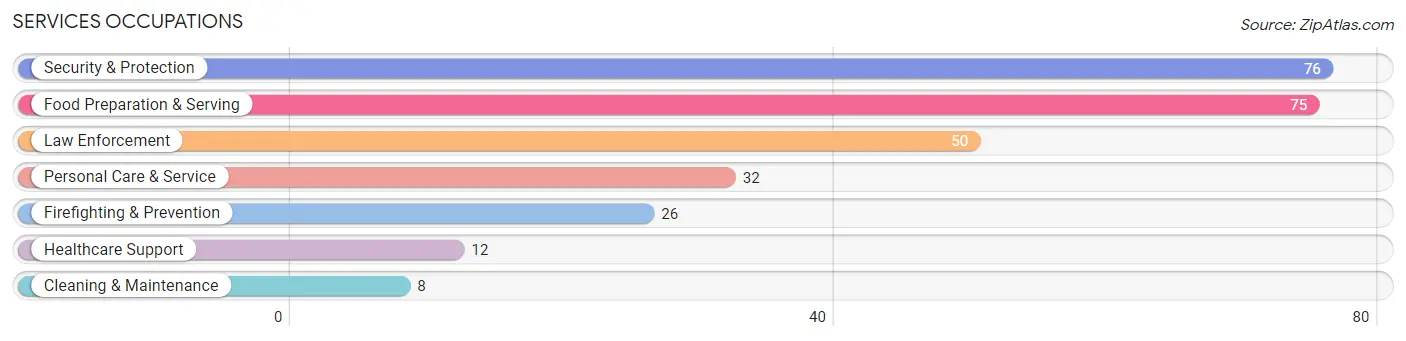
Services Occupations
The most common Services occupations in Lovettsville are Security & Protection (76 | 5.8%), Food Preparation & Serving (75 | 5.7%), Law Enforcement (50 | 3.8%), Personal Care & Service (32 | 2.5%), and Firefighting & Prevention (26 | 2.0%).
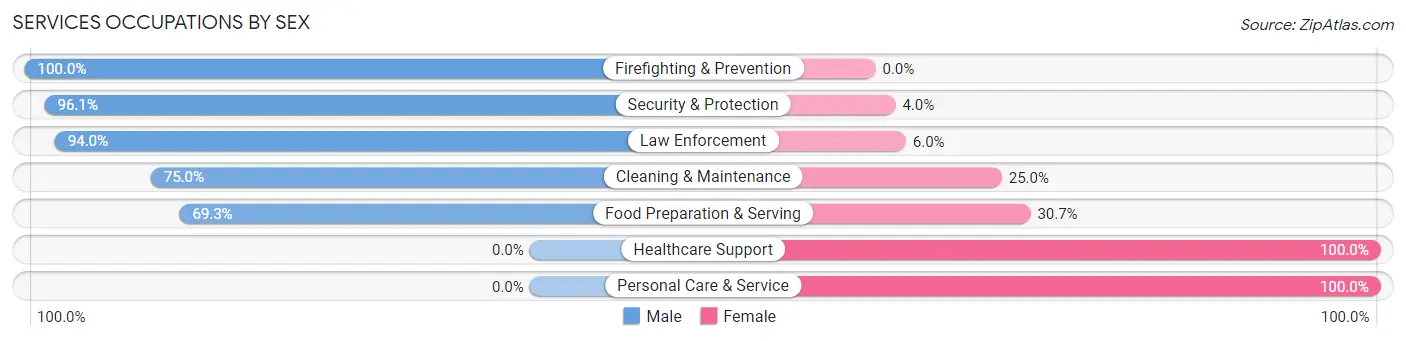
Services Occupations by Sex
Within the Services occupations in Lovettsville, the most male-oriented occupations are Firefighting & Prevention (100.0%), Security & Protection (96.1%), and Law Enforcement (94.0%), while the most female-oriented occupations are Healthcare Support (100.0%), Personal Care & Service (100.0%), and Food Preparation & Serving (30.7%).
| Occupation | Male | Female |
| Healthcare Support | 0 (0.0%) | 12 (100.0%) |
| Security & Protection | 73 (96.1%) | 3 (4.0%) |
| Firefighting & Prevention | 26 (100.0%) | 0 (0.0%) |
| Law Enforcement | 47 (94.0%) | 3 (6.0%) |
| Food Preparation & Serving | 52 (69.3%) | 23 (30.7%) |
| Cleaning & Maintenance | 6 (75.0%) | 2 (25.0%) |
| Personal Care & Service | 0 (0.0%) | 32 (100.0%) |
| Total (Category) | 131 (64.5%) | 72 (35.5%) |
| Total (Overall) | 718 (54.9%) | 589 (45.1%) |
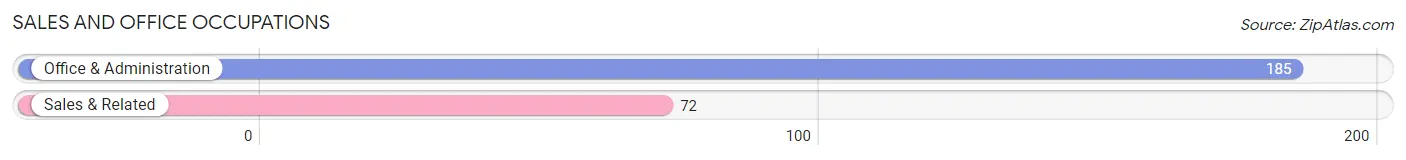
Sales and Office Occupations
The most common Sales and Office occupations in Lovettsville are Office & Administration (185 | 14.1%), and Sales & Related (72 | 5.5%).
Sales and Office Occupations by Sex
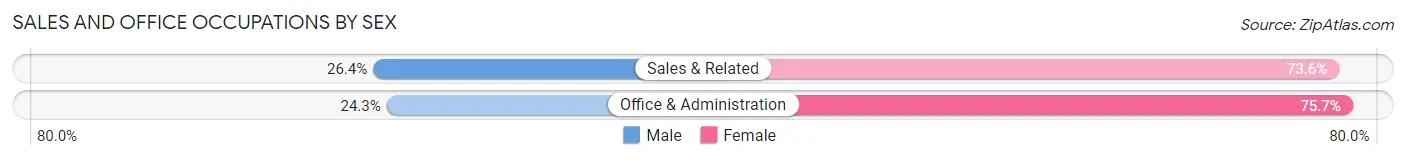
| Occupation | Male | Female |
| Sales & Related | 19 (26.4%) | 53 (73.6%) |
| Office & Administration | 45 (24.3%) | 140 (75.7%) |
| Total (Category) | 64 (24.9%) | 193 (75.1%) |
| Total (Overall) | 718 (54.9%) | 589 (45.1%) |
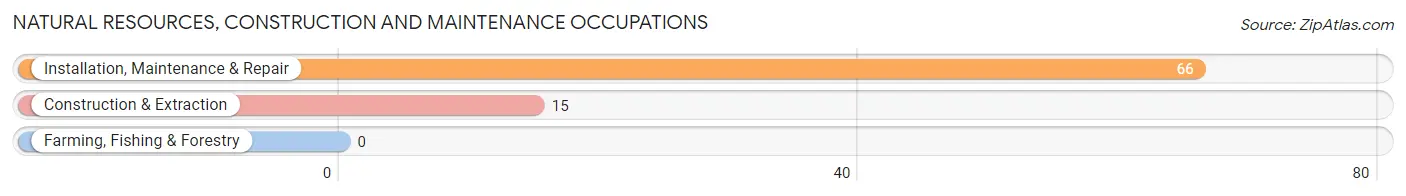
Natural Resources, Construction and Maintenance Occupations
The most common Natural Resources, Construction and Maintenance occupations in Lovettsville are Installation, Maintenance & Repair (66 | 5.1%), and Construction & Extraction (15 | 1.1%).
Natural Resources, Construction and Maintenance Occupations by Sex
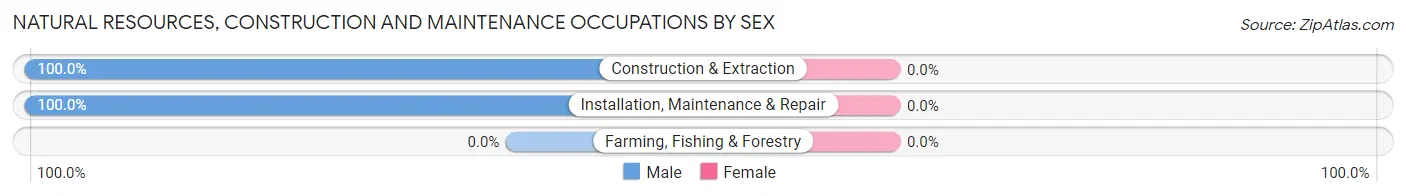
| Occupation | Male | Female |
| Farming, Fishing & Forestry | 0 (0.0%) | 0 (0.0%) |
| Construction & Extraction | 15 (100.0%) | 0 (0.0%) |
| Installation, Maintenance & Repair | 66 (100.0%) | 0 (0.0%) |
| Total (Category) | 81 (100.0%) | 0 (0.0%) |
| Total (Overall) | 718 (54.9%) | 589 (45.1%) |
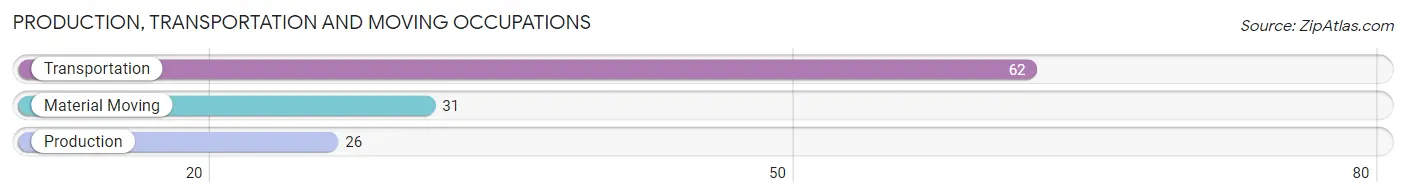
Production, Transportation and Moving Occupations
The most common Production, Transportation and Moving occupations in Lovettsville are Transportation (62 | 4.7%), Material Moving (31 | 2.4%), and Production (26 | 2.0%).
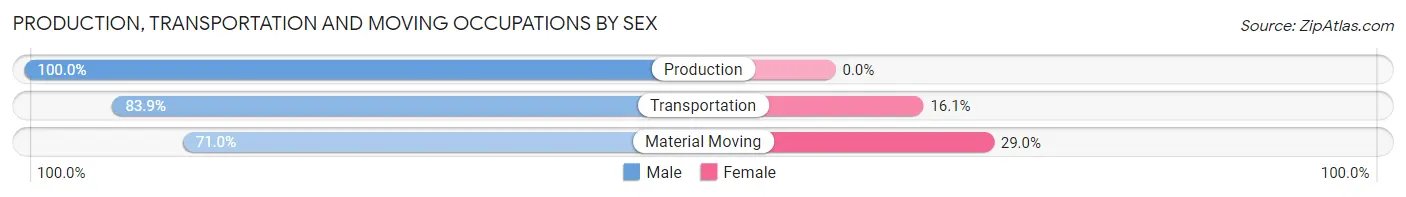
Production, Transportation and Moving Occupations by Sex
| Occupation | Male | Female |
| Production | 26 (100.0%) | 0 (0.0%) |
| Transportation | 52 (83.9%) | 10 (16.1%) |
| Material Moving | 22 (71.0%) | 9 (29.0%) |
| Total (Category) | 100 (84.0%) | 19 (16.0%) |
| Total (Overall) | 718 (54.9%) | 589 (45.1%) |
Employment Industries by Sex in Lovettsville
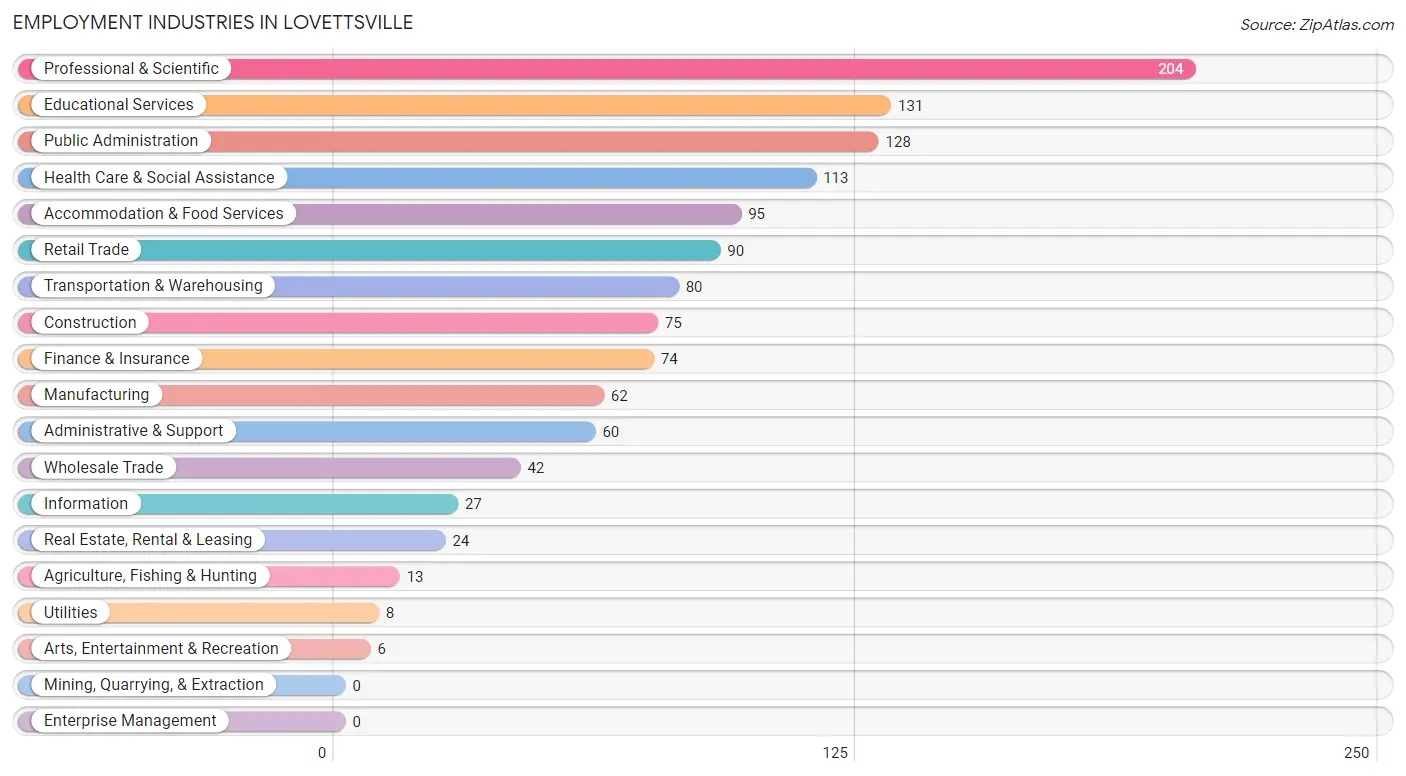
Employment Industries in Lovettsville
The major employment industries in Lovettsville include Professional & Scientific (204 | 15.6%), Educational Services (131 | 10.0%), Public Administration (128 | 9.8%), Health Care & Social Assistance (113 | 8.6%), and Accommodation & Food Services (95 | 7.3%).
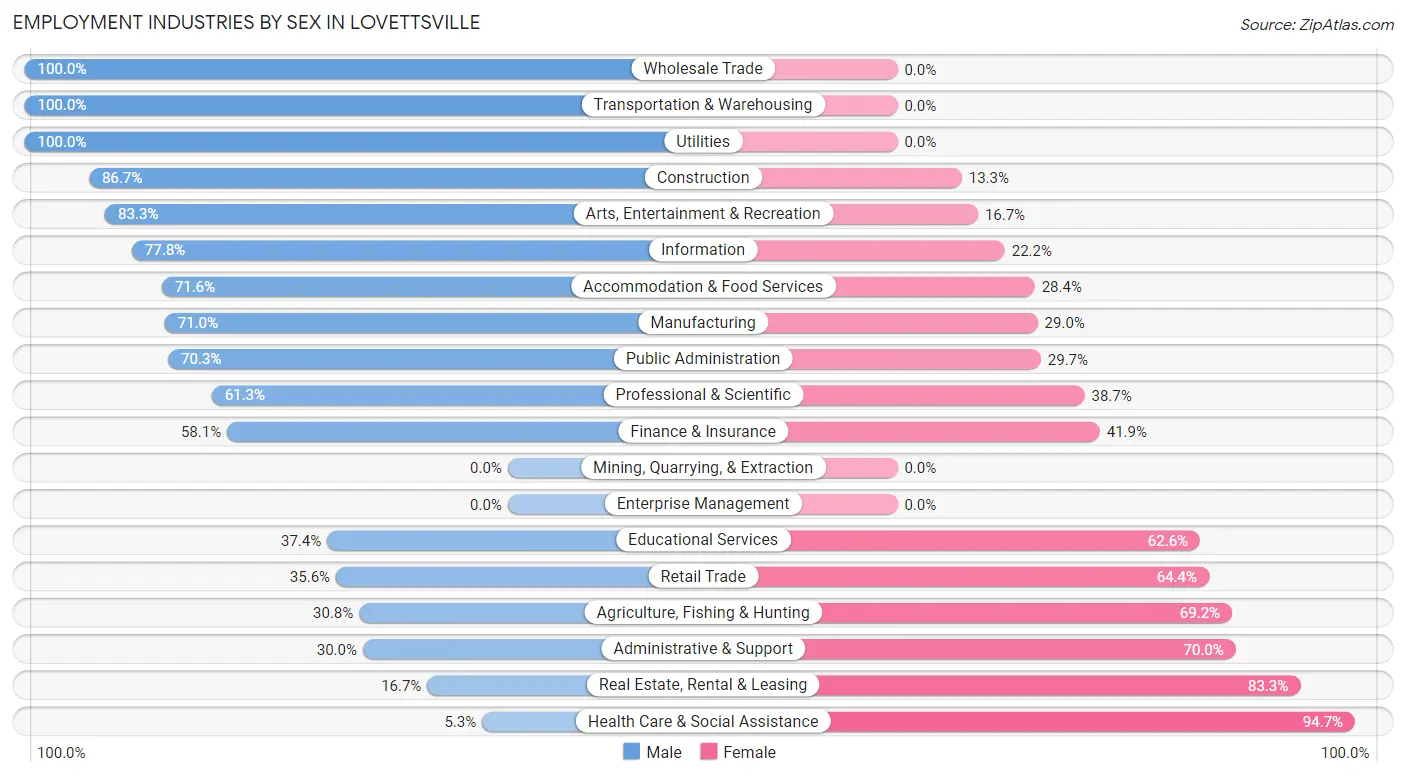
Employment Industries by Sex in Lovettsville
The Lovettsville industries that see more men than women are Wholesale Trade (100.0%), Transportation & Warehousing (100.0%), and Utilities (100.0%), whereas the industries that tend to have a higher number of women are Health Care & Social Assistance (94.7%), Real Estate, Rental & Leasing (83.3%), and Administrative & Support (70.0%).
| Industry | Male | Female |
| Agriculture, Fishing & Hunting | 4 (30.8%) | 9 (69.2%) |
| Mining, Quarrying, & Extraction | 0 (0.0%) | 0 (0.0%) |
| Construction | 65 (86.7%) | 10 (13.3%) |
| Manufacturing | 44 (71.0%) | 18 (29.0%) |
| Wholesale Trade | 42 (100.0%) | 0 (0.0%) |
| Retail Trade | 32 (35.6%) | 58 (64.4%) |
| Transportation & Warehousing | 80 (100.0%) | 0 (0.0%) |
| Utilities | 8 (100.0%) | 0 (0.0%) |
| Information | 21 (77.8%) | 6 (22.2%) |
| Finance & Insurance | 43 (58.1%) | 31 (41.9%) |
| Real Estate, Rental & Leasing | 4 (16.7%) | 20 (83.3%) |
| Professional & Scientific | 125 (61.3%) | 79 (38.7%) |
| Enterprise Management | 0 (0.0%) | 0 (0.0%) |
| Administrative & Support | 18 (30.0%) | 42 (70.0%) |
| Educational Services | 49 (37.4%) | 82 (62.6%) |
| Health Care & Social Assistance | 6 (5.3%) | 107 (94.7%) |
| Arts, Entertainment & Recreation | 5 (83.3%) | 1 (16.7%) |
| Accommodation & Food Services | 68 (71.6%) | 27 (28.4%) |
| Public Administration | 90 (70.3%) | 38 (29.7%) |
| Total | 718 (54.9%) | 589 (45.1%) |
Education in Lovettsville
School Enrollment in Lovettsville
The most common levels of schooling among the 913 students in Lovettsville are elementary school (259 | 28.4%), middle school (215 | 23.5%), and high school (191 | 20.9%).
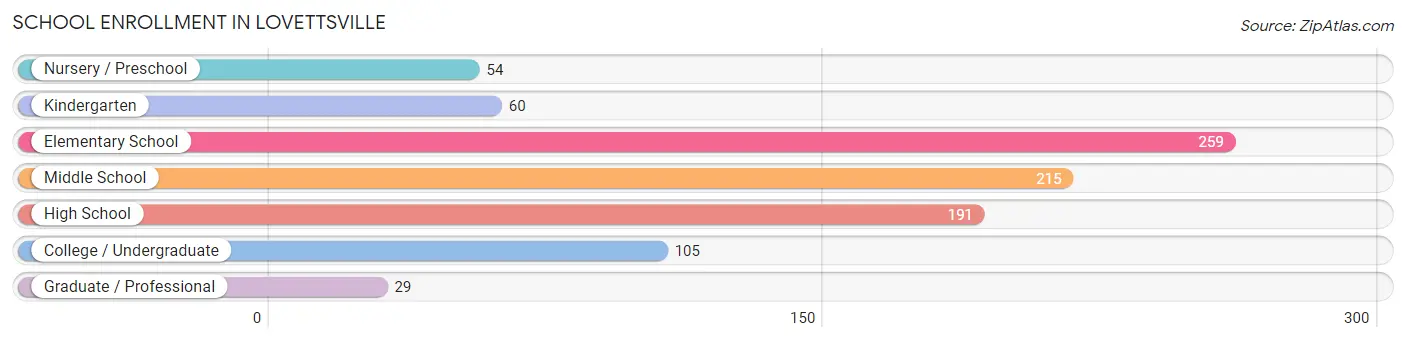
| School Level | # Students | % Students |
| Nursery / Preschool | 54 | 5.9% |
| Kindergarten | 60 | 6.6% |
| Elementary School | 259 | 28.4% |
| Middle School | 215 | 23.5% |
| High School | 191 | 20.9% |
| College / Undergraduate | 105 | 11.5% |
| Graduate / Professional | 29 | 3.2% |
| Total | 913 | 100.0% |
School Enrollment by Age by Funding Source in Lovettsville
Out of a total of 913 students who are enrolled in schools in Lovettsville, 183 (20.0%) attend a private institution, while the remaining 730 (80.0%) are enrolled in public schools. The age group of 3 to 4 year olds has the highest likelihood of being enrolled in private schools, with 23 (59.0% in the age bracket) enrolled. Conversely, the age group of 18 to 19 year olds has the lowest likelihood of being enrolled in a private school, with 51 (100.0% in the age bracket) attending a public institution.
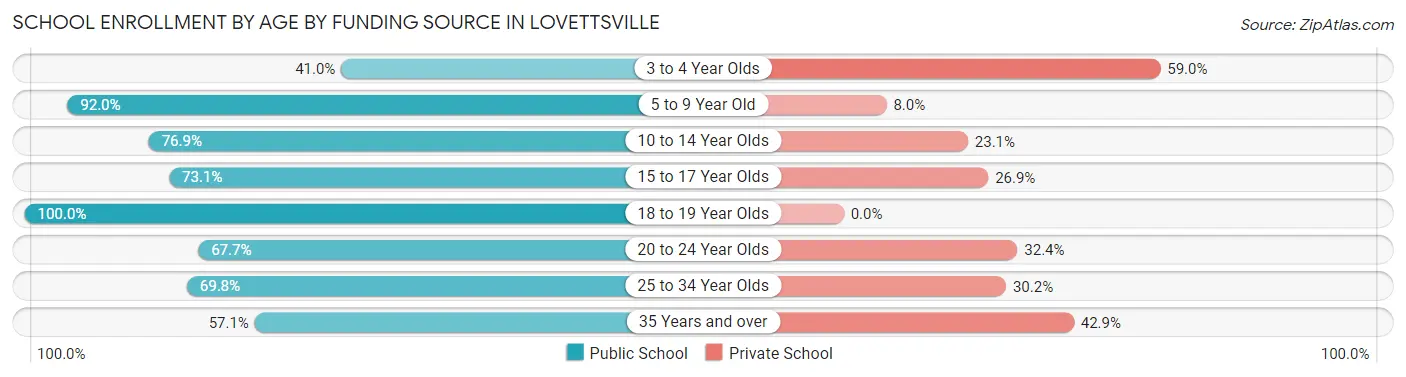
| Age Bracket | Public School | Private School |
| 3 to 4 Year Olds | 16 (41.0%) | 23 (59.0%) |
| 5 to 9 Year Old | 277 (92.0%) | 24 (8.0%) |
| 10 to 14 Year Olds | 226 (76.9%) | 68 (23.1%) |
| 15 to 17 Year Olds | 95 (73.1%) | 35 (26.9%) |
| 18 to 19 Year Olds | 51 (100.0%) | 0 (0.0%) |
| 20 to 24 Year Olds | 23 (67.6%) | 11 (32.4%) |
| 25 to 34 Year Olds | 30 (69.8%) | 13 (30.2%) |
| 35 Years and over | 12 (57.1%) | 9 (42.9%) |
| Total | 730 (80.0%) | 183 (20.0%) |
Educational Attainment by Field of Study in Lovettsville
Business (135 | 16.7%), education (105 | 13.0%), social sciences (82 | 10.2%), computers & mathematics (64 | 7.9%), and arts & humanities (59 | 7.3%) are the most common fields of study among 808 individuals in Lovettsville who have obtained a bachelor's degree or higher.
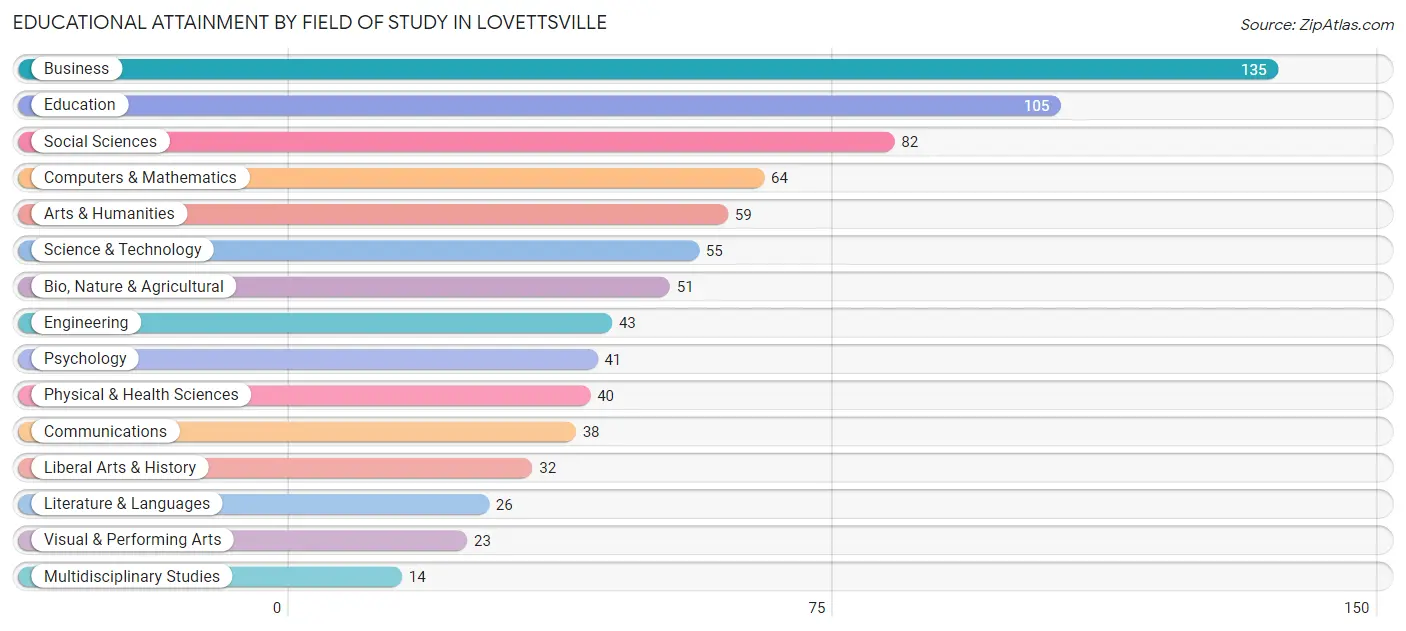
| Field of Study | # Graduates | % Graduates |
| Computers & Mathematics | 64 | 7.9% |
| Bio, Nature & Agricultural | 51 | 6.3% |
| Physical & Health Sciences | 40 | 5.0% |
| Psychology | 41 | 5.1% |
| Social Sciences | 82 | 10.2% |
| Engineering | 43 | 5.3% |
| Multidisciplinary Studies | 14 | 1.7% |
| Science & Technology | 55 | 6.8% |
| Business | 135 | 16.7% |
| Education | 105 | 13.0% |
| Literature & Languages | 26 | 3.2% |
| Liberal Arts & History | 32 | 4.0% |
| Visual & Performing Arts | 23 | 2.9% |
| Communications | 38 | 4.7% |
| Arts & Humanities | 59 | 7.3% |
| Total | 808 | 100.0% |
Transportation & Commute in Lovettsville
Vehicle Availability by Sex in Lovettsville
The most prevalent vehicle ownership categories in Lovettsville are males with 2 vehicles (286, accounting for 41.4%) and females with 2 vehicles (223, making up 49.0%).
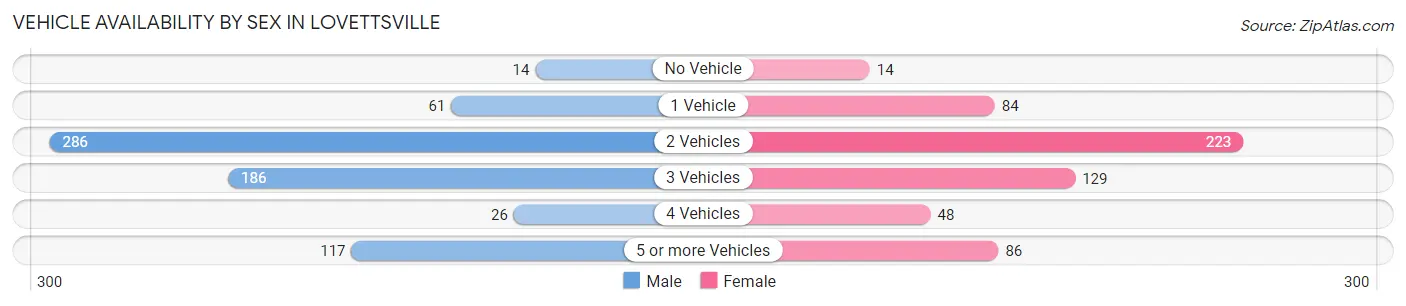
| Vehicles Available | Male | Female |
| No Vehicle | 14 (2.0%) | 14 (2.4%) |
| 1 Vehicle | 61 (8.8%) | 84 (14.4%) |
| 2 Vehicles | 286 (41.4%) | 223 (38.2%) |
| 3 Vehicles | 186 (27.0%) | 129 (22.1%) |
| 4 Vehicles | 26 (3.8%) | 48 (8.2%) |
| 5 or more Vehicles | 117 (17.0%) | 86 (14.7%) |
| Total | 690 (100.0%) | 584 (100.0%) |
Commute Time in Lovettsville
The most frequently occuring commute durations in Lovettsville are 45 to 59 minutes (240 commuters, 26.0%), 60 to 89 minutes (172 commuters, 18.6%), and 20 to 24 minutes (90 commuters, 9.8%).
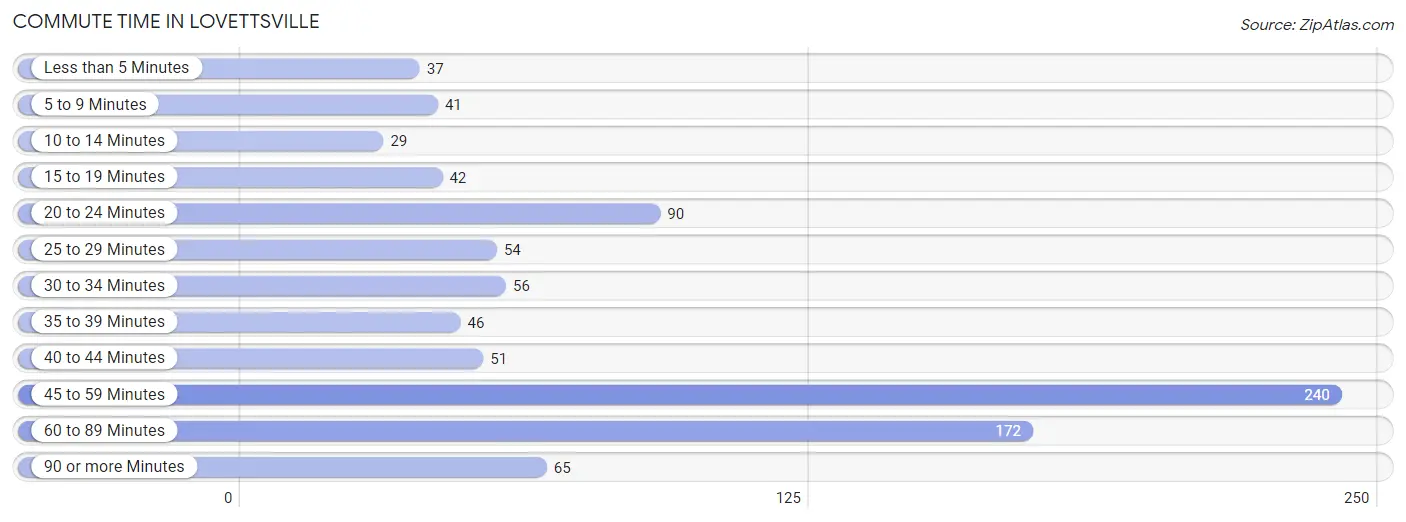
| Commute Time | # Commuters | % Commuters |
| Less than 5 Minutes | 37 | 4.0% |
| 5 to 9 Minutes | 41 | 4.4% |
| 10 to 14 Minutes | 29 | 3.1% |
| 15 to 19 Minutes | 42 | 4.5% |
| 20 to 24 Minutes | 90 | 9.8% |
| 25 to 29 Minutes | 54 | 5.9% |
| 30 to 34 Minutes | 56 | 6.1% |
| 35 to 39 Minutes | 46 | 5.0% |
| 40 to 44 Minutes | 51 | 5.5% |
| 45 to 59 Minutes | 240 | 26.0% |
| 60 to 89 Minutes | 172 | 18.6% |
| 90 or more Minutes | 65 | 7.0% |
Commute Time by Sex in Lovettsville
The most common commute times in Lovettsville are 60 to 89 minutes (137 commuters, 27.0%) for males and 45 to 59 minutes (126 commuters, 30.4%) for females.
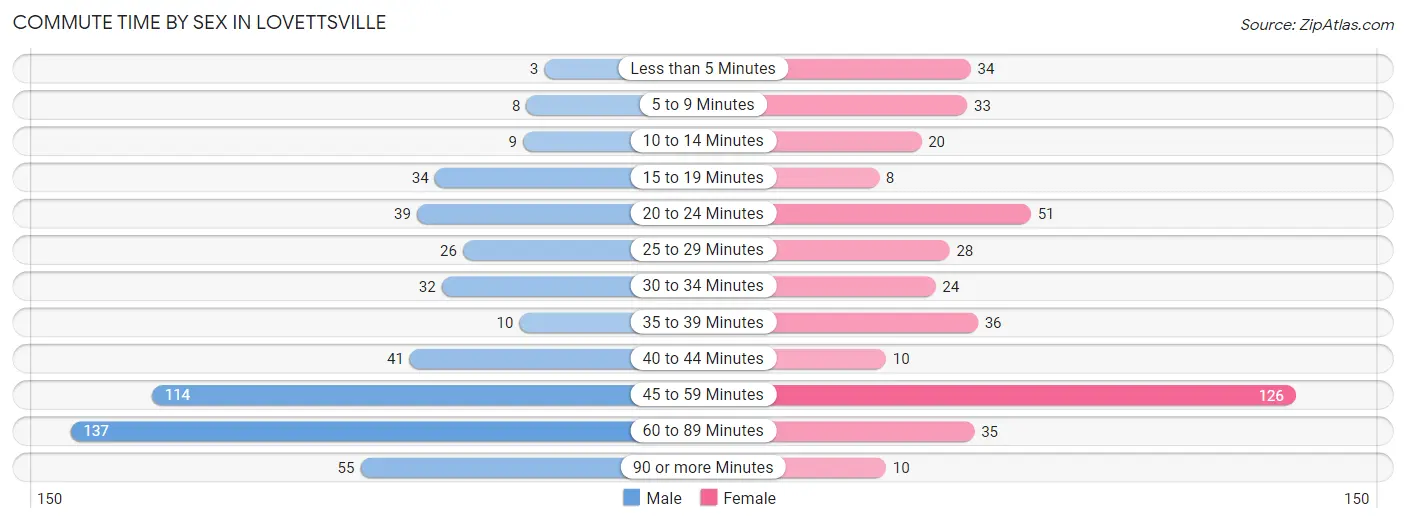
| Commute Time | Male | Female |
| Less than 5 Minutes | 3 (0.6%) | 34 (8.2%) |
| 5 to 9 Minutes | 8 (1.6%) | 33 (8.0%) |
| 10 to 14 Minutes | 9 (1.8%) | 20 (4.8%) |
| 15 to 19 Minutes | 34 (6.7%) | 8 (1.9%) |
| 20 to 24 Minutes | 39 (7.7%) | 51 (12.3%) |
| 25 to 29 Minutes | 26 (5.1%) | 28 (6.8%) |
| 30 to 34 Minutes | 32 (6.3%) | 24 (5.8%) |
| 35 to 39 Minutes | 10 (2.0%) | 36 (8.7%) |
| 40 to 44 Minutes | 41 (8.1%) | 10 (2.4%) |
| 45 to 59 Minutes | 114 (22.4%) | 126 (30.4%) |
| 60 to 89 Minutes | 137 (27.0%) | 35 (8.4%) |
| 90 or more Minutes | 55 (10.8%) | 10 (2.4%) |
Time of Departure to Work by Sex in Lovettsville
The most frequent times of departure to work in Lovettsville are 6:30 AM to 6:59 AM (92, 18.1%) for males and 7:30 AM to 7:59 AM (51, 12.3%) for females.
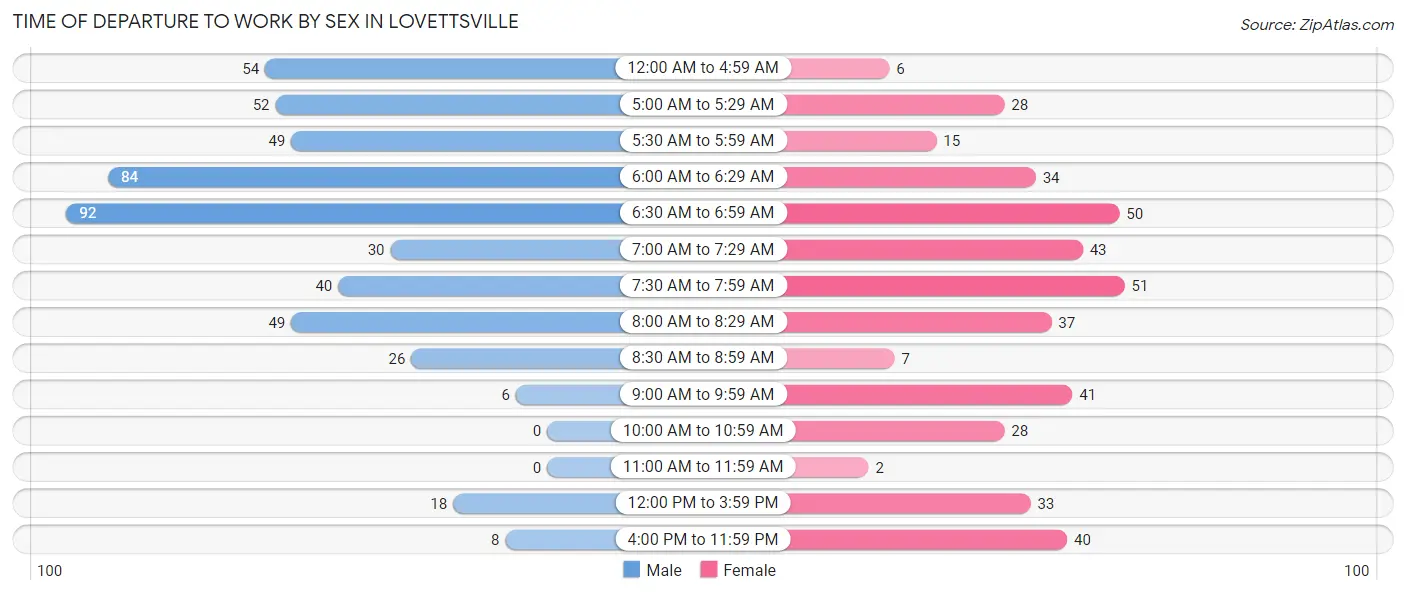
| Time of Departure | Male | Female |
| 12:00 AM to 4:59 AM | 54 (10.6%) | 6 (1.5%) |
| 5:00 AM to 5:29 AM | 52 (10.2%) | 28 (6.8%) |
| 5:30 AM to 5:59 AM | 49 (9.7%) | 15 (3.6%) |
| 6:00 AM to 6:29 AM | 84 (16.5%) | 34 (8.2%) |
| 6:30 AM to 6:59 AM | 92 (18.1%) | 50 (12.0%) |
| 7:00 AM to 7:29 AM | 30 (5.9%) | 43 (10.4%) |
| 7:30 AM to 7:59 AM | 40 (7.9%) | 51 (12.3%) |
| 8:00 AM to 8:29 AM | 49 (9.7%) | 37 (8.9%) |
| 8:30 AM to 8:59 AM | 26 (5.1%) | 7 (1.7%) |
| 9:00 AM to 9:59 AM | 6 (1.2%) | 41 (9.9%) |
| 10:00 AM to 10:59 AM | 0 (0.0%) | 28 (6.8%) |
| 11:00 AM to 11:59 AM | 0 (0.0%) | 2 (0.5%) |
| 12:00 PM to 3:59 PM | 18 (3.5%) | 33 (8.0%) |
| 4:00 PM to 11:59 PM | 8 (1.6%) | 40 (9.6%) |
| Total | 508 (100.0%) | 415 (100.0%) |
Housing Occupancy in Lovettsville
Occupancy by Ownership in Lovettsville
Of the total 747 dwellings in Lovettsville, owner-occupied units account for 642 (85.9%), while renter-occupied units make up 105 (14.1%).
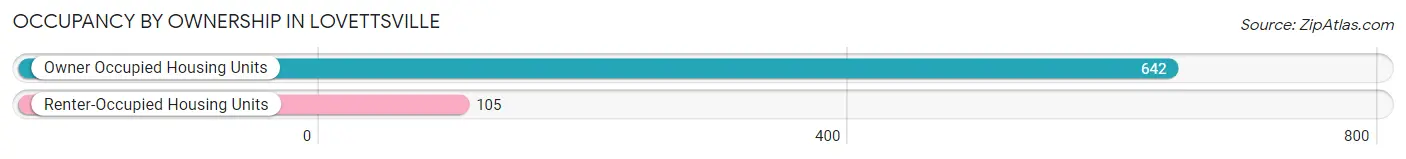
| Occupancy | # Housing Units | % Housing Units |
| Owner Occupied Housing Units | 642 | 85.9% |
| Renter-Occupied Housing Units | 105 | 14.1% |
| Total Occupied Housing Units | 747 | 100.0% |
Occupancy by Household Size in Lovettsville
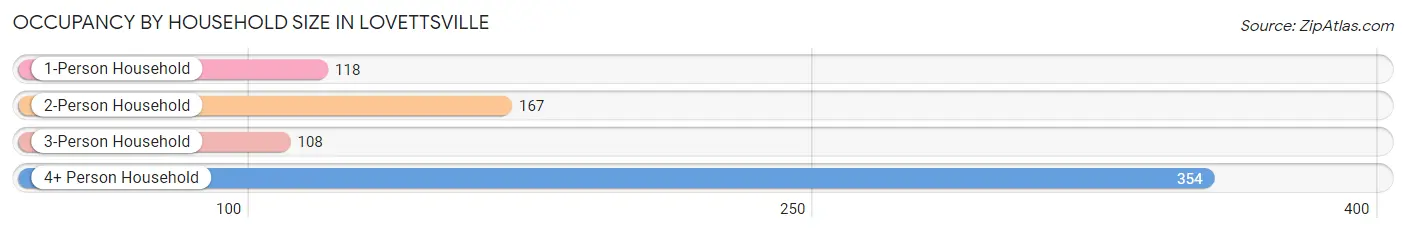
| Household Size | # Housing Units | % Housing Units |
| 1-Person Household | 118 | 15.8% |
| 2-Person Household | 167 | 22.4% |
| 3-Person Household | 108 | 14.5% |
| 4+ Person Household | 354 | 47.4% |
| Total Housing Units | 747 | 100.0% |
Occupancy by Ownership by Household Size in Lovettsville
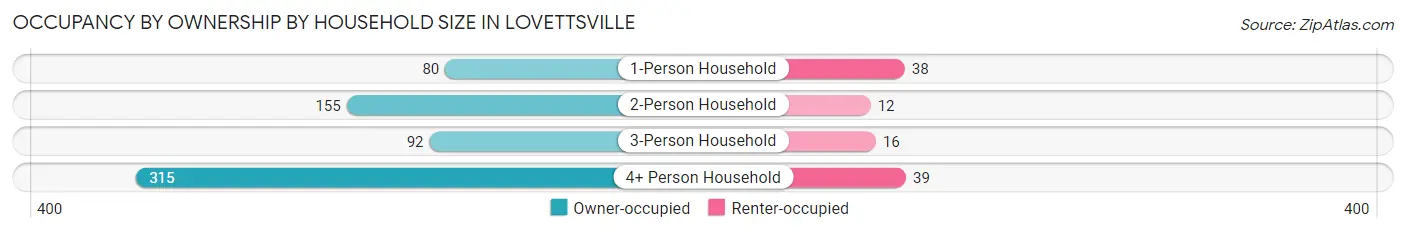
| Household Size | Owner-occupied | Renter-occupied |
| 1-Person Household | 80 (67.8%) | 38 (32.2%) |
| 2-Person Household | 155 (92.8%) | 12 (7.2%) |
| 3-Person Household | 92 (85.2%) | 16 (14.8%) |
| 4+ Person Household | 315 (89.0%) | 39 (11.0%) |
| Total Housing Units | 642 (85.9%) | 105 (14.1%) |
Occupancy by Educational Attainment in Lovettsville
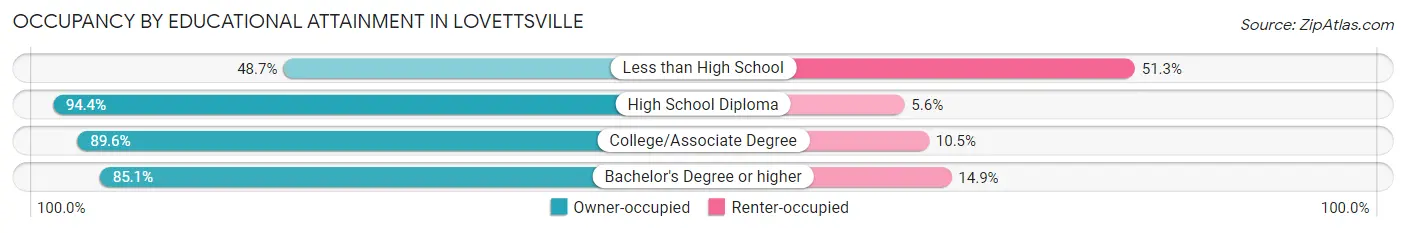
| Household Size | Owner-occupied | Renter-occupied |
| Less than High School | 19 (48.7%) | 20 (51.3%) |
| High School Diploma | 118 (94.4%) | 7 (5.6%) |
| College/Associate Degree | 180 (89.5%) | 21 (10.4%) |
| Bachelor's Degree or higher | 325 (85.1%) | 57 (14.9%) |
Occupancy by Age of Householder in Lovettsville
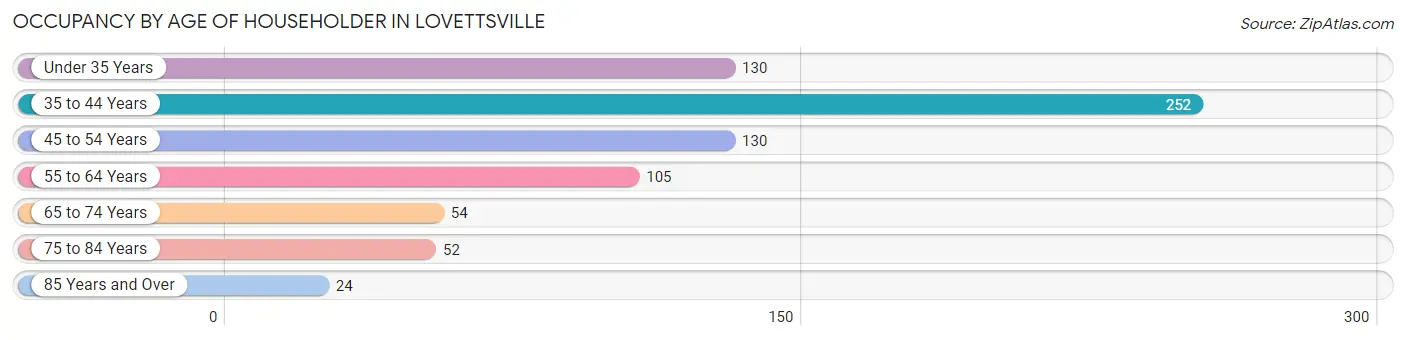
| Age Bracket | # Households | % Households |
| Under 35 Years | 130 | 17.4% |
| 35 to 44 Years | 252 | 33.7% |
| 45 to 54 Years | 130 | 17.4% |
| 55 to 64 Years | 105 | 14.1% |
| 65 to 74 Years | 54 | 7.2% |
| 75 to 84 Years | 52 | 7.0% |
| 85 Years and Over | 24 | 3.2% |
| Total | 747 | 100.0% |
Housing Finances in Lovettsville
Median Income by Occupancy in Lovettsville
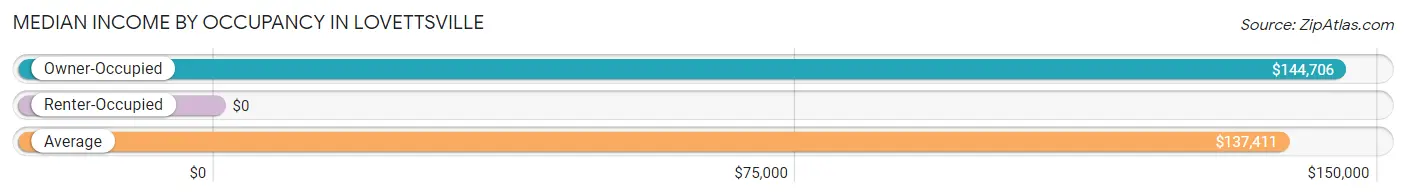
| Occupancy Type | # Households | Median Income |
| Owner-Occupied | 642 (85.9%) | $144,706 |
| Renter-Occupied | 105 (14.1%) | $0 |
| Average | 747 (100.0%) | $137,411 |
Occupancy by Householder Income Bracket in Lovettsville
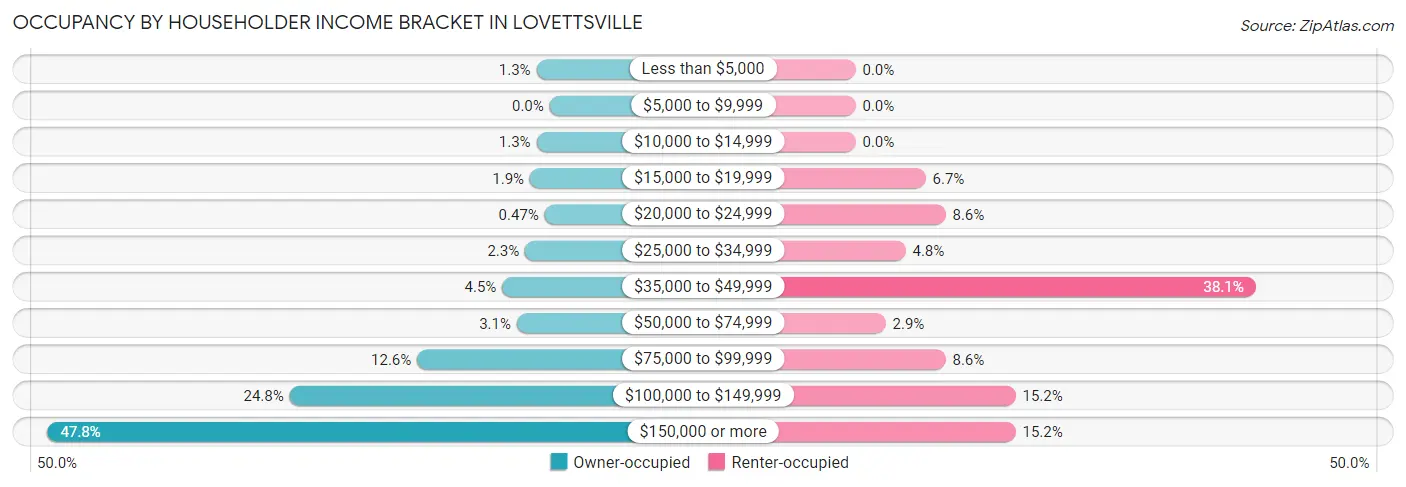
| Income Bracket | Owner-occupied | Renter-occupied |
| Less than $5,000 | 8 (1.3%) | 0 (0.0%) |
| $5,000 to $9,999 | 0 (0.0%) | 0 (0.0%) |
| $10,000 to $14,999 | 8 (1.3%) | 0 (0.0%) |
| $15,000 to $19,999 | 12 (1.9%) | 7 (6.7%) |
| $20,000 to $24,999 | 3 (0.5%) | 9 (8.6%) |
| $25,000 to $34,999 | 15 (2.3%) | 5 (4.8%) |
| $35,000 to $49,999 | 29 (4.5%) | 40 (38.1%) |
| $50,000 to $74,999 | 20 (3.1%) | 3 (2.9%) |
| $75,000 to $99,999 | 81 (12.6%) | 9 (8.6%) |
| $100,000 to $149,999 | 159 (24.8%) | 16 (15.2%) |
| $150,000 or more | 307 (47.8%) | 16 (15.2%) |
| Total | 642 (100.0%) | 105 (100.0%) |
Monthly Housing Cost Tiers in Lovettsville
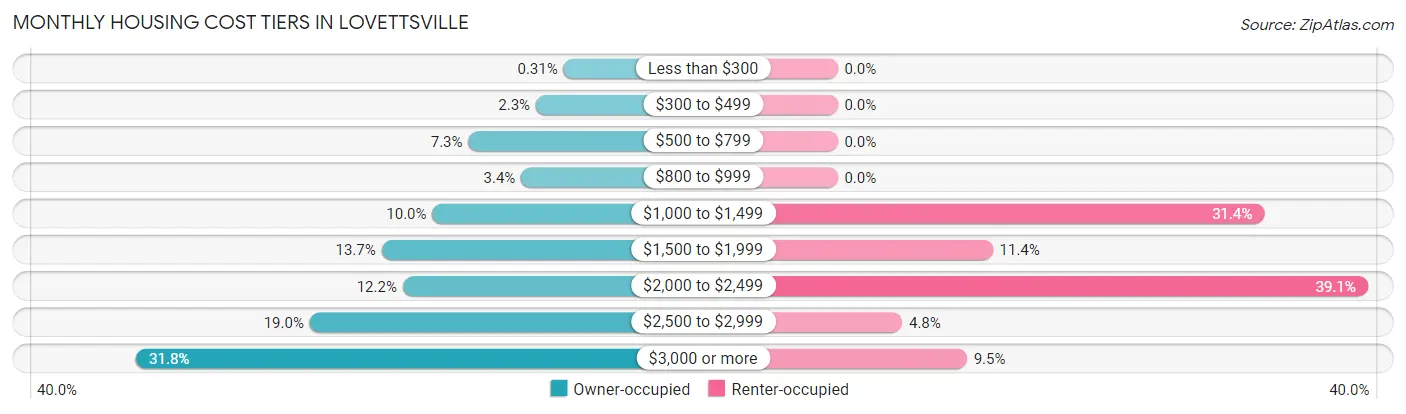
| Monthly Cost | Owner-occupied | Renter-occupied |
| Less than $300 | 2 (0.3%) | 0 (0.0%) |
| $300 to $499 | 15 (2.3%) | 0 (0.0%) |
| $500 to $799 | 47 (7.3%) | 0 (0.0%) |
| $800 to $999 | 22 (3.4%) | 0 (0.0%) |
| $1,000 to $1,499 | 64 (10.0%) | 33 (31.4%) |
| $1,500 to $1,999 | 88 (13.7%) | 12 (11.4%) |
| $2,000 to $2,499 | 78 (12.1%) | 41 (39.1%) |
| $2,500 to $2,999 | 122 (19.0%) | 5 (4.8%) |
| $3,000 or more | 204 (31.8%) | 10 (9.5%) |
| Total | 642 (100.0%) | 105 (100.0%) |
Physical Housing Characteristics in Lovettsville
Housing Structures in Lovettsville
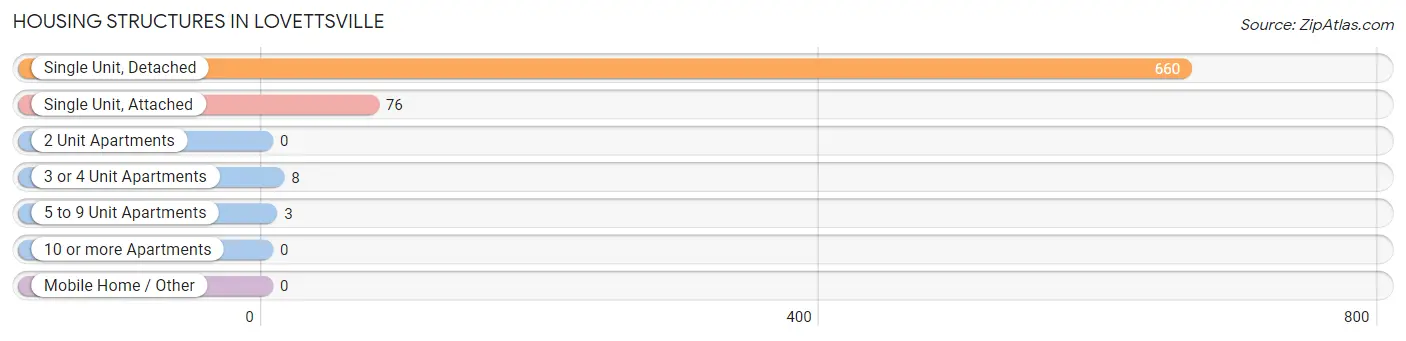
| Structure Type | # Housing Units | % Housing Units |
| Single Unit, Detached | 660 | 88.3% |
| Single Unit, Attached | 76 | 10.2% |
| 2 Unit Apartments | 0 | 0.0% |
| 3 or 4 Unit Apartments | 8 | 1.1% |
| 5 to 9 Unit Apartments | 3 | 0.4% |
| 10 or more Apartments | 0 | 0.0% |
| Mobile Home / Other | 0 | 0.0% |
| Total | 747 | 100.0% |
Housing Structures by Occupancy in Lovettsville
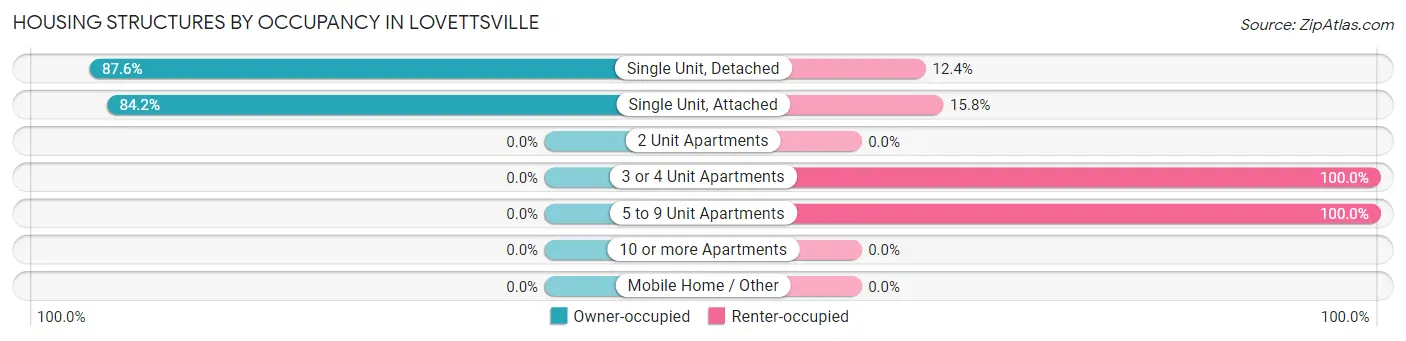
| Structure Type | Owner-occupied | Renter-occupied |
| Single Unit, Detached | 578 (87.6%) | 82 (12.4%) |
| Single Unit, Attached | 64 (84.2%) | 12 (15.8%) |
| 2 Unit Apartments | 0 (0.0%) | 0 (0.0%) |
| 3 or 4 Unit Apartments | 0 (0.0%) | 8 (100.0%) |
| 5 to 9 Unit Apartments | 0 (0.0%) | 3 (100.0%) |
| 10 or more Apartments | 0 (0.0%) | 0 (0.0%) |
| Mobile Home / Other | 0 (0.0%) | 0 (0.0%) |
| Total | 642 (85.9%) | 105 (14.1%) |
Housing Structures by Number of Rooms in Lovettsville
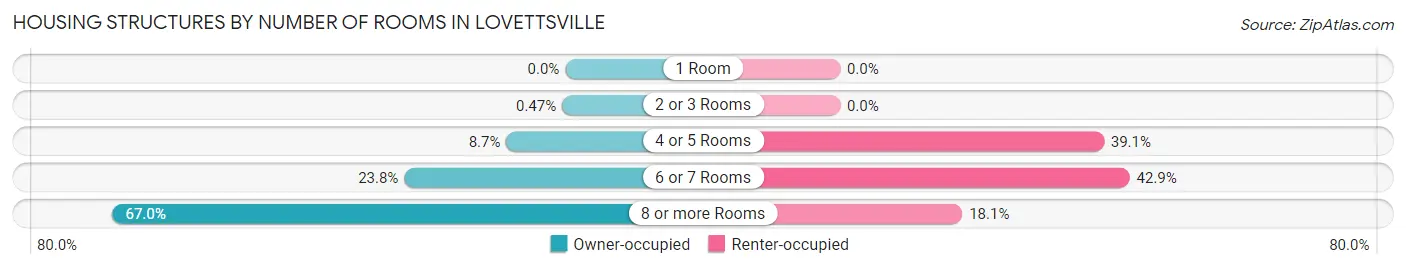
| Number of Rooms | Owner-occupied | Renter-occupied |
| 1 Room | 0 (0.0%) | 0 (0.0%) |
| 2 or 3 Rooms | 3 (0.5%) | 0 (0.0%) |
| 4 or 5 Rooms | 56 (8.7%) | 41 (39.1%) |
| 6 or 7 Rooms | 153 (23.8%) | 45 (42.9%) |
| 8 or more Rooms | 430 (67.0%) | 19 (18.1%) |
| Total | 642 (100.0%) | 105 (100.0%) |
Housing Structure by Heating Type in Lovettsville
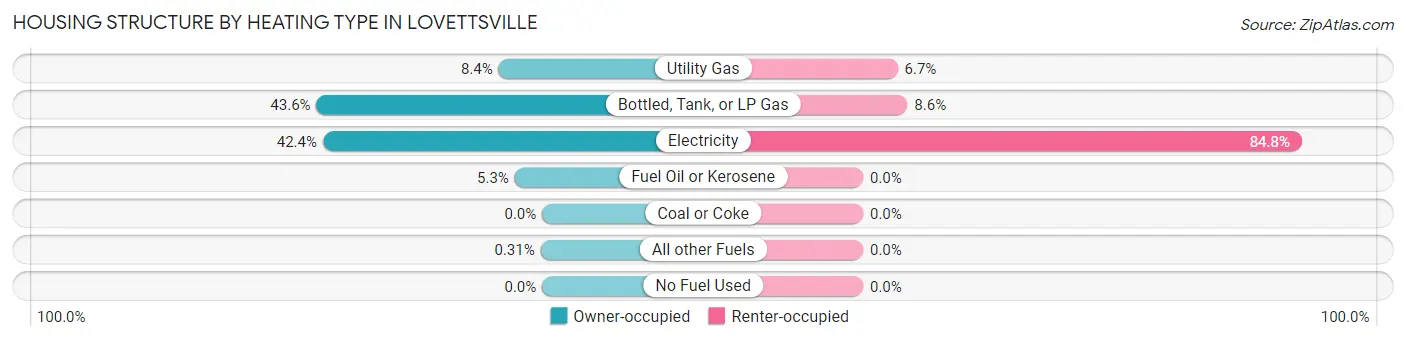
| Heating Type | Owner-occupied | Renter-occupied |
| Utility Gas | 54 (8.4%) | 7 (6.7%) |
| Bottled, Tank, or LP Gas | 280 (43.6%) | 9 (8.6%) |
| Electricity | 272 (42.4%) | 89 (84.8%) |
| Fuel Oil or Kerosene | 34 (5.3%) | 0 (0.0%) |
| Coal or Coke | 0 (0.0%) | 0 (0.0%) |
| All other Fuels | 2 (0.3%) | 0 (0.0%) |
| No Fuel Used | 0 (0.0%) | 0 (0.0%) |
| Total | 642 (100.0%) | 105 (100.0%) |
Household Vehicle Usage in Lovettsville
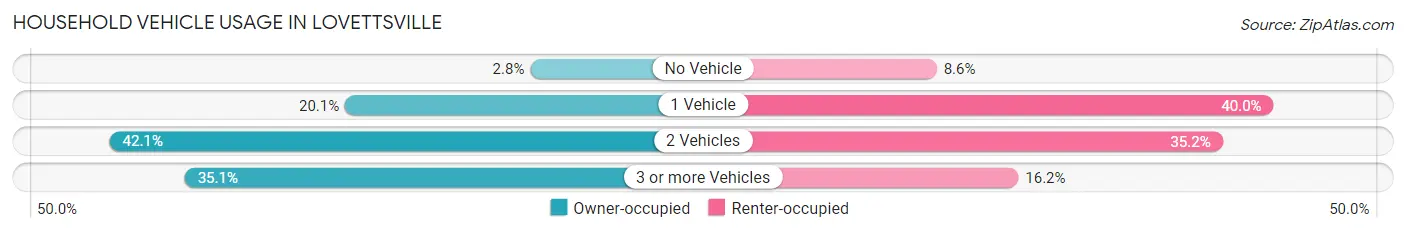
| Vehicles per Household | Owner-occupied | Renter-occupied |
| No Vehicle | 18 (2.8%) | 9 (8.6%) |
| 1 Vehicle | 129 (20.1%) | 42 (40.0%) |
| 2 Vehicles | 270 (42.1%) | 37 (35.2%) |
| 3 or more Vehicles | 225 (35.0%) | 17 (16.2%) |
| Total | 642 (100.0%) | 105 (100.0%) |
Real Estate & Mortgages in Lovettsville
Real Estate and Mortgage Overview in Lovettsville
| Characteristic | Without Mortgage | With Mortgage |
| Housing Units | 101 | 541 |
| Median Property Value | $510,400 | $461,300 |
| Median Household Income | $128,125 | $273 |
| Monthly Housing Costs | $768 | $199 |
| Real Estate Taxes | $5,265 | $21 |
Property Value by Mortgage Status in Lovettsville
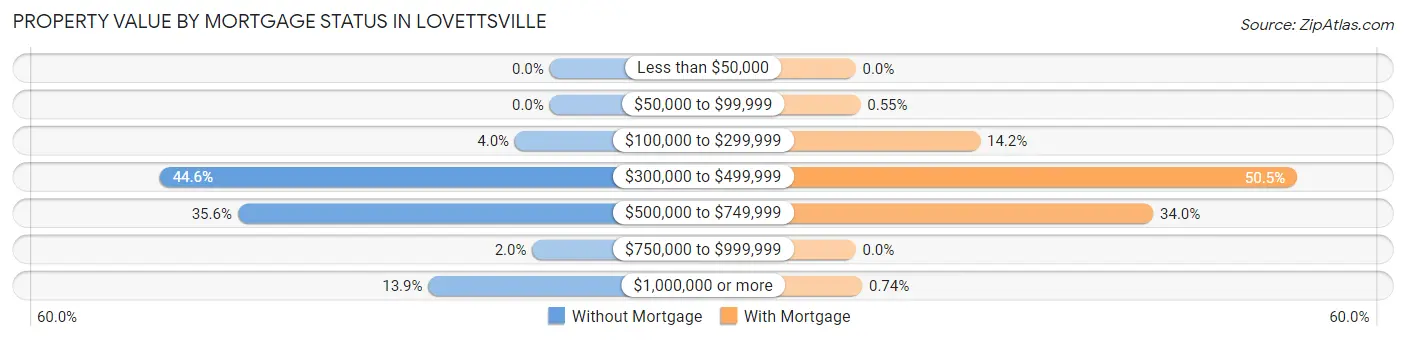
| Property Value | Without Mortgage | With Mortgage |
| Less than $50,000 | 0 (0.0%) | 0 (0.0%) |
| $50,000 to $99,999 | 0 (0.0%) | 3 (0.5%) |
| $100,000 to $299,999 | 4 (4.0%) | 77 (14.2%) |
| $300,000 to $499,999 | 45 (44.6%) | 273 (50.5%) |
| $500,000 to $749,999 | 36 (35.6%) | 184 (34.0%) |
| $750,000 to $999,999 | 2 (2.0%) | 0 (0.0%) |
| $1,000,000 or more | 14 (13.9%) | 4 (0.7%) |
| Total | 101 (100.0%) | 541 (100.0%) |
Household Income by Mortgage Status in Lovettsville
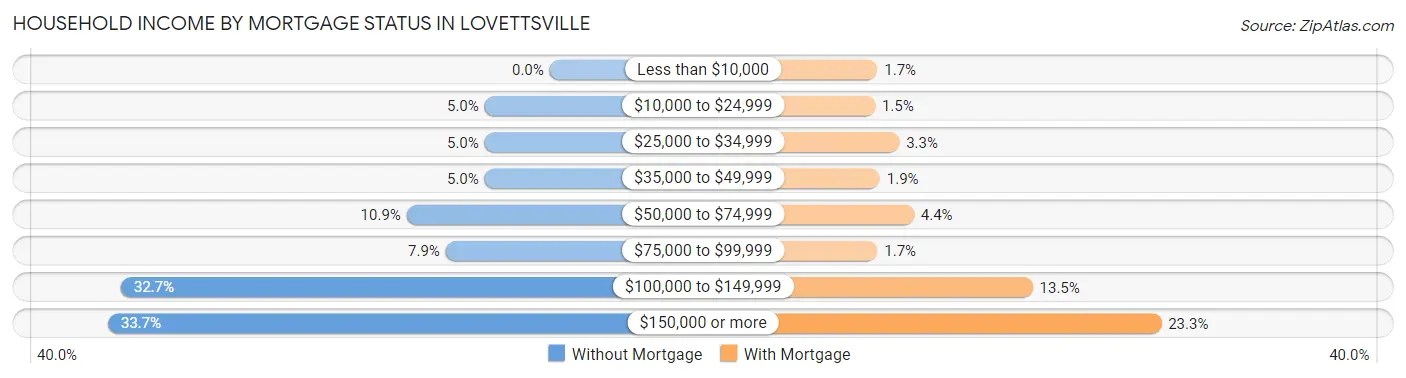
| Household Income | Without Mortgage | With Mortgage |
| Less than $10,000 | 0 (0.0%) | 9 (1.7%) |
| $10,000 to $24,999 | 5 (5.0%) | 8 (1.5%) |
| $25,000 to $34,999 | 5 (5.0%) | 18 (3.3%) |
| $35,000 to $49,999 | 5 (5.0%) | 10 (1.8%) |
| $50,000 to $74,999 | 11 (10.9%) | 24 (4.4%) |
| $75,000 to $99,999 | 8 (7.9%) | 9 (1.7%) |
| $100,000 to $149,999 | 33 (32.7%) | 73 (13.5%) |
| $150,000 or more | 34 (33.7%) | 126 (23.3%) |
| Total | 101 (100.0%) | 541 (100.0%) |
Property Value to Household Income Ratio in Lovettsville
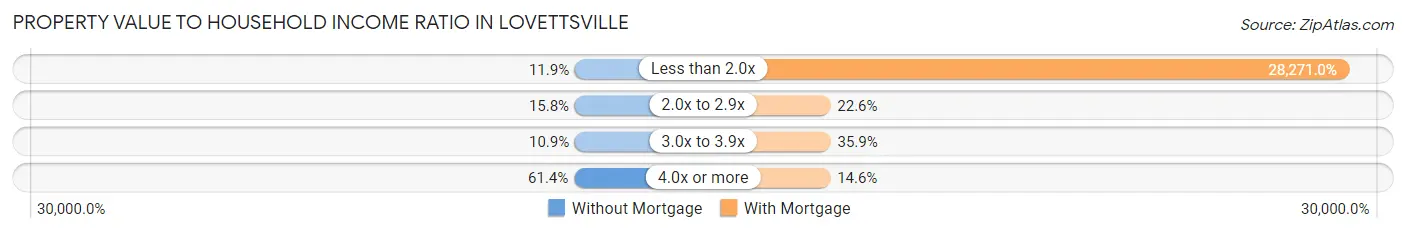
| Value-to-Income Ratio | Without Mortgage | With Mortgage |
| Less than 2.0x | 12 (11.9%) | 152,946 (28,271.0%) |
| 2.0x to 2.9x | 16 (15.8%) | 122 (22.6%) |
| 3.0x to 3.9x | 11 (10.9%) | 194 (35.9%) |
| 4.0x or more | 62 (61.4%) | 79 (14.6%) |
| Total | 101 (100.0%) | 541 (100.0%) |
Real Estate Taxes by Mortgage Status in Lovettsville
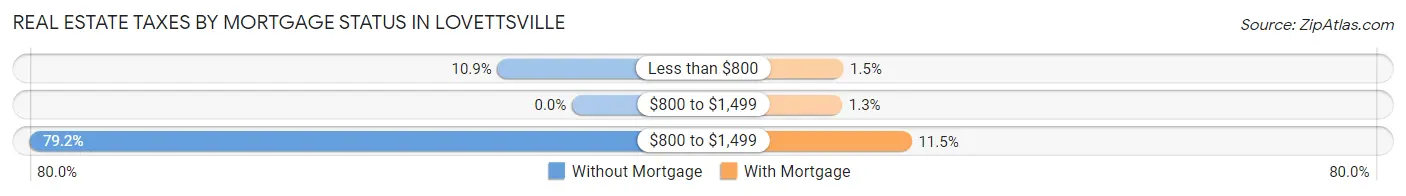
| Property Taxes | Without Mortgage | With Mortgage |
| Less than $800 | 11 (10.9%) | 8 (1.5%) |
| $800 to $1,499 | 0 (0.0%) | 7 (1.3%) |
| $800 to $1,499 | 80 (79.2%) | 62 (11.5%) |
| Total | 101 (100.0%) | 541 (100.0%) |
Health & Disability in Lovettsville
Health Insurance Coverage by Age in Lovettsville
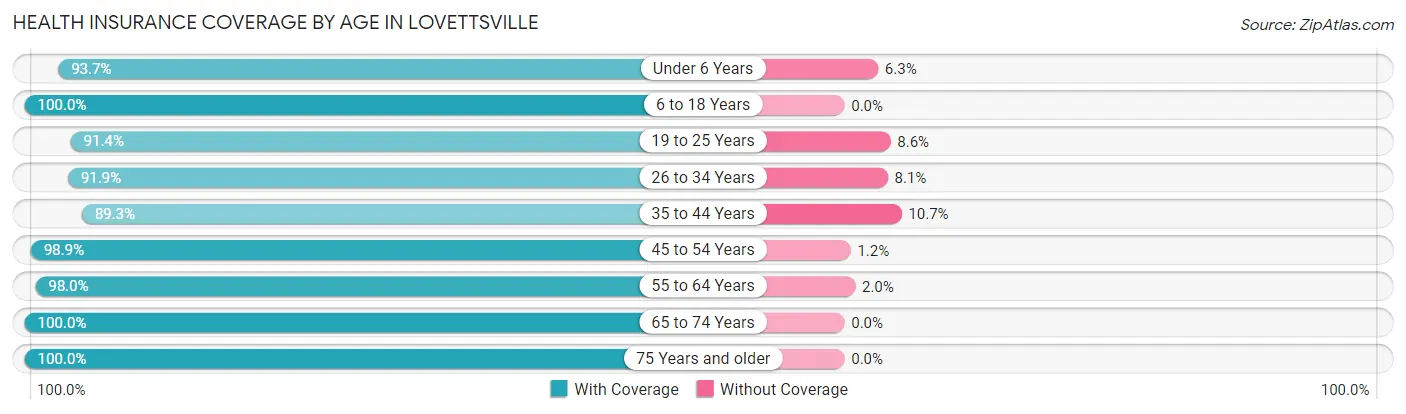
| Age Bracket | With Coverage | Without Coverage |
| Under 6 Years | 314 (93.7%) | 21 (6.3%) |
| 6 to 18 Years | 712 (100.0%) | 0 (0.0%) |
| 19 to 25 Years | 117 (91.4%) | 11 (8.6%) |
| 26 to 34 Years | 296 (91.9%) | 26 (8.1%) |
| 35 to 44 Years | 436 (89.3%) | 52 (10.7%) |
| 45 to 54 Years | 259 (98.9%) | 3 (1.1%) |
| 55 to 64 Years | 196 (98.0%) | 4 (2.0%) |
| 65 to 74 Years | 130 (100.0%) | 0 (0.0%) |
| 75 Years and older | 89 (100.0%) | 0 (0.0%) |
| Total | 2,549 (95.6%) | 117 (4.4%) |
Health Insurance Coverage by Citizenship Status in Lovettsville
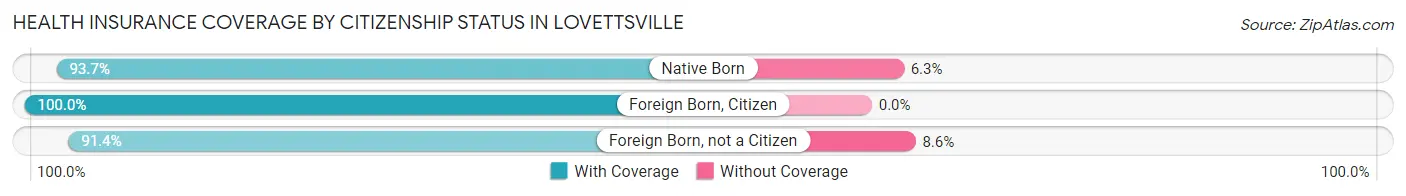
| Citizenship Status | With Coverage | Without Coverage |
| Native Born | 314 (93.7%) | 21 (6.3%) |
| Foreign Born, Citizen | 712 (100.0%) | 0 (0.0%) |
| Foreign Born, not a Citizen | 117 (91.4%) | 11 (8.6%) |
Health Insurance Coverage by Household Income in Lovettsville
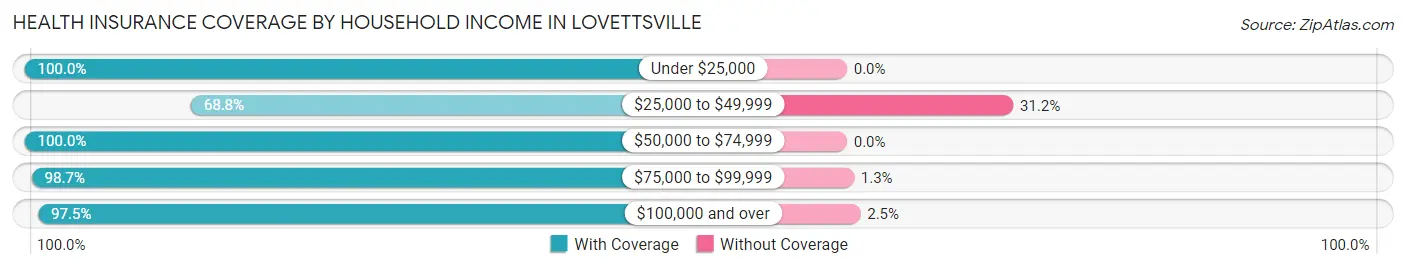
| Household Income | With Coverage | Without Coverage |
| Under $25,000 | 94 (100.0%) | 0 (0.0%) |
| $25,000 to $49,999 | 137 (68.8%) | 62 (31.2%) |
| $50,000 to $74,999 | 55 (100.0%) | 0 (0.0%) |
| $75,000 to $99,999 | 298 (98.7%) | 4 (1.3%) |
| $100,000 and over | 1,965 (97.5%) | 51 (2.5%) |
Public vs Private Health Insurance Coverage by Age in Lovettsville
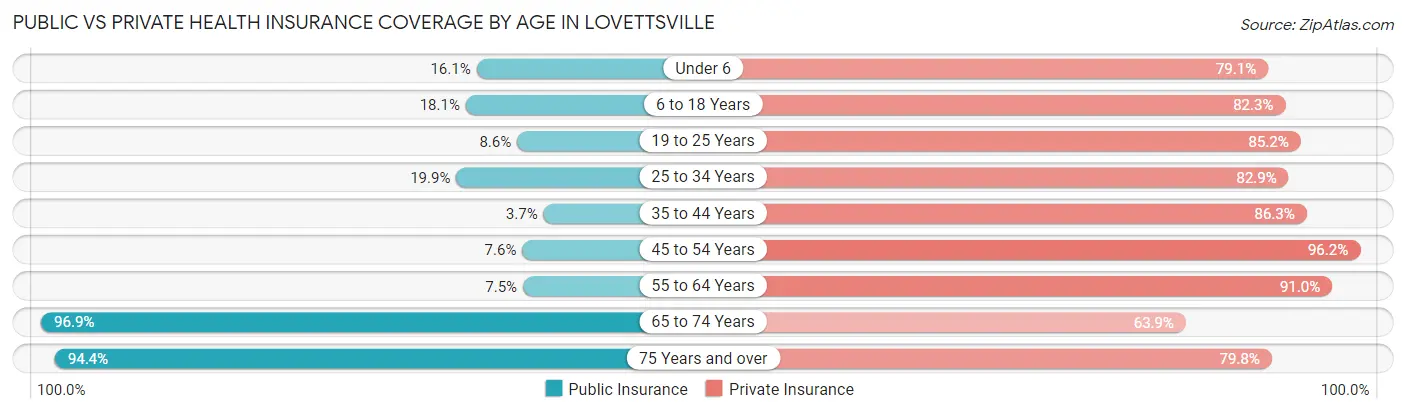
| Age Bracket | Public Insurance | Private Insurance |
| Under 6 | 54 (16.1%) | 265 (79.1%) |
| 6 to 18 Years | 129 (18.1%) | 586 (82.3%) |
| 19 to 25 Years | 11 (8.6%) | 109 (85.2%) |
| 25 to 34 Years | 64 (19.9%) | 267 (82.9%) |
| 35 to 44 Years | 18 (3.7%) | 421 (86.3%) |
| 45 to 54 Years | 20 (7.6%) | 252 (96.2%) |
| 55 to 64 Years | 15 (7.5%) | 182 (91.0%) |
| 65 to 74 Years | 126 (96.9%) | 83 (63.8%) |
| 75 Years and over | 84 (94.4%) | 71 (79.8%) |
| Total | 521 (19.5%) | 2,236 (83.9%) |
Disability Status by Sex by Age in Lovettsville
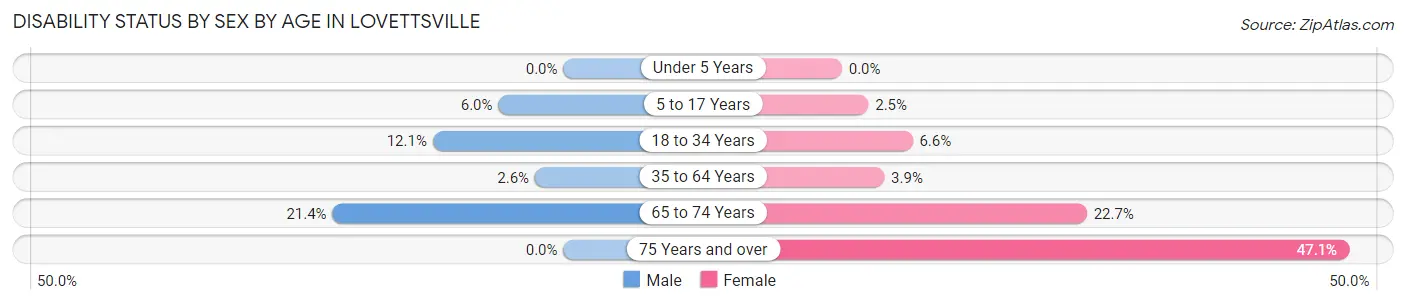
| Age Bracket | Male | Female |
| Under 5 Years | 0 (0.0%) | 0 (0.0%) |
| 5 to 17 Years | 22 (6.0%) | 9 (2.5%) |
| 18 to 34 Years | 28 (12.1%) | 17 (6.6%) |
| 35 to 64 Years | 13 (2.6%) | 18 (3.9%) |
| 65 to 74 Years | 9 (21.4%) | 20 (22.7%) |
| 75 Years and over | 0 (0.0%) | 32 (47.1%) |
Disability Class by Sex by Age in Lovettsville
Disability Class: Hearing Difficulty
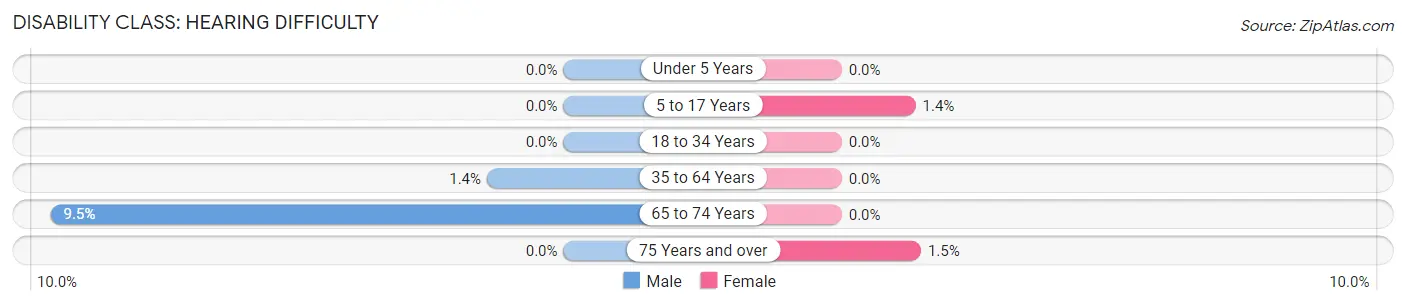
| Age Bracket | Male | Female |
| Under 5 Years | 0 (0.0%) | 0 (0.0%) |
| 5 to 17 Years | 0 (0.0%) | 5 (1.4%) |
| 18 to 34 Years | 0 (0.0%) | 0 (0.0%) |
| 35 to 64 Years | 7 (1.4%) | 0 (0.0%) |
| 65 to 74 Years | 4 (9.5%) | 0 (0.0%) |
| 75 Years and over | 0 (0.0%) | 1 (1.5%) |
Disability Class: Vision Difficulty
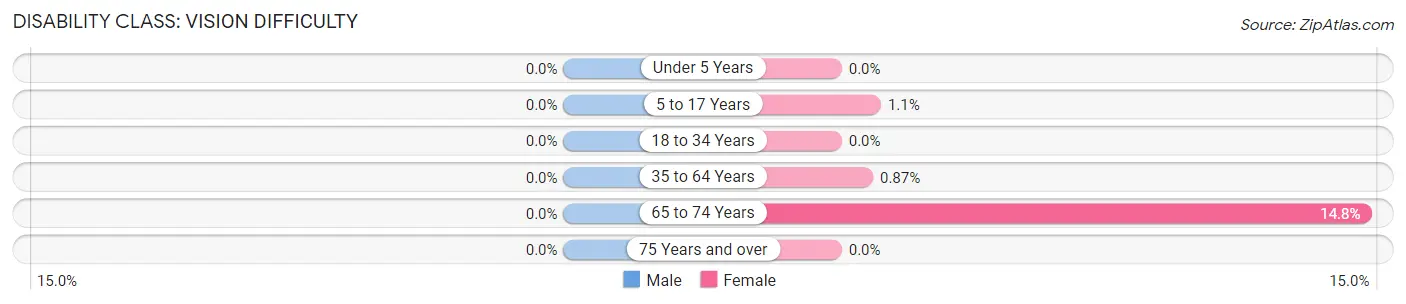
| Age Bracket | Male | Female |
| Under 5 Years | 0 (0.0%) | 0 (0.0%) |
| 5 to 17 Years | 0 (0.0%) | 4 (1.1%) |
| 18 to 34 Years | 0 (0.0%) | 0 (0.0%) |
| 35 to 64 Years | 0 (0.0%) | 4 (0.9%) |
| 65 to 74 Years | 0 (0.0%) | 13 (14.8%) |
| 75 Years and over | 0 (0.0%) | 0 (0.0%) |
Disability Class: Cognitive Difficulty
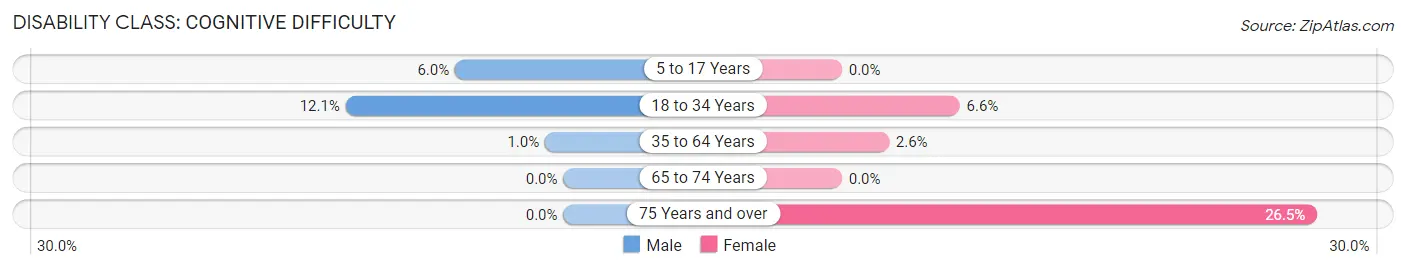
| Age Bracket | Male | Female |
| 5 to 17 Years | 22 (6.0%) | 0 (0.0%) |
| 18 to 34 Years | 28 (12.1%) | 17 (6.6%) |
| 35 to 64 Years | 5 (1.0%) | 12 (2.6%) |
| 65 to 74 Years | 0 (0.0%) | 0 (0.0%) |
| 75 Years and over | 0 (0.0%) | 18 (26.5%) |
Disability Class: Ambulatory Difficulty
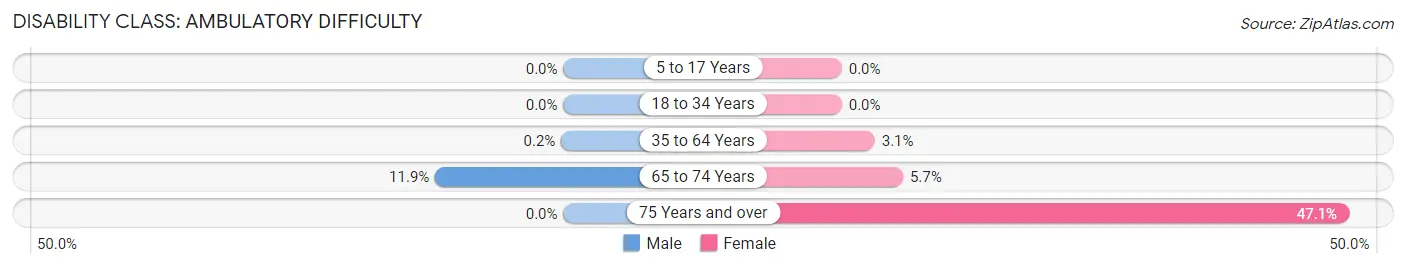
| Age Bracket | Male | Female |
| 5 to 17 Years | 0 (0.0%) | 0 (0.0%) |
| 18 to 34 Years | 0 (0.0%) | 0 (0.0%) |
| 35 to 64 Years | 1 (0.2%) | 14 (3.1%) |
| 65 to 74 Years | 5 (11.9%) | 5 (5.7%) |
| 75 Years and over | 0 (0.0%) | 32 (47.1%) |
Disability Class: Self-Care Difficulty
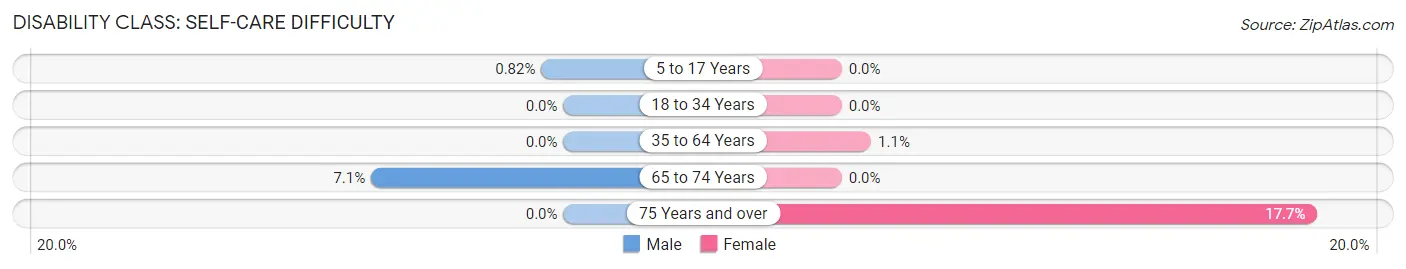
| Age Bracket | Male | Female |
| 5 to 17 Years | 3 (0.8%) | 0 (0.0%) |
| 18 to 34 Years | 0 (0.0%) | 0 (0.0%) |
| 35 to 64 Years | 0 (0.0%) | 5 (1.1%) |
| 65 to 74 Years | 3 (7.1%) | 0 (0.0%) |
| 75 Years and over | 0 (0.0%) | 12 (17.6%) |
Technology Access in Lovettsville
Computing Device Access in Lovettsville
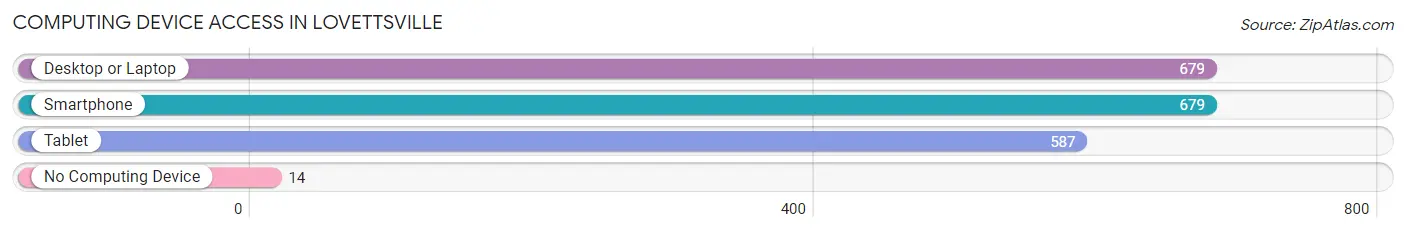
| Device Type | # Households | % Households |
| Desktop or Laptop | 679 | 90.9% |
| Smartphone | 679 | 90.9% |
| Tablet | 587 | 78.6% |
| No Computing Device | 14 | 1.9% |
| Total | 747 | 100.0% |
Internet Access in Lovettsville
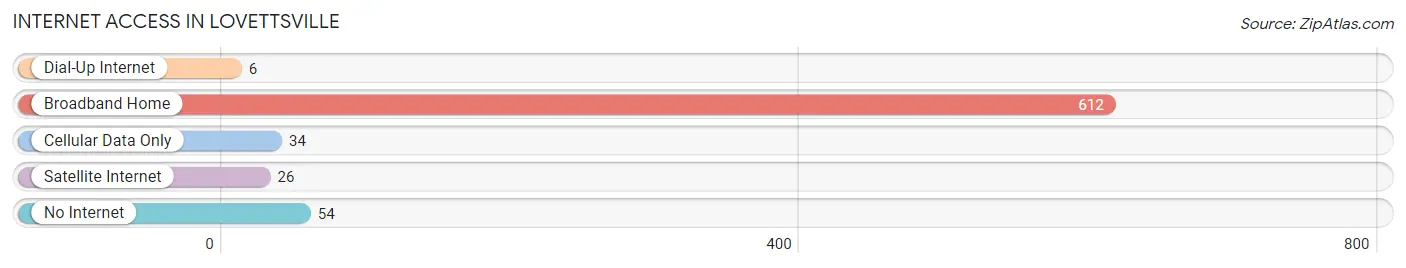
| Internet Type | # Households | % Households |
| Dial-Up Internet | 6 | 0.8% |
| Broadband Home | 612 | 81.9% |
| Cellular Data Only | 34 | 4.5% |
| Satellite Internet | 26 | 3.5% |
| No Internet | 54 | 7.2% |
| Total | 747 | 100.0% |
Lovettsville Summary
Lovettsville, Virginia is a small town located in Loudoun County, Virginia, about 40 miles northwest of Washington, D.C. It is situated in the foothills of the Blue Ridge Mountains and is part of the Washington metropolitan area. The town has a population of 2,077 as of the 2010 census, making it the smallest incorporated town in Loudoun County.
History
Lovettsville was founded in 1798 by German settlers who had migrated from Pennsylvania. The town was named after the Lovett family, who were among the first settlers. The town was originally known as “The German Settlement” and was the first German settlement in the area.
The town was officially incorporated in 1836 and was the first town in Loudoun County to be incorporated. The town was a major center for the production of wheat and other grains, and the town’s economy was largely based on agriculture.
In the late 19th century, the town began to experience a period of growth and development. The town was connected to the Washington and Old Dominion Railroad in 1891, which allowed for the transportation of goods and people to and from the town. The town also experienced a period of industrialization, with the establishment of several factories and mills.
Geography
Lovettsville is located in the foothills of the Blue Ridge Mountains in Loudoun County, Virginia. The town is situated at the intersection of U.S. Route 15 and Virginia State Route 287. The town is located about 40 miles northwest of Washington, D.C.
The town has a total area of 1.2 square miles, all of which is land. The town is located in a rural area and is surrounded by farmland and forests. The town is located in the Catoctin Valley, which is a part of the Great Appalachian Valley.
Economy
The economy of Lovettsville is largely based on agriculture and tourism. The town is home to several farms, which produce a variety of crops, including wheat, corn, soybeans, and hay. The town is also home to several wineries, which produce a variety of wines.
The town is also home to several small businesses, including restaurants, shops, and other services. The town is also home to several bed and breakfasts, which attract tourists from around the region.
Demographics
As of the 2010 census, Lovettsville had a population of 2,077. The town has a population density of 1,717 people per square mile. The racial makeup of the town is 94.3% White, 1.2% African American, 0.3% Native American, 0.7% Asian, 0.1% Pacific Islander, 1.2% from other races, and 2.3% from two or more races.
The median household income in Lovettsville is $90,917, and the median family income is $97,917. The town has a poverty rate of 4.3%. The town has a high rate of homeownership, with 81.3% of the population owning their own homes.
Conclusion
Lovettsville, Virginia is a small town located in Loudoun County, Virginia, about 40 miles northwest of Washington, D.C. The town has a population of 2,077 as of the 2010 census, making it the smallest incorporated town in Loudoun County. The town was founded in 1798 by German settlers and was officially incorporated in 1836. The town’s economy is largely based on agriculture and tourism, and the town has a high rate of homeownership.
Common Questions
What is Per Capita Income in Lovettsville?
Per Capita income in Lovettsville is $41,930.
What is the Median Family Income in Lovettsville?
Median Family Income in Lovettsville is $149,500.
What is the Median Household income in Lovettsville?
Median Household Income in Lovettsville is $137,411.
What is Income or Wage Gap in Lovettsville?
Income or Wage Gap in Lovettsville is 43.0%.
Women in Lovettsville earn 57.0 cents for every dollar earned by a man.
What is Inequality or Gini Index in Lovettsville?
Inequality or Gini Index in Lovettsville is 0.32.
What is the Total Population of Lovettsville?
Total Population of Lovettsville is 2,666.
What is the Total Male Population of Lovettsville?
Total Male Population of Lovettsville is 1,298.
What is the Total Female Population of Lovettsville?
Total Female Population of Lovettsville is 1,368.
What is the Ratio of Males per 100 Females in Lovettsville?
There are 94.88 Males per 100 Females in Lovettsville.
What is the Ratio of Females per 100 Males in Lovettsville?
There are 105.39 Females per 100 Males in Lovettsville.
What is the Median Population Age in Lovettsville?
Median Population Age in Lovettsville is 31.1 Years.
What is the Average Family Size in Lovettsville
Average Family Size in Lovettsville is 3.8 People.
What is the Average Household Size in Lovettsville
Average Household Size in Lovettsville is 3.6 People.
How Large is the Labor Force in Lovettsville?
There are 1,323 People in the Labor Forcein in Lovettsville.
What is the Percentage of People in the Labor Force in Lovettsville?
74.8% of People are in the Labor Force in Lovettsville.
What is the Unemployment Rate in Lovettsville?
Unemployment Rate in Lovettsville is 1.3%.