Cities with the Highest Percentage of Immigrants from Taiwan in Virginia
RELATED REPORTS & OPTIONS
Taiwan
Virginia
Compare Cities
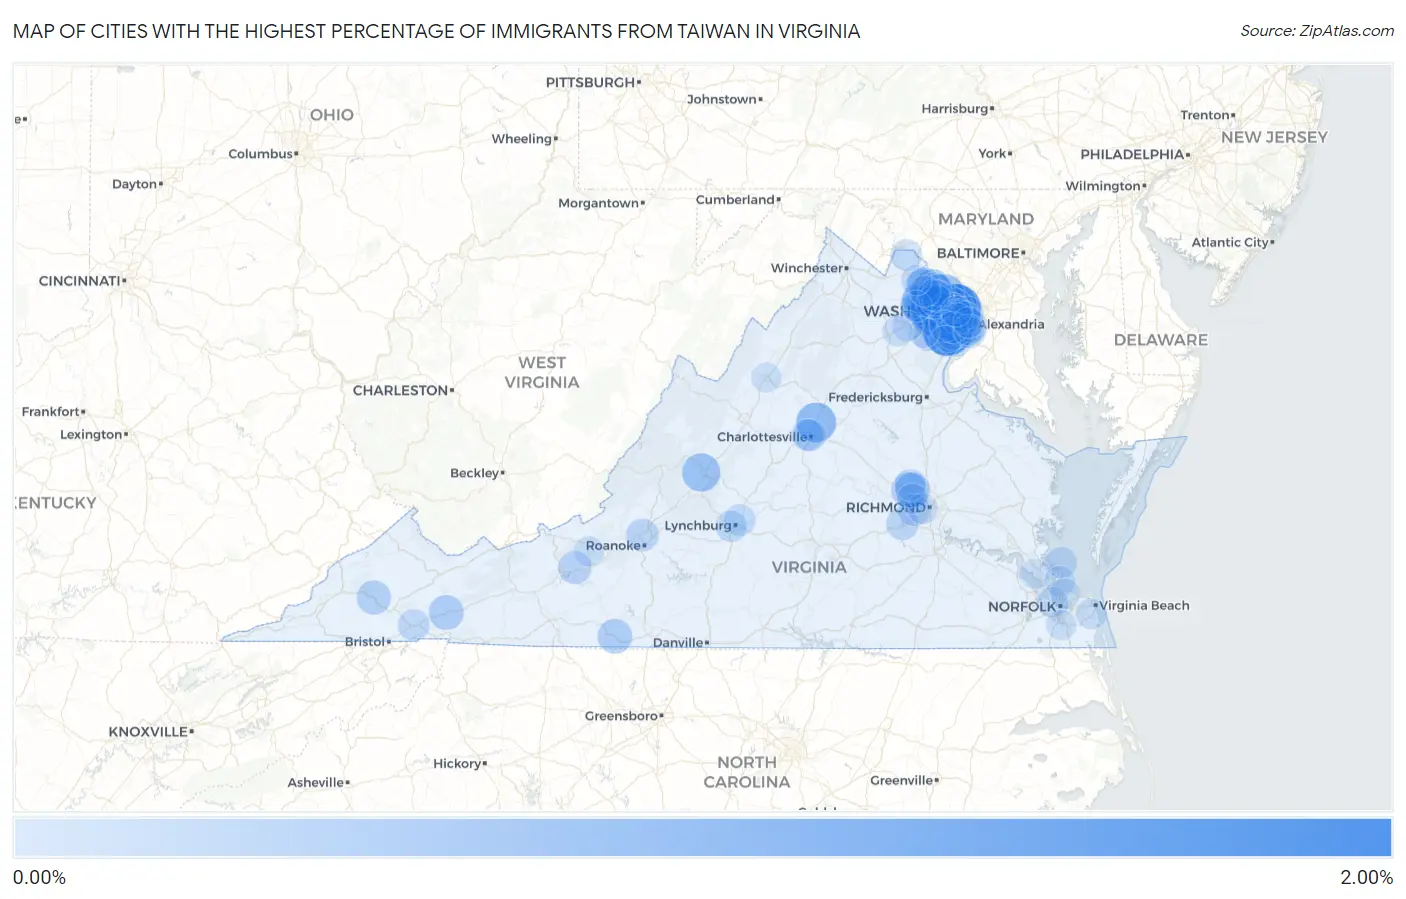
Map of Cities with the Highest Percentage of Immigrants from Taiwan in Virginia
0.00%
2.00%
Cities with the Highest Percentage of Immigrants from Taiwan in Virginia
| City | Taiwan | vs State | vs National | |
| 1. | One Loudoun | 1.91% | 0.082%(+1.83)#1 | 0.11%(+1.79)#104 |
| 2. | Pimmit Hills | 1.75% | 0.082%(+1.67)#2 | 0.11%(+1.64)#116 |
| 3. | South Run | 1.69% | 0.082%(+1.60)#3 | 0.11%(+1.57)#121 |
| 4. | Great Falls Crossing | 1.37% | 0.082%(+1.29)#4 | 0.11%(+1.25)#154 |
| 5. | Floris | 1.23% | 0.082%(+1.15)#5 | 0.11%(+1.11)#176 |
| 6. | Mclean | 1.02% | 0.082%(+0.941)#6 | 0.11%(+0.909)#228 |
| 7. | Merrifield | 0.87% | 0.082%(+0.792)#7 | 0.11%(+0.760)#288 |
| 8. | Hollymead | 0.87% | 0.082%(+0.788)#8 | 0.11%(+0.756)#290 |
| 9. | Fair Lakes | 0.85% | 0.082%(+0.771)#9 | 0.11%(+0.739)#298 |
| 10. | Long Branch | 0.80% | 0.082%(+0.717)#10 | 0.11%(+0.685)#321 |
| 11. | Great Falls | 0.77% | 0.082%(+0.687)#11 | 0.11%(+0.655)#343 |
| 12. | Tysons | 0.74% | 0.082%(+0.661)#12 | 0.11%(+0.629)#355 |
| 13. | Lexington | 0.71% | 0.082%(+0.626)#13 | 0.11%(+0.594)#369 |
| 14. | Wolf Trap | 0.66% | 0.082%(+0.580)#14 | 0.11%(+0.548)#402 |
| 15. | George Mason | 0.65% | 0.082%(+0.567)#15 | 0.11%(+0.535)#416 |
| 16. | Chantilly | 0.60% | 0.082%(+0.520)#16 | 0.11%(+0.488)#450 |
| 17. | Dunn Loring | 0.59% | 0.082%(+0.504)#17 | 0.11%(+0.472)#464 |
| 18. | Franklin Farm | 0.55% | 0.082%(+0.469)#18 | 0.11%(+0.437)#503 |
| 19. | Countryside | 0.55% | 0.082%(+0.468)#19 | 0.11%(+0.436)#504 |
| 20. | Burke | 0.55% | 0.082%(+0.468)#20 | 0.11%(+0.436)#506 |
| 21. | Vienna | 0.51% | 0.082%(+0.431)#21 | 0.11%(+0.399)#541 |
| 22. | Arcola | 0.49% | 0.082%(+0.411)#22 | 0.11%(+0.379)#565 |
| 23. | South Riding | 0.47% | 0.082%(+0.392)#23 | 0.11%(+0.360)#588 |
| 24. | Fair Oaks | 0.47% | 0.082%(+0.388)#24 | 0.11%(+0.356)#594 |
| 25. | Sully Square | 0.43% | 0.082%(+0.348)#25 | 0.11%(+0.316)#640 |
| 26. | Short Pump | 0.43% | 0.082%(+0.344)#26 | 0.11%(+0.312)#648 |
| 27. | Innsbrook | 0.43% | 0.082%(+0.344)#27 | 0.11%(+0.312)#650 |
| 28. | Chilhowie | 0.42% | 0.082%(+0.340)#28 | 0.11%(+0.308)#656 |
| 29. | Patrick Springs | 0.41% | 0.082%(+0.327)#29 | 0.11%(+0.295)#678 |
| 30. | Rose Hill Cdp Fairfax County | 0.38% | 0.082%(+0.296)#30 | 0.11%(+0.264)#728 |
| 31. | St Paul | 0.35% | 0.082%(+0.273)#31 | 0.11%(+0.241)#762 |
| 32. | Franconia | 0.35% | 0.082%(+0.270)#32 | 0.11%(+0.238)#771 |
| 33. | Belmont | 0.34% | 0.082%(+0.262)#33 | 0.11%(+0.230)#785 |
| 34. | Woodburn | 0.33% | 0.082%(+0.250)#34 | 0.11%(+0.218)#808 |
| 35. | Hayfield | 0.32% | 0.082%(+0.237)#35 | 0.11%(+0.205)#830 |
| 36. | Fairfax Station | 0.29% | 0.082%(+0.212)#36 | 0.11%(+0.180)#901 |
| 37. | Oakton | 0.29% | 0.082%(+0.209)#37 | 0.11%(+0.177)#911 |
| 38. | Centreville | 0.29% | 0.082%(+0.205)#38 | 0.11%(+0.173)#919 |
| 39. | Lorton | 0.28% | 0.082%(+0.195)#39 | 0.11%(+0.163)#934 |
| 40. | Brambleton | 0.27% | 0.082%(+0.190)#40 | 0.11%(+0.158)#948 |
| 41. | Radford | 0.27% | 0.082%(+0.187)#41 | 0.11%(+0.155)#957 |
| 42. | Lansdowne | 0.24% | 0.082%(+0.160)#42 | 0.11%(+0.128)#1,038 |
| 43. | Fairfax | 0.24% | 0.082%(+0.158)#43 | 0.11%(+0.126)#1,041 |
| 44. | Woodlake | 0.22% | 0.082%(+0.143)#44 | 0.11%(+0.111)#1,086 |
| 45. | Cascades | 0.22% | 0.082%(+0.142)#45 | 0.11%(+0.110)#1,090 |
| 46. | Lincolnia | 0.22% | 0.082%(+0.140)#46 | 0.11%(+0.108)#1,095 |
| 47. | Hollins | 0.22% | 0.082%(+0.138)#47 | 0.11%(+0.106)#1,106 |
| 48. | Reston | 0.21% | 0.082%(+0.133)#48 | 0.11%(+0.101)#1,113 |
| 49. | Huntington | 0.20% | 0.082%(+0.120)#49 | 0.11%(+0.088)#1,157 |
| 50. | Mcnair | 0.19% | 0.082%(+0.112)#50 | 0.11%(+0.080)#1,184 |
| 51. | Buckhall | 0.18% | 0.082%(+0.097)#51 | 0.11%(+0.065)#1,255 |
| 52. | Woodlawn Cdp Fairfax County | 0.18% | 0.082%(+0.097)#52 | 0.11%(+0.065)#1,256 |
| 53. | Charlottesville | 0.18% | 0.082%(+0.095)#53 | 0.11%(+0.063)#1,264 |
| 54. | Bon Air | 0.17% | 0.082%(+0.090)#54 | 0.11%(+0.058)#1,287 |
| 55. | Arlington | 0.17% | 0.082%(+0.085)#55 | 0.11%(+0.053)#1,301 |
| 56. | University Of Virginia | 0.17% | 0.082%(+0.084)#56 | 0.11%(+0.052)#1,304 |
| 57. | Kings Park West | 0.16% | 0.082%(+0.077)#57 | 0.11%(+0.045)#1,341 |
| 58. | Springfield | 0.15% | 0.082%(+0.073)#58 | 0.11%(+0.041)#1,357 |
| 59. | Abingdon | 0.14% | 0.082%(+0.062)#59 | 0.11%(+0.030)#1,424 |
| 60. | Lake Barcroft | 0.14% | 0.082%(+0.060)#60 | 0.11%(+0.028)#1,437 |
| 61. | West Falls Church | 0.14% | 0.082%(+0.060)#61 | 0.11%(+0.028)#1,440 |
| 62. | Bailey S Crossroads | 0.14% | 0.082%(+0.060)#62 | 0.11%(+0.028)#1,441 |
| 63. | Newington Forest | 0.13% | 0.082%(+0.053)#63 | 0.11%(+0.021)#1,470 |
| 64. | Lowes Island | 0.13% | 0.082%(+0.052)#64 | 0.11%(+0.019)#1,476 |
| 65. | Crosspointe | 0.13% | 0.082%(+0.050)#65 | 0.11%(+0.018)#1,486 |
| 66. | Dranesville | 0.13% | 0.082%(+0.050)#66 | 0.11%(+0.018)#1,489 |
| 67. | Madison Heights | 0.13% | 0.082%(+0.049)#67 | 0.11%(+0.017)#1,494 |
| 68. | Lynchburg | 0.13% | 0.082%(+0.043)#68 | 0.11%(+0.011)#1,520 |
| 69. | Wyndham | 0.12% | 0.082%(+0.034)#69 | 0.11%(+0.002)#1,573 |
| 70. | Lovettsville | 0.11% | 0.082%(+0.031)#70 | 0.11%(-0.001)#1,596 |
| 71. | Poquoson | 0.11% | 0.082%(+0.031)#71 | 0.11%(-0.001)#1,597 |
| 72. | Herndon | 0.11% | 0.082%(+0.025)#72 | 0.11%(-0.007)#1,629 |
| 73. | Sterling | 0.100% | 0.082%(+0.018)#73 | 0.11%(-0.014)#1,664 |
| 74. | Stone Ridge | 0.100% | 0.082%(+0.018)#74 | 0.11%(-0.014)#1,665 |
| 75. | Hybla Valley | 0.099% | 0.082%(+0.018)#75 | 0.11%(-0.014)#1,666 |
| 76. | Annandale | 0.094% | 0.082%(+0.013)#76 | 0.11%(-0.019)#1,714 |
| 77. | Burke Centre | 0.089% | 0.082%(+0.008)#77 | 0.11%(-0.024)#1,749 |
| 78. | Difficult Run | 0.086% | 0.082%(+0.005)#78 | 0.11%(-0.027)#1,768 |
| 79. | Midlothian | 0.084% | 0.082%(+0.002)#79 | 0.11%(-0.030)#1,794 |
| 80. | West Springfield | 0.081% | 0.082%(-0.000)#80 | 0.11%(-0.032)#1,814 |
| 81. | Ashburn | 0.073% | 0.082%(-0.009)#81 | 0.11%(-0.041)#1,872 |
| 82. | Lake Ridge | 0.063% | 0.082%(-0.019)#82 | 0.11%(-0.051)#1,959 |
| 83. | Groveton | 0.062% | 0.082%(-0.020)#83 | 0.11%(-0.052)#1,973 |
| 84. | Alexandria | 0.055% | 0.082%(-0.027)#84 | 0.11%(-0.059)#2,055 |
| 85. | Virginia Beach | 0.054% | 0.082%(-0.028)#85 | 0.11%(-0.060)#2,072 |
| 86. | Portsmouth | 0.052% | 0.082%(-0.029)#86 | 0.11%(-0.061)#2,091 |
| 87. | Manassas | 0.047% | 0.082%(-0.035)#87 | 0.11%(-0.067)#2,160 |
| 88. | Leesylvania | 0.045% | 0.082%(-0.036)#88 | 0.11%(-0.068)#2,184 |
| 89. | Idylwood | 0.045% | 0.082%(-0.037)#89 | 0.11%(-0.069)#2,185 |
| 90. | Richmond | 0.043% | 0.082%(-0.039)#90 | 0.11%(-0.071)#2,218 |
| 91. | Gainesville | 0.041% | 0.082%(-0.040)#91 | 0.11%(-0.072)#2,234 |
| 92. | Leesburg | 0.037% | 0.082%(-0.045)#92 | 0.11%(-0.077)#2,281 |
| 93. | New Baltimore | 0.026% | 0.082%(-0.056)#93 | 0.11%(-0.088)#2,432 |
| 94. | Hampton | 0.024% | 0.082%(-0.058)#94 | 0.11%(-0.090)#2,447 |
| 95. | Tuckahoe | 0.023% | 0.082%(-0.059)#95 | 0.11%(-0.091)#2,463 |
| 96. | Chesapeake | 0.022% | 0.082%(-0.060)#96 | 0.11%(-0.092)#2,479 |
| 97. | Norfolk | 0.016% | 0.082%(-0.066)#97 | 0.11%(-0.098)#2,549 |
| 98. | Blacksburg | 0.016% | 0.082%(-0.066)#98 | 0.11%(-0.098)#2,550 |
| 99. | Harrisonburg | 0.012% | 0.082%(-0.070)#99 | 0.11%(-0.102)#2,579 |
| 100. | Newport News | 0.0043% | 0.082%(-0.077)#100 | 0.11%(-0.109)#2,641 |
Common Questions
What are the Top 10 Cities with the Highest Percentage of Immigrants from Taiwan in Virginia?
Top 10 Cities with the Highest Percentage of Immigrants from Taiwan in Virginia are:
#1
1.75%
#2
1.69%
#3
1.23%
#4
1.02%
#5
0.87%
#6
0.87%
#7
0.85%
#8
0.80%
#9
0.77%
#10
0.74%
What city has the Highest Percentage of Immigrants from Taiwan in Virginia?
Pimmit Hills has the Highest Percentage of Immigrants from Taiwan in Virginia with 1.75%.
What is the Percentage of Immigrants from Taiwan in the State of Virginia?
Percentage of Immigrants from Taiwan in Virginia is 0.082%.
What is the Percentage of Immigrants from Taiwan in the United States?
Percentage of Immigrants from Taiwan in the United States is 0.11%.