Zip Codes with the Highest Percentage of Population Employed in Computer & Mathematics in Henderson, TX
RELATED REPORTS & OPTIONS
Computer & Mathematics
Henderson
Compare Zip Codes
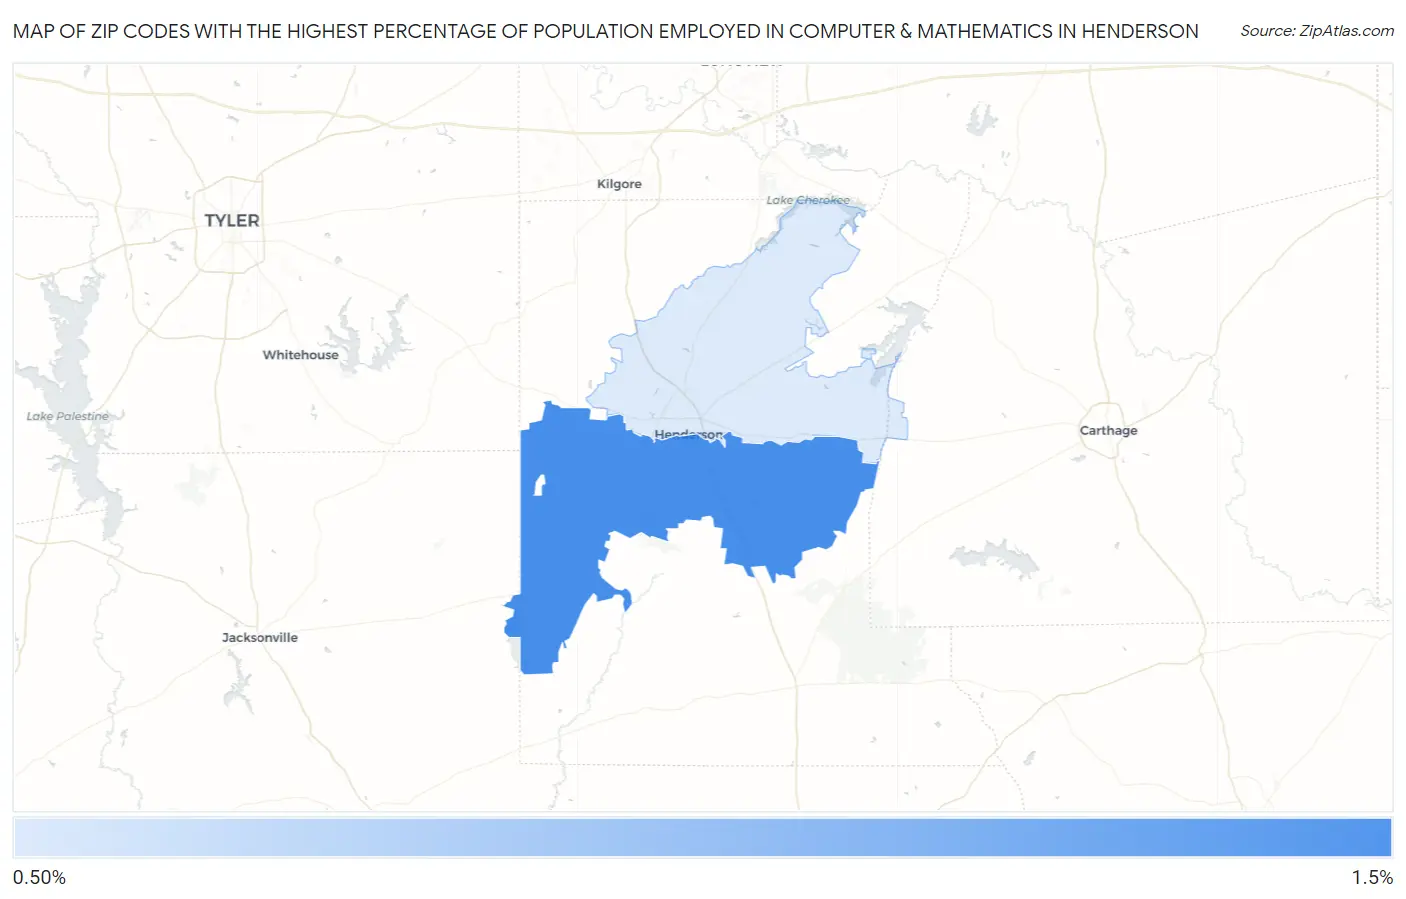
Map of Zip Codes with the Highest Percentage of Population Employed in Computer & Mathematics in Henderson
1.0%
1.1%
Zip Codes with the Highest Percentage of Population Employed in Computer & Mathematics in Henderson, TX
| Zip Code | % Employed | vs State | vs National | |
| 1. | 75654 | 1.1% | 3.4%(-2.37)#938 | 3.5%(-2.46)#16,962 |
| 2. | 75652 | 1.0% | 3.4%(-2.39)#947 | 3.5%(-2.48)#17,110 |
1
Common Questions
What are the Top Zip Codes with the Highest Percentage of Population Employed in Computer & Mathematics in Henderson, TX?
Top Zip Codes with the Highest Percentage of Population Employed in Computer & Mathematics in Henderson, TX are:
What zip code has the Highest Percentage of Population Employed in Computer & Mathematics in Henderson, TX?
75654 has the Highest Percentage of Population Employed in Computer & Mathematics in Henderson, TX with 1.1%.
What is the Percentage of Population Employed in Computer & Mathematics in Henderson, TX?
Percentage of Population Employed in Computer & Mathematics in Henderson is 1.7%.
What is the Percentage of Population Employed in Computer & Mathematics in Texas?
Percentage of Population Employed in Computer & Mathematics in Texas is 3.4%.
What is the Percentage of Population Employed in Computer & Mathematics in the United States?
Percentage of Population Employed in Computer & Mathematics in the United States is 3.5%.