Zip Codes with the Highest Percentage of Population Employed in Computer & Mathematics in Stephenville, TX
RELATED REPORTS & OPTIONS
Computer & Mathematics
Stephenville
Compare Zip Codes
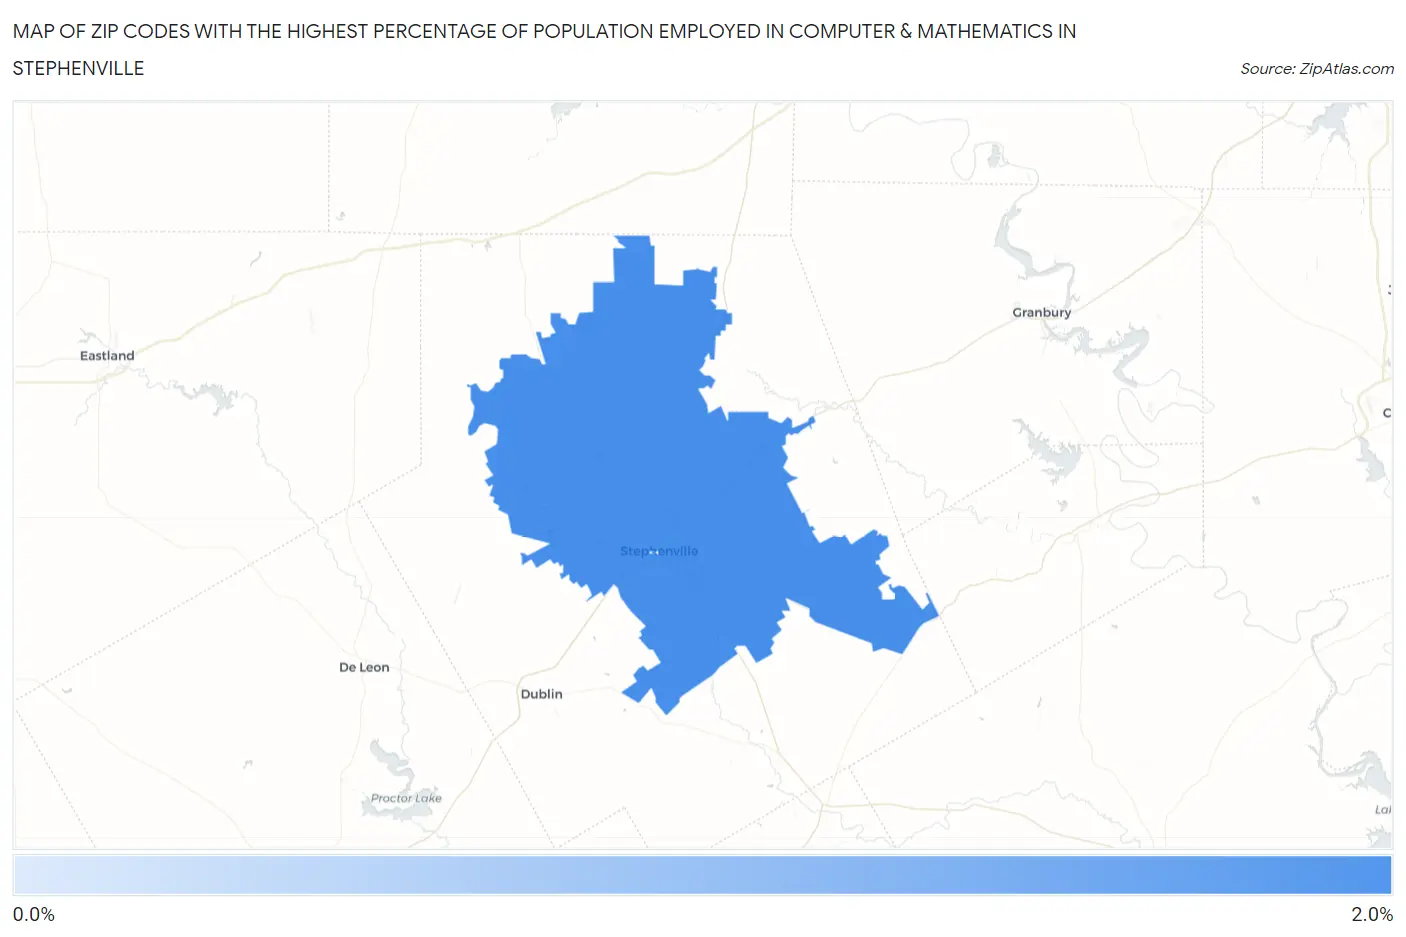
Map of Zip Codes with the Highest Percentage of Population Employed in Computer & Mathematics in Stephenville
0.70%
1.7%
Zip Codes with the Highest Percentage of Population Employed in Computer & Mathematics in Stephenville, TX
| Zip Code | % Employed | vs State | vs National | |
| 1. | 76401 | 1.7% | 3.4%(-1.73)#704 | 3.5%(-1.82)#13,210 |
| 2. | 76402 | 0.70% | 3.4%(-2.74)#1,092 | 3.5%(-2.83)#19,278 |
1
Common Questions
What are the Top Zip Codes with the Highest Percentage of Population Employed in Computer & Mathematics in Stephenville, TX?
Top Zip Codes with the Highest Percentage of Population Employed in Computer & Mathematics in Stephenville, TX are:
What zip code has the Highest Percentage of Population Employed in Computer & Mathematics in Stephenville, TX?
76401 has the Highest Percentage of Population Employed in Computer & Mathematics in Stephenville, TX with 1.7%.
What is the Percentage of Population Employed in Computer & Mathematics in Stephenville, TX?
Percentage of Population Employed in Computer & Mathematics in Stephenville is 2.0%.
What is the Percentage of Population Employed in Computer & Mathematics in Texas?
Percentage of Population Employed in Computer & Mathematics in Texas is 3.4%.
What is the Percentage of Population Employed in Computer & Mathematics in the United States?
Percentage of Population Employed in Computer & Mathematics in the United States is 3.5%.