Zip Codes with the Highest Percentage of Population Employed in Computer & Mathematics in Hurst, TX
RELATED REPORTS & OPTIONS
Computer & Mathematics
Hurst
Compare Zip Codes
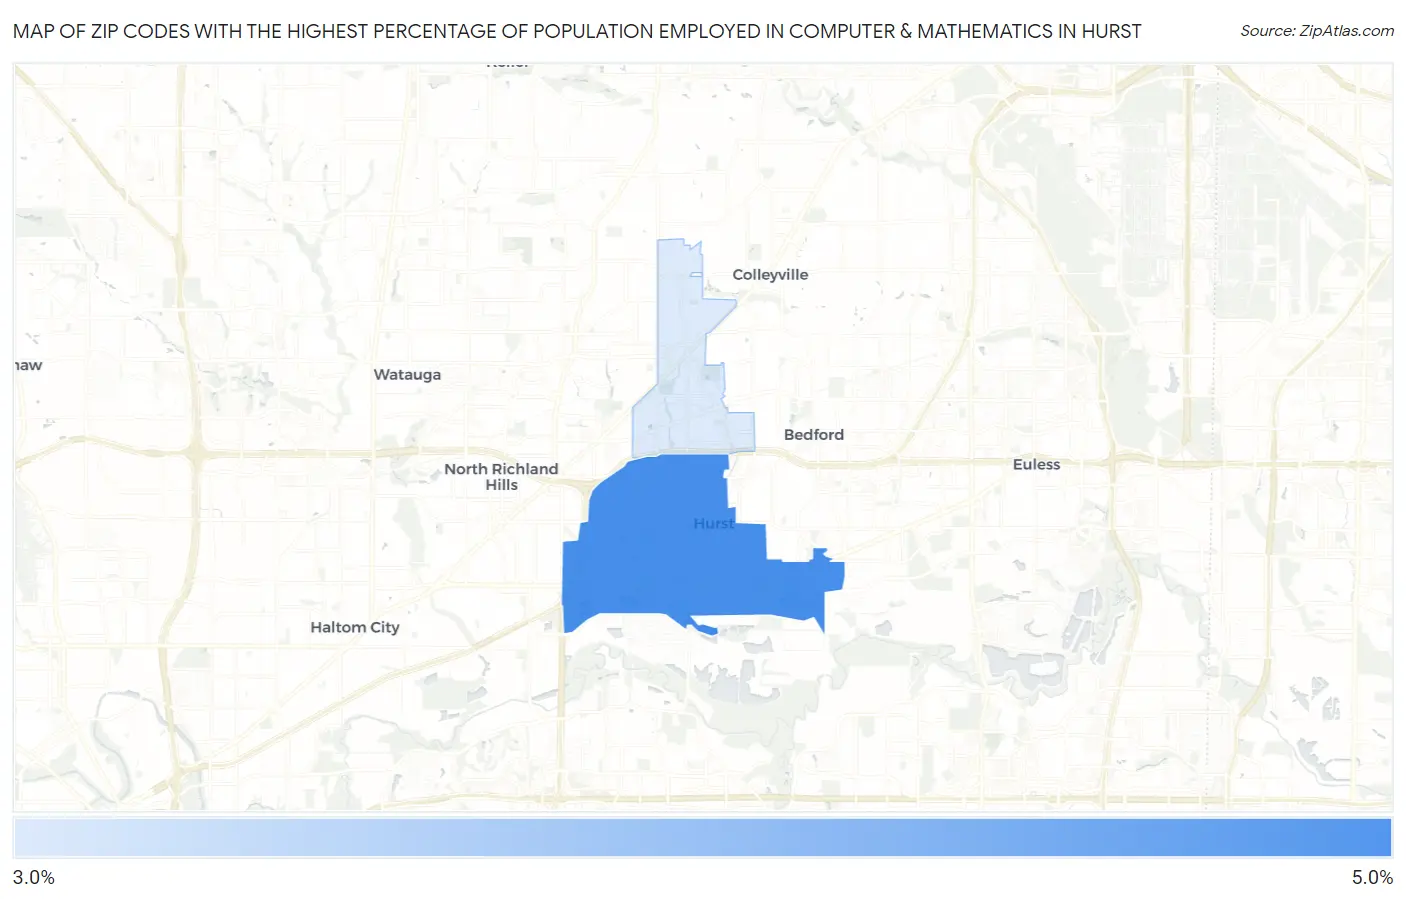
Map of Zip Codes with the Highest Percentage of Population Employed in Computer & Mathematics in Hurst
3.7%
4.2%
Zip Codes with the Highest Percentage of Population Employed in Computer & Mathematics in Hurst, TX
| Zip Code | % Employed | vs State | vs National | |
| 1. | 76053 | 4.2% | 3.4%(+0.730)#271 | 3.5%(+0.642)#4,682 |
| 2. | 76054 | 3.7% | 3.4%(+0.234)#322 | 3.5%(+0.145)#5,803 |
1
Common Questions
What are the Top Zip Codes with the Highest Percentage of Population Employed in Computer & Mathematics in Hurst, TX?
Top Zip Codes with the Highest Percentage of Population Employed in Computer & Mathematics in Hurst, TX are:
What zip code has the Highest Percentage of Population Employed in Computer & Mathematics in Hurst, TX?
76053 has the Highest Percentage of Population Employed in Computer & Mathematics in Hurst, TX with 4.2%.
What is the Percentage of Population Employed in Computer & Mathematics in Hurst, TX?
Percentage of Population Employed in Computer & Mathematics in Hurst is 3.7%.
What is the Percentage of Population Employed in Computer & Mathematics in Texas?
Percentage of Population Employed in Computer & Mathematics in Texas is 3.4%.
What is the Percentage of Population Employed in Computer & Mathematics in the United States?
Percentage of Population Employed in Computer & Mathematics in the United States is 3.5%.