Zip Codes with the Highest Percentage of Population Employed in Computer & Mathematics in Gilmer, TX
RELATED REPORTS & OPTIONS
Computer & Mathematics
Gilmer
Compare Zip Codes
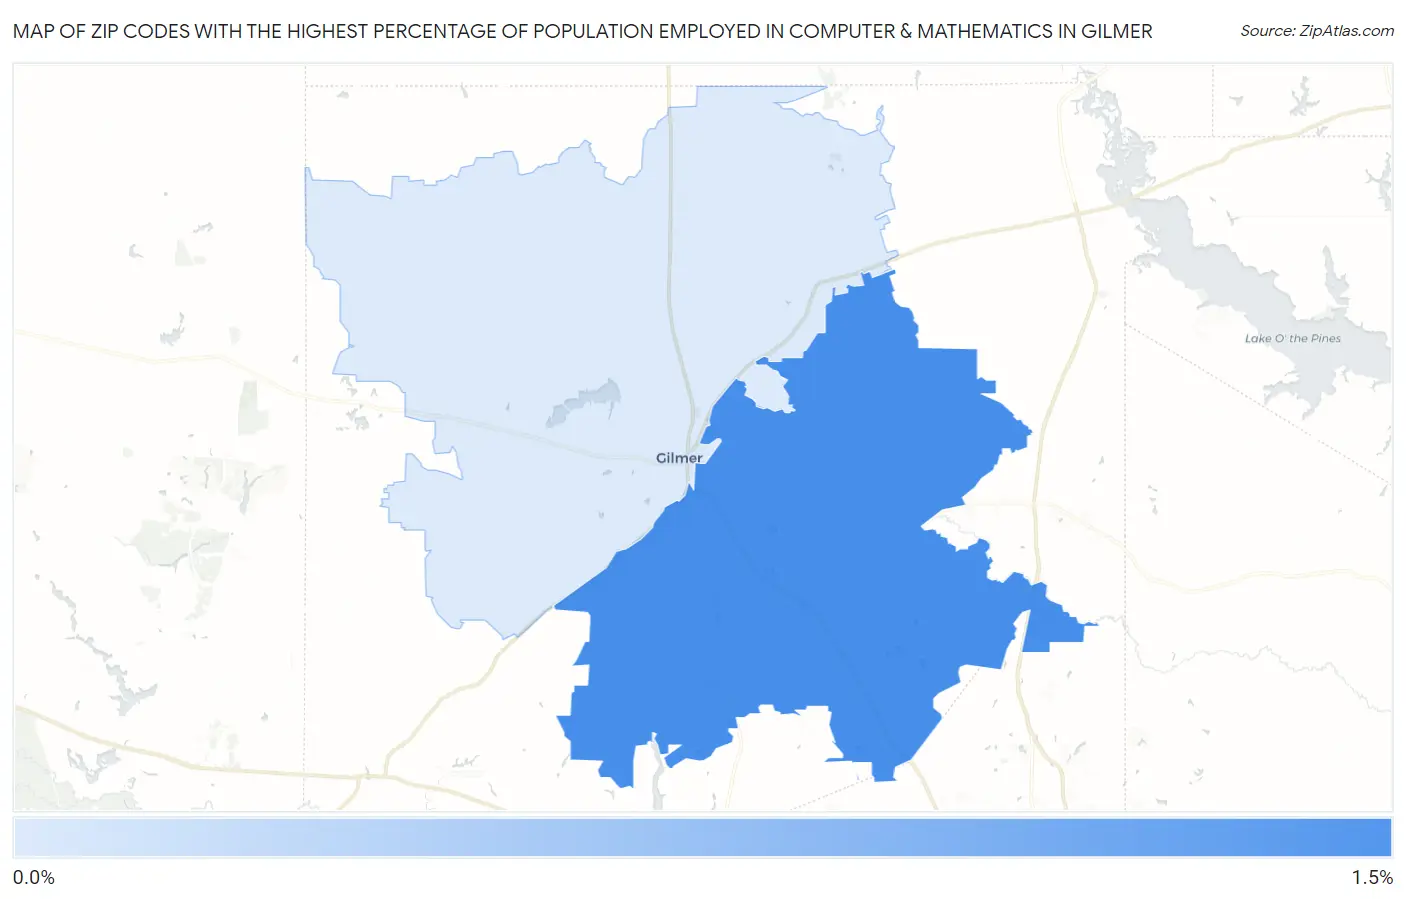
Map of Zip Codes with the Highest Percentage of Population Employed in Computer & Mathematics in Gilmer
0.26%
1.1%
Zip Codes with the Highest Percentage of Population Employed in Computer & Mathematics in Gilmer, TX
| Zip Code | % Employed | vs State | vs National | |
| 1. | 75645 | 1.1% | 3.4%(-2.30)#908 | 3.5%(-2.38)#16,474 |
| 2. | 75644 | 0.26% | 3.4%(-3.17)#1,275 | 3.5%(-3.26)#21,795 |
1
Common Questions
What are the Top Zip Codes with the Highest Percentage of Population Employed in Computer & Mathematics in Gilmer, TX?
Top Zip Codes with the Highest Percentage of Population Employed in Computer & Mathematics in Gilmer, TX are:
What zip code has the Highest Percentage of Population Employed in Computer & Mathematics in Gilmer, TX?
75645 has the Highest Percentage of Population Employed in Computer & Mathematics in Gilmer, TX with 1.1%.
What is the Percentage of Population Employed in Computer & Mathematics in Gilmer, TX?
Percentage of Population Employed in Computer & Mathematics in Gilmer is 0.42%.
What is the Percentage of Population Employed in Computer & Mathematics in Texas?
Percentage of Population Employed in Computer & Mathematics in Texas is 3.4%.
What is the Percentage of Population Employed in Computer & Mathematics in the United States?
Percentage of Population Employed in Computer & Mathematics in the United States is 3.5%.